8-K: Current report filing
Published on May 23, 2023
UNITED STATES
SECURITIES AND EXCHANGE COMMISSION
Washington, D.C. 20549
FORM
CURRENT REPORT
PURSUANT TO SECTION 13 OR 15(d)
OF THE SECURITIES EXCHANGE ACT OF 1934
Date of Report (Date of earliest event reported)
(Exact Name of Registrant as Specified in its Charter)
| (State or Other Jurisdiction of Incorporation) |
(Commission File Number) |
(IRS Employer Identification No.) |
(Address of principal executive offices)
(Zip Code)
Registrant’s telephone number, including area code:
(Former Name or Former Address, if Changed Since Last Report)
Check the appropriate box below if the Form 8-K filing is intended to simultaneously satisfy the filing obligation of the registrant under any of the following provisions:
| Written communications pursuant to Rule 425 under the Securities Act (17 CFR 230.425) |
| Soliciting material pursuant to Rule 14a-12 under the Exchange Act (17 CFR 240.14a-12) |
| Pre-commencement communications pursuant to Rule 14d-2(b) under the Exchange Act (17 CFR 240.14d-2(b)) |
| Pre-commencement communications pursuant to Rule 13e-4(c) under the Exchange Act (17 CFR 240.13e-4(c)) |
Securities registered pursuant to Section 12(b) of the Exchange Act:
| Title of each class |
Trading Symbol(s) |
Name of each exchange on which registered |
||
Indicate by check mark whether the registrant is an emerging growth company as defined in Rule 405 of the Securities Act of 1933 (§230.405 of this chapter) or Rule 12b-2 of the Securities Exchange Act of 1934 (§240.12b-2 of this chapter).
Emerging Growth Company
If an emerging growth company, indicate by check mark if the registrant has elected not to use the extended transition period for complying with any new or revised financial accounting standards provided pursuant to Section 13(a) of the Exchange Act. ☐
| Item 8.01 | Other Events |
On May 23, 2023, Hannon Armstrong Sustainable Infrastructure Capital, Inc. (the “Company”) filed a preliminary prospectus supplement relating to an effective registration statement with the Securities and Exchange Commission on Form S-3 (333-263169) in which the following was set forth. References herein to “we,” “our,” “us” and “our company” refer to the Company, Hannon Armstrong Sustainable Infrastructure, L.P., and any of the Company’s other subsidiaries.
Investments Overview
Our investments in climate solutions are focused on three markets:
| • | Behind-the-Meter, or BTM: distributed building or facility projects, which reduce energy usage or cost through the use of solar generation and energy storage or energy efficiency improvements including heating, ventilation and air conditioning systems, or HVAC, lighting, energy controls, roofs, windows, building shells, and/or combined heat and power systems; |
| • | Grid-Connected, or GC: renewable energy projects that deploy cleaner energy sources, such as solar, solar-plus-storage, and wind, to generate power production where the off-taker or counterparty may be part of the wholesale electric power markets; and |
| • | Fuels, Transport and Nature, or FTN: renewable natural gas (RNG) plants, transportation fleet enhancements, and ecological restoration projects, among others, that increase resiliency or more efficiently use natural resources. |
As of March 31, 2023, we held approximately $4.7 billion of transactions on our balance sheet, which we refer to as our “Portfolio,” an increase of approximately $0.4 billion from December 31, 2022.
The following chart illustrates our Portfolio by asset class as of March 31, 2023:
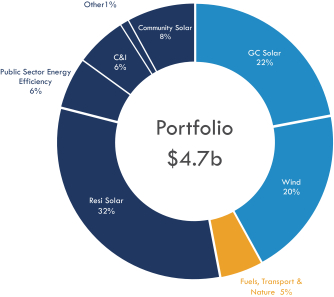
As of March 31, 2023, our Portfolio consisted of over 350 investments in approximately 8 asset classes, with an unlevered portfolio yield of 7.5%. From our Portfolio, as of March 31, 2023, our BTM investments had a yield of 7.9% and a production of 3 GW, our GC investments had a yield of 7.0% and a production of 11 GW and our FTN investments had a yield of 7.5%.
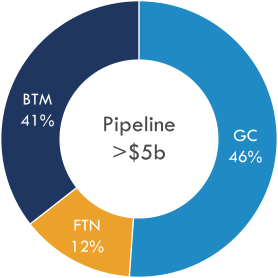
We have a large and active pipeline of potential new opportunities in over 8 asset classes that are in various stages of our underwriting process.
The following chart illustrates our pipeline of transactions that could potentially close in the next 12 months as of March 31, 2023:
Our clients include over 40 leading clean energy and infrastructure companies and our strategy combines relationship-based investing with in-house portfolio management and engineering expertise to generate attractive risk adjusted fixed rate returns from a diversified portfolio of long-term, recurring and predictable cash flows. We focus on projects that use proven technology and that often have contractually committed agreements with an investment grade rated off-taker or counterparties and often hold a senior or preferred position in many of our investments. We believe our strategy is reflected in our loss history as we have experienced less than 20 bps of cumulative credit losses (net of recoveries) since 2012 (calculation represents credit losses as a percentage of cumulative originations, excluding equity method investments).
From 2014 through 2022 and from 2019 through 2022, we have experienced consistent growth in our distributable earnings per share and our dividends, respectively. In recent years, we have further diversified our sources of funding as compared to the period following our initial public offering. In addition, we have developed lending relationships with more than 15 banks and have raised debt from more than 200 institutional investors.
Non-GAAP Measures
Adjusted Cash Flow from Operations plus Other Portfolio Collections
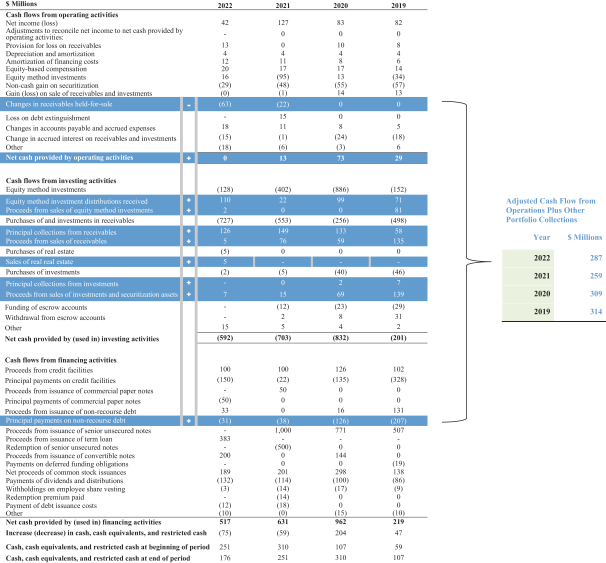
We operate our business in a manner that considers total cash collected from our Portfolio and necessary operating and debt service payments to assess the amount of cash we have available to fund investments and distributions. The line items from our Statement of Cash Flows that are relevant to this measure are highlighted in the graphic below. We believe that the aggregate of these items, which combine as a non-GAAP financial measure titled Adjusted Cash Flow from Operations plus Other Portfolio Collections, is a useful measure of the liquidity we have available from our assets to fund both new investments and our regular quarterly dividends. This non-GAAP financial measure may not be comparable to similarly titled or other similar measures used by other companies. Although there is also not a directly comparable GAAP measure that demonstrates how we consider cash available for dividend payment, set forth below is how Adjusted Cash Flow from Operations plus Other Portfolio Collections compares to GAAP Net cash provided by operating activities.
Adjusted Cash Flow from Operations plus Other Portfolio Collections differs from GAAP Net cash provided by operating activities on our Statement of Cash Flows, in that it (A) excludes Changes in receivables held-for-sale, (B) adds cash flow from Equity method investment distributions received, Proceeds from sales of equity method investments, Principal collections from receivables, Proceeds from sales of receivables, Principal collections from investments, and Proceeds from sales of investments and securitization assets, and (C) subtracts Principal payments on non-recourse debt.
In addition, in order to calculate this measure for the 12 months ended March 31, 2023, the following methodology should be used: (1) Apply the methodology set forth in the immediately preceding paragraph to our Statement of Cash Flows for the year ended December 31, 2022; (2) apply the methodology set forth in the immediately preceding paragraph to our Statement of Cash Flows for the quarter ended March 31, 2023; (3) apply the methodology set forth in the immediately preceding paragraph to our Statement of Cash Flows for the quarter ended March 31, 2022; (4) add the result obtained in clause (2) above to the result obtained in clause (1) above; and (5) subtract the result obtained in clause (3) from the result obtained in clause (4) above. This measure is not intended to demonstrate an alternative view of cash available from investment returns for dividend payment. Our Statement of Cash Flows for the year ended December 31, 2022 is included in the graphic below. Our Statements of Cash Flows for the three months ended March 31, 2023 and March 31, 2022 are included in our Quarterly report for the quarter ended March 31, 2023 that is incorporated herein by reference. Also, Adjusted Cash Flow from Operations plus Other Portfolio Collections differs from Net cash provided by (used in) investing activities in that it excludes many of the uses of cash used in our investing activities such as in Equity method investments, Purchases of and investments in receivables, Purchases of real estate, Purchases of investments, Funding of escrow accounts, and excludes Withdrawal from escrow accounts, and Other.
In addition, Adjusted Cash Flow from Operations plus Other Portfolio Collections is not comparable to Net cash provided by (used in) financing activities in that it excludes many of our financing activities such as proceeds from common stock issuances and borrowings and repayments of unsecured debt.
For the years ended December 31, 2022, 2021, 2020 and 2019, our Net cash provided by operating activities was $0, $13 million, $73 million and $29 million, respectively.
The following table illustrates the calculation of Adjusted Cash Flow from Operations plus Other Portfolio Collections from our GAAP Statement of Cash Flows:
The following table illustrates our cash flow sources and uses for the years ended December 31, 2022, 2021, 2020 and 2019:
| 2022 | 2021 | 2020 | 2019 | |||||||||||||
| $ Millions(1) | ||||||||||||||||
| Adjusted Cash Flow from Operations Plus Other Portfolio Collections |
$287 | $259 | $ 309 | $314 | ||||||||||||
| (-) Dividend |
($132 | ) | ($114 | ) | ($ 100 | ) | ($ 86 | ) | ||||||||
|
|
|
|
|
|
|
|
|
|||||||||
| (=) Cash Available for Reinvestment |
$155 | $146 | $ 209 | $227 | ||||||||||||
| (-) Investments Funded |
($871 | ) | ($960 | ) | ($1,183 | ) | ($715 | ) | ||||||||
| (+) Capital Raised |
$693 | $796 | $1,206 | $540 | ||||||||||||
| Other Sources/Uses of Cash |
($ 51 | ) | ($ 41 | ) | ($ 28 | ) | ($ 5 | ) | ||||||||
|
|
|
|
|
|
|
|
|
|||||||||
| Change in Cash |
($ 74 | ) | ($ 59 | ) | $ 204 | $ 47 | ||||||||||
| (1) | Amounts may not sum due to rounding |
Adjusted Cash Flow from Operations plus Other Portfolio Collections historically have exceeded dividends and we have reinvested the excess cash flows in our Portfolio.
SIGNATURES
Pursuant to the requirements of the Securities Exchange Act of 1934, the registrant has duly caused this report to be signed on its behalf by the undersigned hereunto duly authorized.
| HANNON ARMSTRONG SUSTAINABLE INFRASTRUCTURE CAPITAL, INC. | ||
| By: | /s/ Steven L. Chuslo |
|
|
|
Steven L. Chuslo | |
|
|
Executive Vice President and Chief Legal Officer | |
Date: May 23, 2023