10-Q: Quarterly report [Sections 13 or 15(d)]
Published on May 8, 2026
UNITED STATES
SECURITIES AND EXCHANGE COMMISSION
WASHINGTON, DC 20549
FORM 10-Q
| QUARTERLY REPORT PURSUANT TO SECTION 13 OR 15(d) OF THE SECURITIES EXCHANGE ACT OF 1934 | |||||
For the quarterly period ended March 31, 2026
OR
| TRANSITION REPORT PURSUANT TO SECTION 13 OR 15(d) OF THE SECURITIES EXCHANGE ACT OF 1934 | |||||
For the transition period from to
Commission file number 001-35877

(Exact name of registrant as specified in its charter)
| (State or other jurisdiction of incorporation or organization) | (I.R.S. Employer Identification No.) | ||||||||||
| (Address of principal executive offices) | (Zip code) | ||||||||||
(410 ) 571-9860
(Registrant’s telephone number, including area code)
N/A
(Former name, former address and former fiscal year, if changed since last report)
Securities registered pursuant to Section 12(b) of the Act:
| Title of each class | Trading Symbol(s) | Name of each exchange on which registered | ||||||
Indicate by check mark whether the registrant (1) has filed all reports required to be filed by Section 13 or 15(d) of the Securities Exchange Act of 1934 during the preceding 12 months (or for such shorter period that the registrant was required to file such reports), and (2) has been subject to such filing requirements for the past 90 days. Yes ☒ No ☐
Indicate by check mark whether the registrant has submitted electronically every Interactive Data File required to be submitted pursuant to Rule 405 of Regulation S-T (§232.405 of this chapter) during the preceding 12 months (or for such shorter period that the registrant was required to submit such files). Yes ☒ No ☐
Indicate by check mark whether the registrant is a large accelerated filer, an accelerated filer, a non-accelerated filer, a smaller reporting company, or an emerging growth company. See the definitions of “large accelerated filer,” “accelerated filer,” “smaller reporting company” and “emerging growth company” in Rule 12b-2 of the Exchange Act.
| ☒ | Accelerated filer | ☐ | ||||||||||||||||||
| Non-accelerated filer | ☐ | Smaller reporting company | ||||||||||||||||||
| Emerging growth company | ||||||||||||||||||||
If an emerging growth company, indicate by check mark if the registrant has elected not to use the extended transition period for complying with any new or revised financial accounting standards provided pursuant to Section 13(a) of the Exchange Act. ¨
Indicate by check mark whether the registrant is a shell company (as defined in Rule 12b-2 of the Exchange Act). Yes ☐ No ☒
Indicate the number of shares outstanding of each of the issuer’s classes of common stock as of the latest practicable date: 128,432,763 shares of common stock, par value $0.01 per share, outstanding as of May 5, 2026 (which includes 631,697 shares of unvested restricted common stock).
FORWARD-LOOKING STATEMENTS
We make forward-looking statements in this Quarterly Report on Form 10-Q (“Form 10-Q”) within the meaning of Section 27A of the Securities Act of 1933, as amended (the “Securities Act”), and Section 21E of the Securities Exchange Act of 1934, as amended (the “Exchange Act”) that are subject to risks and uncertainties. For these statements, we claim the protections of the safe harbor for forward-looking statements contained in such Sections. These forward-looking statements include information about possible or assumed future results of our business, financial condition, liquidity, results of operations, plans and objectives. When we use the words “believe,” “expect,” “anticipate,” “estimate,” “plan,” “continue,” “intend,” “should,” “may” or similar expressions, we intend to identify forward-looking statements. However, the absence of these words or similar expressions does not mean that a statement is not forward-looking. All statements that address operating performance, events or developments that we expect or anticipate will occur in the future are forward-looking statements.
Forward-looking statements are subject to significant risks and uncertainties. Investors are cautioned against placing undue reliance on such statements. Actual results may differ materially from those set forth in the forward-looking statements. Accordingly, any such statements are qualified in their entirety by reference to, and are accompanied by, important factors included in Part I, Item 1A. Risk Factors contained in our Annual Report on Form 10-K for the year ended December 31, 2025, as amended by Amendment No. 1 to our Annual Report on Form 10-K for the year ended December 31, 2025 (collectively, our “2025 Form 10-K”) (in addition to any assumptions and other factors referred to specifically in connection with such forward-looking statements) that could have a significant impact on our operations and financial results, and could cause our actual results to differ materially from those contained or implied in forward-looking statements made by us or on our behalf in this Form 10-Q, in presentations, on our websites, in response to questions or otherwise.
Any forward-looking statement speaks only as of the date on which such statement is made, and we undertake no obligation to update any forward-looking statement to reflect events or circumstances, including, but not limited to, unanticipated events, after the date on which such statement is made, unless otherwise required by law. New factors emerge from time to time and it is not possible for management to predict all of such factors, nor can it assess the impact of each such factor on the business or the extent to which any factor, or combination of factors, may cause actual results to differ materially from those contained or implied in any forward-looking statement.
- i -
TABLE OF CONTENTS
| Page | ||||||||
| Item 1. | ||||||||
| Item 2. | ||||||||
| Item 3. | ||||||||
| Item 4. | ||||||||
| Item 1. | ||||||||
| Item 1A. | ||||||||
| Item 2. | ||||||||
| Item 3. | ||||||||
| Item 4. | ||||||||
| Item 5. | ||||||||
| Item 6. | ||||||||
- ii -
PART I. FINANCIAL INFORMATION
Item 1. Financial Statements
HA SUSTAINABLE INFRASTRUCTURE CAPITAL, INC.
CONDENSED CONSOLIDATED BALANCE SHEETS
(DOLLARS IN THOUSANDS, EXCEPT PER SHARE DATA)
(UNAUDITED)
| March 31, 2026 (unaudited) | December 31, 2025 | ||||||||||
| Assets | |||||||||||
| Cash and cash equivalents | $ | $ | |||||||||
| Equity method investments | |||||||||||
Receivables, net of allowance of $ | |||||||||||
Receivables held-for-sale | |||||||||||
Real estate and available-for-sale debt securities | |||||||||||
Retained interests in securitization trusts, net of allowance of $ | |||||||||||
| Other assets | |||||||||||
| Total Assets | $ | $ | |||||||||
| Liabilities and Stockholders’ Equity | |||||||||||
| Liabilities: | |||||||||||
| Accounts payable, accrued expenses and other | $ | $ | |||||||||
| Credit facilities | |||||||||||
| Commercial paper notes | |||||||||||
| Term loans payable | |||||||||||
Non-recourse debt (secured by assets of $ | |||||||||||
| Senior notes | |||||||||||
Junior subordinated notes | |||||||||||
| Convertible notes | |||||||||||
| Total Liabilities | |||||||||||
| Stockholders’ Equity: | |||||||||||
Preferred stock, par value $ | |||||||||||
Common stock, par value $ | |||||||||||
| Additional paid-in capital | |||||||||||
| Accumulated deficit | ( | ( | |||||||||
| Accumulated other comprehensive income (loss) | |||||||||||
| Non-controlling interest | |||||||||||
| Total Stockholders’ Equity | |||||||||||
| Total Liabilities and Stockholders’ Equity | $ | $ | |||||||||
See accompanying notes.
- 1 -
HA SUSTAINABLE INFRASTRUCTURE CAPITAL, INC.
CONDENSED CONSOLIDATED STATEMENTS OF OPERATIONS
(DOLLARS IN THOUSANDS, EXCEPT PER SHARE DATA)
(UNAUDITED)
| For the Three Months Ended March 31, | |||||||||||
| 2026 | 2025 | ||||||||||
| Revenue | |||||||||||
Interest and rental income ($12 million and $19 million from equity method investees, respectively) | $ | $ | |||||||||
| Gain on sale of assets | |||||||||||
Management fees and retained interest income | |||||||||||
Origination fee and other income | |||||||||||
| Total revenue | |||||||||||
| Expenses | |||||||||||
| Interest expense | |||||||||||
Provision (benefit) for loss on receivables and retained interests in securitization trusts | |||||||||||
| Compensation and benefits | |||||||||||
| General and administrative | |||||||||||
| Total expenses | |||||||||||
Income (loss) before equity method investments | ( | ( | |||||||||
| Income (loss) from equity method investments | ( | ||||||||||
| Income (loss) before income taxes | ( | ||||||||||
| Income tax (expense) benefit | ( | ||||||||||
| Net income (loss) | $ | ( | $ | ||||||||
Net income (loss) attributable to non-controlling interest holders | ( | ||||||||||
| Net income (loss) attributable to controlling stockholders | $ | ( | $ | ||||||||
| Basic earnings (loss) per common share | $ | ( | $ | ||||||||
| Diluted earnings (loss) per common share | $ | ( | $ | ||||||||
| Weighted average common shares outstanding—basic | |||||||||||
| Weighted average common shares outstanding—diluted | |||||||||||
See accompanying notes.
- 2 -
HA SUSTAINABLE INFRASTRUCTURE CAPITAL, INC.
CONDENSED CONSOLIDATED STATEMENTS OF COMPREHENSIVE INCOME
(DOLLARS IN THOUSANDS)
(UNAUDITED)
| Three Months Ended March 31, | |||||||||||
| 2026 | 2025 | ||||||||||
| Net income (loss) | $ | ( | $ | ||||||||
Unrealized gain (loss) on available-for-sale securities and retained interests in securitization trusts, net of tax benefit (provision) of $ | ( | ||||||||||
Unrealized gain (loss) on interest rate swaps, net of tax benefit (provision) of $( | ( | ||||||||||
| Comprehensive income (loss) | ( | ||||||||||
Less: Comprehensive income (loss) attributable to non-controlling interest holders | ( | ||||||||||
| Comprehensive income (loss) attributable to controlling stockholders | $ | ( | $ | ||||||||
See accompanying notes.
- 3 -
HA SUSTAINABLE INFRASTRUCTURE CAPITAL, INC.
CONDENSED CONSOLIDATED STATEMENTS OF STOCKHOLDERS’ EQUITY
(AMOUNTS IN THOUSANDS)
(UNAUDITED)
| Common Stock | Additional Paid-in Capital | Accumulated Deficit | Accumulated Other Comprehensive Income (Loss) | Non-controlling interests | Total | ||||||||||||||||||||||||||||||||||||
| Shares | Amount | ||||||||||||||||||||||||||||||||||||||||
Balance at December 31, 2025 | $ | $ | $ | ( | $ | $ | $ | ||||||||||||||||||||||||||||||||||
| Net income (loss) | — | — | — | ( | — | ( | ( | ||||||||||||||||||||||||||||||||||
Unrealized gain (loss) on available-for-sale securities and retained interests in securitization trusts | — | — | — | — | ( | ( | ( | ||||||||||||||||||||||||||||||||||
| Unrealized gain (loss) on interest rate swaps | — | — | — | — | |||||||||||||||||||||||||||||||||||||
| Issued shares of common stock | — | — | — | ||||||||||||||||||||||||||||||||||||||
| Equity-based compensation | — | — | — | — | |||||||||||||||||||||||||||||||||||||
Other | ( | — | — | — | ( | ||||||||||||||||||||||||||||||||||||
| Dividends and distributions | — | — | — | ( | — | ( | ( | ||||||||||||||||||||||||||||||||||
Balance at March 31, 2026 | $ | $ | $ | ( | $ | $ | $ | ||||||||||||||||||||||||||||||||||
Balance at December 31, 2024 | $ | $ | $ | ( | $ | $ | $ | ||||||||||||||||||||||||||||||||||
| Net income (loss) | — | — | — | — | |||||||||||||||||||||||||||||||||||||
Unrealized gain (loss) on available-for-sale debt securities and retained interests in securitization trusts | — | — | — | — | |||||||||||||||||||||||||||||||||||||
| Unrealized gain (loss) on interest rate swaps | — | — | — | — | ( | ( | ( | ||||||||||||||||||||||||||||||||||
| Issued shares of common stock | — | — | — | ||||||||||||||||||||||||||||||||||||||
| Equity-based compensation | — | — | — | — | |||||||||||||||||||||||||||||||||||||
| Issuance (repurchase) of vested equity-based compensation shares | — | ( | — | — | — | ( | |||||||||||||||||||||||||||||||||||
| Other | — | — | — | — | — | ||||||||||||||||||||||||||||||||||||
| Dividends and distributions | — | — | — | ( | — | ( | ( | ||||||||||||||||||||||||||||||||||
Balance at March 31, 2025 | $ | $ | $ | ( | $ | $ | $ | ||||||||||||||||||||||||||||||||||
See accompanying notes.
- 4 -
HA SUSTAINABLE INFRASTRUCTURE CAPITAL, INC.
CONDENSED CONSOLIDATED STATEMENTS OF CASH FLOWS
(DOLLARS IN THOUSANDS)
(UNAUDITED)
| Three Months Ended March 31, | |||||||||||
| 2026 | 2025 | ||||||||||
| Cash flows from operating activities | |||||||||||
| Net income (loss) | $ | ( | $ | ||||||||
| Adjustments to reconcile net income (loss) to net cash provided by operating activities: | |||||||||||
Provision for loss on receivables and retained interests in securitization trusts | |||||||||||
| Depreciation and amortization | |||||||||||
| Amortization of financing costs | |||||||||||
Equity-based expenses | |||||||||||
| Equity method investments | ( | ||||||||||
Non-cash gain on securitization | ( | ( | |||||||||
| Loss on debt extinguishment | |||||||||||
| Changes in receivables held-for-sale | ( | ||||||||||
Changes in accounts payable, accrued expenses, and other | ( | ||||||||||
Change in accrued interest on receivables and debt securities | ( | ( | |||||||||
| Cash received (paid) upon hedge settlement | |||||||||||
| Other | ( | ( | |||||||||
| Net cash provided by (used in) operating activities | ( | ||||||||||
| Cash flows from investing activities | |||||||||||
| Equity method investments | ( | ( | |||||||||
| Equity method investment distributions received | |||||||||||
Purchases of and investments in receivables ($ | ( | ( | |||||||||
Principal collections from receivables ($ | |||||||||||
| Proceeds from sales of receivables | |||||||||||
Purchases of debt securities and retained interests in securitization trusts | ( | ||||||||||
Collateral provided to hedge counterparties | ( | ||||||||||
Collateral received from hedge counterparties | |||||||||||
| Other | |||||||||||
| Net cash provided by (used in) investing activities | ( | ( | |||||||||
| Cash flows from financing activities | |||||||||||
| Proceeds from credit facilities | |||||||||||
| Principal payments on credit facilities | ( | ( | |||||||||
| Principal payments on term loan | ( | ( | |||||||||
Principal payments on non-recourse debt | ( | ( | |||||||||
Proceeds from (repayments of) commercial paper notes | ( | ||||||||||
Proceeds from issuance of senior notes | |||||||||||
Redemption of senior notes | ( | ||||||||||
Proceeds from issuances of junior subordinated notes | |||||||||||
| Net proceeds of common stock issuances | |||||||||||
| Payments of dividends and distributions | ( | ( | |||||||||
Redemption premium and fees paid | ( | ||||||||||
| Payment of financing costs | ( | ( | |||||||||
Collateral provided to hedge counterparties | ( | ( | |||||||||
Collateral received from hedge counterparties | |||||||||||
| Other | ( | ( | |||||||||
| Net cash provided by (used in) financing activities | |||||||||||
| Increase (decrease) in cash, cash equivalents, and restricted cash | ( | ||||||||||
| Cash, cash equivalents, and restricted cash at beginning of period | |||||||||||
| Cash, cash equivalents, and restricted cash at end of period | $ | $ | |||||||||
| Interest paid | $ | $ | |||||||||
| Supplemental disclosure of non-cash activity | |||||||||||
Interests retained from securitization transactions | $ | $ | |||||||||
Removal of deferred financing obligation upon securitization | |||||||||||
See accompanying notes.
- 5 -
HA SUSTAINABLE INFRASTRUCTURE CAPITAL, INC.
NOTES TO CONDENSED CONSOLIDATED FINANCIAL STATEMENTS
(UNAUDITED)
March 31, 2026
1.The Company
HA Sustainable Infrastructure Capital, Inc. (the “Company”), actively partners with clients to deploy real assets that facilitate the energy transition. The Company and its subsidiaries are hereafter referred to as “we,” “us” or “our.”
Our investments take various forms, including equity, joint ventures, land ownership, lending, and other financing transactions. We refer to the income-producing assets that we hold on our balance sheet as our “Portfolio.” Our Portfolio includes equity investments in either preferred or common structures in unconsolidated entities, receivables, and debt securities. We generate recurring income from net investment income from our Portfolio, from income through our residual ownership in securitization and co-investment structures, and from asset management and other services. We also generate income through gain-on-sale securitization transactions and broker/dealer services.
We finance our business through cash on hand, secured and unsecured debt, convertible securities, or equity issuances and may also decide to finance such transactions through the use of off-balance sheet securitization or syndication structures.
Our common stock is listed on the New York Stock Exchange (“NYSE”) under the symbol “HASI.” We intend to continue to operate our business in a manner that will maintain our exemption from registration as an investment company under the Investment Company Act of 1940, as amended (the “1940 Act”). We operate our business through, and along with two of our wholly owned subsidiaries, serve as the general partners of, our operating partnership subsidiary, Hannon Armstrong Sustainable Infrastructure, L.P., (the “Operating Partnership”), which was formed to acquire and directly or indirectly own our assets.
2.Summary of Significant Accounting Policies
Basis of Presentation
The preparation of financial statements in accordance with U.S. generally accepted accounting principles (“GAAP”) requires management to make estimates and assumptions that affect the reported amounts of assets and liabilities and the reported amounts of revenues and expenses during the reporting period. Actual results could differ from these estimates and such differences could be material. These financial statements have been prepared in accordance with the instructions to Form 10-Q and should be read in conjunction with the consolidated financial statements and notes thereto included in our annual report on Form 10-K for the year ended December 31, 2025, as filed with the SEC. In the opinion of management, all adjustments necessary to present fairly our financial position, results of operations and cash flows have been included. Our results of operations for the three-month periods ended March 31, 2026 and 2025, are not necessarily indicative of the results to be expected for the full year or any other future period. Certain information and footnote disclosures normally included in our annual consolidated financial statements have been condensed or omitted. Certain amounts in the prior years have been reclassified to conform to the current year presentation.
The consolidated financial statements include our accounts and controlled subsidiaries, including the Operating Partnership. All material intercompany transactions and balances have been eliminated in consolidation.
Following the guidance for non-controlling interests in Financial Accounting Standards Board Accounting Standards Codification (“ASC”) 810, Consolidation (“ASC 810”), references in this report to our earnings per share and our net income and stockholders’ equity attributable to common stockholders do not include amounts attributable to non-controlling interests.
Consolidation
We account for our investments in entities that are considered voting interest entities or variable interest entities (“VIEs”) under ASC 810 and assess on an ongoing basis whether we should consolidate these entities. We have established various special purpose entities or securitization trusts for the purpose of securitizing certain assets that are not consolidated in our financial statements as described below in Securitization of Assets.
Since we have assessed that we have power over and receive the benefits from those special purpose entities that are formed for the purpose of holding our assets on our balance sheet, we have concluded we are the primary beneficiary of those
- 6 -
entities and should consolidate them under the provisions of ASC 810. We also have certain subsidiaries we deem to be voting interest entities that we control through our ownership of voting interests and accordingly consolidate.
Certain of our equity investments were determined to be interests in VIEs in which we are not the primary beneficiary, as we do not direct the significant activities of these entities, and thus we account for those investments as Equity Method Investments as discussed below. Our maximum exposure to loss through these investments is typically limited to their recorded values. However, we may provide financial commitments to these VIEs or guarantee certain of their obligations. Certain other entities in which we have equity investments have been assessed to be voting interest entities and as we exert significant influence over these entities rather than control them through our ownership of voting interests, we do not consolidate them and instead account for them as equity method investments described below.
Equity Method Investments
We have made equity investments, typically in structures where we have a preferred return position. These investments are typically owned in holding companies (that are generally limited liability companies (“LLCs”) taxed as partnerships) where we partner with either the operator of the project or other institutional investors. We share in the cash flows, income and tax attributes according to a negotiated schedule which typically does not correspond with our ownership percentages. Investors in a preferred return position, if any, typically receive a priority distribution of all or a portion of the project’s cash flows, and in some cases, tax attributes. Once the preferred return, if applicable, is achieved, the partnership “flips” and common equity investors, often the operator of the project, receive a larger portion of the cash flows, with the previously preferred investors retaining an on-going residual interest.
Our equity investments are accounted for under the equity method of accounting, under which the carrying value of these investments is determined based on amounts we invested, adjusted for earnings or losses of the investee allocated to us based on the terms of the LLC agreement, less distributions received. We generally conclude that investments where the LLC agreements contain preferences with regard to cash flows from operations, capital events or liquidation are considered to contain substantive profit sharing arrangements, so we accordingly reflect our share of profits and losses by determining the difference between our claim on the investee’s reported book value at the beginning and the end of the period, which is adjusted for distributions received and contributions made during the period. This claim is calculated as the amount we would receive if the investee were to liquidate all of its assets at the recorded amounts determined in accordance with GAAP and distribute the resulting hypothetical proceeds to creditors and investors in accordance with their respective priorities. This method is referred to as the hypothetical liquidation at book value method (“HLBV”). Our exposure to loss in these investments is limited to the amount of our equity investment, plus receivables from or guarantees made to the same investee, if any.
Any difference between the amount of our investment and the amount of underlying equity in net assets at the time of our investment is generally amortized over the life of the assets and liabilities to which the difference relates. Cash distributions received from each equity method investment are classified as operating activities to the extent of cumulative earnings for each investment in our consolidated statements of cash flows. Our initial investment and additional cash distributions beyond the amounts that are classified as operating activities are classified as investing activities in our consolidated statements of cash flows. We typically recognize earnings one quarter in arrears for these investments to allow for the receipt of financial information. Our proportionate share of any revenue earned from equity method investees is eliminated through the income (loss) from equity method investment line of our income statements. Losses exceeding our basis in investments for which we hold other outstanding instruments are allocated to those instruments.
Receivables
Receivables include project loans and receivables. Unless otherwise noted, we generally have the ability and intent to hold our receivables for the foreseeable future and accordingly we classify them as held for investment. Our ability and intent to hold certain receivables may change from time to time depending on a number of factors including our liquidity needs and economic and capital market conditions. At inception of the arrangement, the carrying value of receivables held for investment represents the present value of the note, lease or other payments, net of any unearned fee income, which is recognized as income over the term of the note or lease using the effective interest method. Receivables that are held for investment are carried at amortized cost, net of any unamortized acquisition premiums or discounts and include origination and acquisition costs, as applicable. Our
- 7 -
initial investment and principal repayments of these receivables are classified as investing activities and the interest collected is classified as operating activities in our consolidated statements of cash flows. Receivables that we intend to sell in the short-term are classified as held-for-sale and are carried at the lower of amortized cost or fair value on our balance sheet, which is assessed on an individual asset basis. The purchases and proceeds from receivables that we have classified as held-for-sale at origination are classified as operating activities in our consolidated statements of cash flows. Interest collected is classified as an operating activity in our consolidated statements of cash flows. Receivables from certain projects are subordinate to preferred investors in a project who are allocated the majority of such project’s cash in the early years of the investment. Accordingly, such receivables may allow the borrower the ability to defer scheduled interest payments in exchange for increasing our receivable balance. We generally accrue this paid-in-kind (“PIK”) interest when collection is expected, and cease accruing PIK interest if there is insufficient value to support the accrual or we expect that any portion of the principal or interest due is not collectible. The change in PIK in any period is included in Change in accrued interest on receivables and debt securities in the operating section of our statements of cash flows. We may enter into real estate transactions which may be characterized as “failed sale-leaseback” transactions as defined under ASC Topic 842, Leases, and thus are accounted for as financing transactions similarly to our receivables as described herein. Receivables are typically eligible for the fair value option, an election which is made on an investment-by-investment basis, and the associated unrealized gain or loss on such receivables is recorded as a component of net income in our statements of operations.
We evaluate our held-for-investment receivables on which we have not declared the fair value option for an allowance as determined under ASC Topic 326 Financial Instruments- Credit Losses (“ASC 326”) and for our internally derived asset performance categories included in Note 6 to our financial statements on at least a quarterly basis and more frequently when economic or other conditions warrant such an evaluation. When a receivable becomes 90 days or more past due, and if we otherwise do not expect the debtor to be able to service all of its debt or other obligations, we will generally consider the receivable delinquent or impaired and place the receivable on non-accrual status and cease recognizing income from that receivable until the borrower has demonstrated the ability and intent to pay contractual amounts due. If a receivable’s status significantly improves regarding the debtor’s ability to service the debt or other obligations, we will remove it from non-accrual status.
We determine our allowance based on the current expectation of credit losses over the contractual life of our receivables as required by ASC 326. We use a variety of methods in developing our allowance, including discounted cash flow analysis and probability-of-default/loss given default (“PD/LGD”) methods. In developing our estimates, we consider our historical experience with our and similar assets in addition to our view of both current conditions and what we expect to occur within a period of time for which we can develop reasonable and supportable forecasts, typically two years . For periods following the reasonable and supportable forecast period, we revert to historical information when developing assumptions used in our estimates. In developing our forecasts, we consider a number of qualitative and quantitative factors in our assessment, which may include a project’s operating results, loan-to-value ratio, any cash reserves held by the project, the ability of expected cash from operations to cover the cash flow requirements currently and into the future, key terms of the transaction, the ability of the borrower to refinance the transaction, other credit support from the sponsor or guarantor and the project’s collateral value. In addition, we consider the overall economic environment, the sectors in which we invest, the effect of local, industry, and broader economic factors, such as unemployment rates and power prices, the impact of any variation in weather and the historical and anticipated trends in interest rates, defaults and loss severities for similar transactions, as applicable. For assets where the obligor is a publicly rated entity, we consider the published historical performance of entities with similar ratings in developing our estimate of an allowance, making adjustments determined by management to be appropriate during the reasonable and supportable forecast period.
- 8 -
Debt securities
Debt securities are loans that meet the criteria of ASC 320, Investments-Debt and Equity Securities. We have designated our debt securities as available-for-sale and carry these securities at fair value on our balance sheet. Unrealized gains and losses, to the extent not considered to be credit related, on available-for-sale debt securities are recorded as a component of accumulated other comprehensive income (“AOCI”) in equity on our balance sheet. When a security is sold, we reclassify the AOCI to earnings based on the specific identification of each security. Our initial investment and principal repayments of these debt securities are classified as investing activities and the interest collected is classified as operating activities in our consolidated statements of cash flows.
We evaluate our debt securities for impairment on at least a quarterly basis, and more frequently when economic or market conditions warrant such an evaluation. Our impairment assessment is a subjective process requiring the use of judgments and assumptions. Accordingly, we regularly evaluate the extent and impact of any credit deterioration associated with the financial and operating performance and value of the underlying project. We consider several qualitative and quantitative factors in our assessment. The primary factor in our assessment is the current fair value of the security, while other factors include changes in the credit rating, performance of the underlying project, key terms of the transaction, the value of any collateral and any support provided by the sponsor or guarantor.
To the extent that we have identified an impairment for a security and do not expect that we will be required to sell the security prior to recovery of the amortized cost basis, we will recognize only the credit component of the unrealized loss in earnings by recording an allowance against the amortized cost of the asset as required by ASC 326. We determine the credit component using the difference between the security’s amortized cost basis and the present value of its expected future cash flows, discounted using the effective interest method or its estimated collateral value. Any remaining unrealized loss due to factors other than credit is recorded in AOCI.
To the extent we hold securities with a fair value less than the amortized cost and we have made the decision to sell the security or it is more likely than not that we will be required to sell the security prior to recovery of its amortized cost basis, we recognize the entire portion of the impairment in earnings.
Premiums or discounts on securities are amortized or accreted into interest income using the effective interest method.
Securitization of Assets
We have established various special purpose entities or securitization trusts for the purpose of securitizing certain financial assets. We determined that the trusts used in securitizations are VIEs, as defined in ASC 810. When we conclude that we are not the primary beneficiary of certain trusts because we do not have power over those trusts’ significant activities, we do not consolidate the trust. We typically serve as primary or master servicer of these trusts; however, as the servicer, we do not have the power to direct the activities that most significantly impact the economic performance of the trusts.
We account for transfers of financial assets to these securitization trusts as sales pursuant to ASC 860, Transfers and Servicing (“ASC 860”), when we have concluded the transferred assets have been isolated from the transferor (i.e., put presumptively beyond the reach of the transferor and its creditors, even in bankruptcy or other receivership) and we have surrendered control over the transferred assets. When we are unable to conclude that we have been sufficiently isolated from the securitized financial assets, we treat such arrangements as secured borrowings, retaining the assets on our balance sheet and recording the amounts due to the trust investor as non-recourse debt. Transfers of non-financial assets are accounted for under ASC 610-20, Gains and Losses from the Derecognition of Non-financial Assets, and those transfers are accounted for as sales when we have concluded that we have transferred control of the non-financial asset.
For transfers treated as sales under ASC 860, we have received true-sale-at-law and non-consolidation legal opinions to support our conclusion regarding the transferred financial assets. When we sell financial assets in securitizations, we generally retain servicing rights, and also retain economic interests in the transferred assets in the form of residual assets, which we refer to as retained interests in securitization trusts.
Gain or loss on the sale of assets is calculated based on the excess of the proceeds received from the securitization (net of any transaction costs) plus any retained interests obtained over the cost basis of the assets sold. For retained interests, we generally estimate fair value based on the present value of future expected cash flows using our best estimates of the key assumptions of anticipated losses, prepayment rates, and current market discount rates commensurate with the risks involved. Cash flows related to our securitizations at origination are classified as operating activities in our consolidated statements of cash flows.
We account for our retained interests in securitization trusts similar to available-for-sale debt securities and carry them at fair value, with changes in fair value recorded in AOCI pursuant to ASC 325-40, Beneficial Interests in Securitized Financial Assets. Income related to these assets is recognized using the effective interest rate method and included in securitization income in our income statements. These assets are evaluated for impairment on a quarterly basis under ASC 326. Such assets
- 9 -
are impaired if their fair value is less than its carrying value. The credit component of impairments, if any, are recognized by recording an allowance against the amortized cost of the asset. For changes in expected cash flows, we will calculate a new yield based on the current amortized cost of the assets and the revised expected cash flows. This yield is used prospectively to recognize our income related to these assets. Retained interests in securitized non-financial assets are accounted for as equity method investments, and subject to those accounting policies described above.
Cash and Cash Equivalents
Cash and cash equivalents include short-term government securities, certificates of deposit and money market funds, all of which had an original maturity of three months or less at the date of purchase. These securities are carried at their purchase price, which approximates fair value.
Restricted Cash
Restricted cash includes cash and cash equivalents set aside with certain lenders primarily to support obligations outstanding as of the balance sheet dates. Restricted cash is reported as part of other assets in our consolidated balance sheets. Refer to Note 3 to our financial statements in this Form 10-Q for disclosure of the balances of restricted cash included in other assets.
Convertible Notes
Derivative Financial Instruments
We use derivative financial instruments, including interest rate swaps and collars, to manage, or hedge, our interest rate risk exposures associated with new debt issuances and anticipated refinancings of existing debt, to manage our exposure to fluctuations in interest rates on floating-rate debt, and to optimize the mix of our fixed and floating-rate debt. Our objective is to reduce the impact of changes in interest rates on our results of operations and cash flows.
The fair values of our interest rate derivatives designated and qualifying as effective cash flow hedges are reflected in our consolidated balance sheets as a component of other assets (if in an unrealized asset position) or accounts payable, accrued expenses and other (if in an unrealized liability position) and in net unrealized gains and losses in AOCI as described below. The cash settlements of our interest rate swaps, if any, are classified as operating activities in our consolidated statements of cash flows.
The interest rate derivatives we use are intended to be designated as cash flow hedges and are considered highly effective in reducing our exposure to the interest rate risk that they are designated to hedge. This effectiveness is required in order to qualify for hedge accounting. Instruments that meet the required hedging criteria are formally designated as hedging instruments at the inception of the derivative contract. Derivatives are recorded at fair value. If a derivative is designated as a cash flow hedge and meets the highly effective threshold, the change in the fair value of the derivative is recorded in AOCI, net of associated deferred income tax effects. Any amounts in AOCI are recognized in earnings along with the income tax effect at the same time as the hedged item, which is when interest expense is recognized. For any derivative instruments not designated as hedging instruments, changes in fair value would be recognized in earnings in the period that the change occurs. We assess, both at the inception of the hedge and on an ongoing basis, whether the derivatives designated as cash flow hedges are highly effective in offsetting the changes in cash flows of the hedged items. We also assess on an ongoing basis whether the forecasted transactions remain probable, and discontinue hedge accounting if we conclude that they do not. We do not hold derivatives for trading purposes.
Any collateral posted or received as credit support against derivative positions are netted against those derivatives in our balance sheets. When our collateral account with any particular counterparty is in a liability position, we include inflows and outflows related to those collateral postings within financing activities in our statements of cash flows. When our collateral account with any particular counterparty is in an asset position, we include inflows and outflows related to those collateral postings within investing activities in our statements of cash flows. The inflows and outflows related to instruments designated
- 10 -
as cash flow hedges are included within our statements of cash flows in the same section as the hedged item, which is typically operating activities for our instruments which hedge interest rate risk exposures.
Interest rate derivative contracts contain a credit risk that counterparties may be unable to fulfill the terms of the agreement. We attempt to minimize that risk by evaluating the creditworthiness of our counterparties, who are limited to major banks and financial institutions, and do not anticipate nonperformance by the counterparties due to their requirement to post collateral.
We account for income taxes under ASC 740, Income Taxes (“ASC 740”) using the asset and liability method. Deferred tax assets and liabilities are recognized for the estimated future tax consequences attributable to the differences between the consolidated financial statement carrying amounts of existing assets and liabilities and their respective tax bases. Deferred tax assets and liabilities are measured using enacted tax rates in effect for the year in which those temporary differences are expected to be recovered or settled. The effect on deferred tax assets and liabilities from a change in tax rates is recognized in earnings in the period when the new rate is enacted. We evaluate any deferred tax assets for valuation allowances based on an assessment of available evidence including sources of taxable income, prior years taxable income, any existing taxable temporary differences and our future investment and business plans that may give rise to taxable income. We treat any tax credits we receive from our equity investments in renewable energy projects as reductions of federal income taxes of the year in which the credit arises.
Equity-Based Compensation
We have adopted equity incentive plans which provide for grants of stock options, stock appreciation rights, restricted stock units, shares of restricted common stock, phantom shares, dividend equivalent rights, long-term incentive-plan units (“LTIP Units”) and other restricted limited partnership units issued by our Operating Partnership and other equity-based awards. From time to time, we may grant equity or equity-based awards as compensation to our independent directors, employees, advisors, consultants and other personnel. Certain awards earned under each plan are based on achieving various performance or market targets, which are generally earned between 0 % and 200 % of the initial target, depending on the extent to which the performance or market target is met. In addition to performance or market targets, income or gain must be allocated by our Operating Partnership to certain LTIP Units issued by our Operating Partnership so that the capital accounts of such units are equalized with the capital accounts of other holders of OP units before parity is reached and LTIP Units can be converted to limited partnership units.
We record compensation expense for grants made in accordance with ASC 718, Compensation-Stock Compensation. We record compensation expense for unvested grants that vest solely based on service conditions on a straight-line basis over the vesting period of the entire award based upon the fair market value of the grant on the date of grant. Fair market value for restricted common stock is based on our share price on the date of grant. For awards where the vesting is contingent upon achievement of certain performance targets, compensation expense is measured based on the fair market value on the grant date and is recorded over the requisite service period (which includes the performance period). Actual performance results at the end of the performance period determines the number of shares that will ultimately be awarded. We have also issued awards where the vesting is contingent upon service being provided for a defined period and certain market conditions being met. The fair value of these awards, as measured at the grant date, is recognized over the requisite service period, even if the market conditions are not met. The grant date fair value of these awards was developed by an independent appraiser using a Monte Carlo simulation. Forfeitures of unvested awards are recognized as they occur.
We have a retirement policy that provides for full vesting at retirement of any time-based awards that were granted prior to the date of retirement and permits the vesting of performance-based awards that were granted prior to the date of retirement according to the original vesting schedule of the award, subject to the achievement of the applicable performance measures and without the requirement for continued employment. Employees are eligible for the retirement policy upon meeting age and
- 11 -
Earnings Per Share
We compute earnings per share of common stock in accordance with ASC 260, Earnings Per Share. Basic earnings per share is calculated by dividing net income attributable to controlling stockholders (after consideration of the earnings allocated to unvested grants, if applicable) by the weighted-average number of shares of common stock outstanding during the period excluding the weighted average number of unvested grants, if applicable (“participating securities” as defined in Note 12 to our financial statements in this Form 10-Q).
Diluted earnings per share is calculated by dividing net income attributable to controlling stockholders (after consideration of the earnings allocated to unvested grants, if applicable) by the weighted-average number of shares of common stock outstanding during the period plus other potential common stock instruments if they are dilutive. Other potentially dilutive common stock instruments include our unvested restricted stock, other equity-based awards, and Convertible Notes. The restricted stock and other equity-based awards are included if they are dilutive using the treasury stock method. The treasury stock method assumes that theoretical proceeds received for future service provided is used to purchase shares of treasury stock at the average market price per share of common stock, which is deducted from the total shares of potential common stock included in the calculation. When unvested grants are dilutive, the earnings allocated to these dilutive unvested grants are not deducted from the net income attributable to controlling stockholders when calculating diluted earnings per share.
Segment Reporting
We manage our business as a single portfolio which we originate from a single pipeline, and accordingly we report all of our activities as one reportable segment. Our single reportable segment generates net investment and equity method investment income through investments in energy transition assets and infrastructure projects, as well as revenue through the gain on sale of assets and recurring asset management fees. The consolidated financial statements presented herein reflect the activities of our single reportable segment, and the accounting policies of our single reportable segment are those found here in this Note 2. Our chief operating decision maker (“CODM”) is our chief executive officer.
The CODM assesses performance for this segment and decides how to allocate resources based in part on net income as recorded in our income statements. Included in this metric are the significant segment expenses reviewed by the CODM, which include interest expense, compensation and benefits, and general and administrative, each of which is reported in our income statements. We do not have material intra-company sales or transfers.
Recently Issued Accounting Pronouncements
Accounting standards updates issued before May 8, 2026, and effective after March 31, 2026, are not expected to have a material effect on our consolidated financial statements and related disclosures.
3.Fair Value Measurements
Fair value is defined as the price that would be received for an asset or paid to transfer a liability in an orderly transaction between market participants on the measurement date. The fair value accounting guidance provides a three-level hierarchy for classifying financial instruments. The levels of inputs used to determine the fair value of our financial assets and liabilities carried on the balance sheet at fair value and for those which only disclosure of fair value is required are characterized in accordance with the fair value hierarchy established by ASC 820, Fair Value Measurements. Where inputs for a financial asset or liability fall in more than one level in the fair value hierarchy, the financial asset or liability is classified in its entirety based on the lowest level input that is significant to the fair value measurement of that financial asset or liability. We use our judgment and consider factors specific to the financial assets and liabilities in determining the significance of an input to the fair value measurements. As of March 31, 2026 and December 31, 2025, our retained interests in securitization trusts, our derivatives, receivables for which we have elected the fair value option, if any, and our debt securities were carried at fair value on the consolidated balance sheets on a recurring basis. The three levels of the fair value hierarchy are described below:
- 12 -
•Level 1 — Quoted prices (unadjusted) in active markets that are accessible at the measurement date.
•Level 2 — Observable prices that are based on inputs not quoted on active markets but corroborated by market data.
•Level 3 — Unobservable inputs are used when little or no market data is available.
The tables below state the estimated fair value of our financial instruments on our balance sheet. Unless otherwise discussed below, fair values for our Level 2 and Level 3 measurements are measured using a discounted cash flow model, the inputs to which consist of base interest rates and spreads over base rates. Spreads are based upon market observation and recent comparable transactions. An increase in these inputs would result in a lower fair value and a decline would result in a higher fair value. Our Senior Notes and Junior Subordinated Notes (each as defined below), and our Convertible Notes are valued using a market-based approach and observable prices. The receivables held-for-sale, if any and excluding those on which we have elected the fair value option, are carried at the lower of cost or fair value, as determined on an individual asset basis.
| As of March 31, 2026 | |||||||||||||||||
| Fair Value | Carrying Value | Level | |||||||||||||||
| (in millions) | |||||||||||||||||
| Assets | |||||||||||||||||
Receivables | $ | $ | Level 3 | ||||||||||||||
Receivables held-for-sale | Level 3 | ||||||||||||||||
Debt securities (1) | Level 3 | ||||||||||||||||
Retained interests in securitization trusts (2) | Level 3 | ||||||||||||||||
| Derivative assets | Level 2 | ||||||||||||||||
Liabilities (3) | |||||||||||||||||
Credit facility | $ | $ | Level 3 | ||||||||||||||
| Commercial paper notes | Level 3 | ||||||||||||||||
| Term loans payable | Level 3 | ||||||||||||||||
| Non-recourse debt | Level 3 | ||||||||||||||||
Senior notes | Level 2 | ||||||||||||||||
| Junior subordinated notes | Level 2 | ||||||||||||||||
Convertible Notes | Level 2 | ||||||||||||||||
| Derivative liabilities | Level 2 | ||||||||||||||||
(1)The amortized cost of our debt securities as of March 31, 2026, was $55 million.
(2)The amortized cost of our retained interests in securitization trusts net of allowance for credit losses as of March 31, 2026 was $376 million.
(3)Fair value and carrying value exclude unamortized financing costs.
- 13 -
| As of December 31, 2025 | |||||||||||||||||
| Fair Value | Carrying Value | Level | |||||||||||||||
| (in millions) | |||||||||||||||||
| Assets | |||||||||||||||||
Receivables | $ | $ | Level 3 | ||||||||||||||
| Receivables held-for-sale | Level 3 | ||||||||||||||||
Debt securities (1) | Level 3 | ||||||||||||||||
Retained interests in securitization trusts (2) | Level 3 | ||||||||||||||||
| Derivative assets | Level 2 | ||||||||||||||||
Liabilities (3) | |||||||||||||||||
Credit facility | $ | $ | Level 3 | ||||||||||||||
| Commercial paper notes | Level 3 | ||||||||||||||||
Term loans payable | Level 3 | ||||||||||||||||
| Non-recourse debt | Level 3 | ||||||||||||||||
Junior subordinated notes | Level 2 | ||||||||||||||||
Senior notes | Level 2 | ||||||||||||||||
Convertible Notes | Level 2 | ||||||||||||||||
| Derivative liabilities | Level 2 | ||||||||||||||||
(1) The amortized cost of our debt securities as of December 31, 2025, was $43 million.
(2) The amortized cost of our retained interests in securitization trusts net of allowance for credit losses as of December 31, 2025, was $348 million.
(3) Fair value and carrying value exclude unamortized financing costs.
Debt Securities
The following table reconciles the beginning and ending balances for our Level 3 debt securities that are carried at fair value on a recurring basis:
| For the three months ended March 31, | |||||||||||
| 2026 | 2025 | ||||||||||
| (in millions) | |||||||||||
| Balance, beginning of period | $ | $ | |||||||||
Equity method investee losses applied (1) | |||||||||||
Unrealized gains (losses) on debt securities recorded in OCI | ( | ||||||||||
| Balance, end of period | $ | $ | |||||||||
(1) As described in Note 2, losses in excess of basis from equity method investments from which we have other outstanding instruments are allocated against those other instruments. In the three months ended March 31, 2026, we were allocated income from these investments from which we had previously applied losses to related debt securities, so previously applied losses were reversed.
We had the following debt securities in an unrealized loss position:
| Estimated Fair Value | Unrealized Losses (1) | Count of Assets | |||||||||||||||||||||||||||||||||
| Assets with a loss shorter than 12 months | Assets with a loss longer than 12 months | Assets with a loss shorter than 12 months | Assets with a loss longer than 12 months | Assets with a loss shorter than 12 months | Assets with a loss longer than 12 months | ||||||||||||||||||||||||||||||
| (in millions) | |||||||||||||||||||||||||||||||||||
| March 31, 2026 | $ | $ | $ | $ | |||||||||||||||||||||||||||||||
| December 31, 2025 | |||||||||||||||||||||||||||||||||||
(1) Loss positions are due to interest rates movements and are not indicative of credit deterioration. We have the intent and ability to hold these assets until a recovery of fair value.
In determining the fair value of our debt securities, we used a market-based risk-free rate and added a range of interest rate spreads based upon transactions involving similar assets of approximately 3 6 9.8 % and 9.7 %, respectively.
- 14 -
Retained interests in securitization trusts
The following table reconciles the beginning and ending balances for our Level 3 retained interest in securitization trust assets that are carried at fair value on a recurring basis, with changes in fair value recorded through AOCI:
| For the three months ended March 31, | |||||||||||
| 2026 | 2025 | ||||||||||
| (in millions) | |||||||||||
| Balance, beginning of period | $ | $ | |||||||||
Accretion of retained interests in securitization trusts | |||||||||||
Additions to retained interests in securitization trusts | |||||||||||
Collections from retained interests in securitization trusts | ( | ( | |||||||||
Unrealized gains (losses) on retained interests in securitization trusts recorded in OCI | ( | ||||||||||
| Balance, end of period | $ | $ | |||||||||
We had the following retained interests in securitization trusts in an unrealized loss position:
| Estimated Fair Value | Unrealized Losses (1) | Count of Assets | |||||||||||||||||||||||||||||||||
| Assets with a loss shorter than 12 months | Assets with a loss longer than 12 months | Assets with a loss shorter than 12 months | Assets with a loss longer than 12 months | Assets with a loss shorter than 12 months | Assets with a loss longer than 12 months | ||||||||||||||||||||||||||||||
| (in millions) | |||||||||||||||||||||||||||||||||||
| March 31, 2026 | $ | $ | $ | $ | |||||||||||||||||||||||||||||||
| December 31, 2025 | |||||||||||||||||||||||||||||||||||
(1) Other than the assets for which there is a reserve as discussed in Note 5, loss positions are due to interest rates movements and are not indicative of credit deterioration. We have the intent and ability to hold these assets until a recovery of fair value.
In determining the fair value of our retained interests in securitization trusts, we used a market-based risk-free rate and added a range of interest rate spreads based upon transactions involving similar assets of approximately 1 5 7.1 % and 7.0 %, respectively.
Non-recurring Fair Value Measurements
Our financial statements may include non-recurring fair value measurements related to acquisitions and non-monetary transactions. Assets acquired in a business combination, if any, are recorded at their fair value. We may use third-party valuation firms to assist us with developing our estimates of fair value.
Concentration of Credit Risk
Our receivables and debt securities are backed by various projects, the U.S. federal government, and investment grade state and local governments and do not, in our view, represent a significant concentration of credit risk given the large number of diverse offtakers and other obligors of the projects. Additionally, certain of our investments are collateralized by projects concentrated in certain geographic regions throughout the United States. These investments typically have structural credit protections to mitigate our risk exposure and, in most cases, the projects are insured for estimated physical loss, which helps to mitigate the possible risk from these concentrations.
We had cash deposits that are subject to credit risk as shown below:
| March 31, 2026 | December 31, 2025 | ||||||||||
| (in millions) | |||||||||||
| Cash deposits | $ | $ | |||||||||
| Restricted cash deposits (included in other assets) | |||||||||||
| Total cash deposits | $ | $ | |||||||||
| Amount of cash deposits in excess of amounts federally insured | $ | $ | |||||||||
- 15 -
4.Non-Controlling Interest
Units of limited partnership interests in the Operating Partnership (“OP units”) that are owned by limited partners other than us are included in non-controlling interest on our consolidated balance sheets. The non-controlling interest holders are generally allocated their pro rata share of income, other comprehensive income and equity transactions.
The outstanding OP units not held by us represent approximately 1 % of our outstanding OP units and are redeemable by the limited partners for cash, or at our option, for a like number of shares of our common stock. No
5.Securitization of Financial Assets
The following summarizes certain transactions with securitization trusts:
| For the Three Months Ended March 31, | |||||||||||
| 2026 | 2025 | ||||||||||
| (in millions) | |||||||||||
| Gains on securitizations | $ | $ | |||||||||
| Cost of financial assets securitized | |||||||||||
| Proceeds from securitizations | |||||||||||
| Cash received from retained interests in securitization trusts and servicing fees | |||||||||||
In connection with securitization transactions, we typically retain servicing responsibilities and residual interests in the securitization trusts. We generally receive annual servicing fees that are typically up to 0.25 % of the outstanding balance. We may periodically make servicer advances that are subject to credit risk. Assets related to our retained interests in securitization trusts are held on our balance sheet at fair value. Our retained interests are subordinate to investors’ interests, and their values are subject to credit, prepayment and interest rate risks on the transferred financial assets. Other than our retained interests in the trusts’ assets, the investors and the securitization trusts have no recourse to our other assets for failure of debtors to pay when due. In computing gains and losses on securitizations, we use discount rates which consist of base interest rates and spreads over these base rates. Spreads are based on a review of comparable recent transactions and we consider them to be Level 3 unobservable inputs. Depending on the nature of the transaction risks, the all-in discount rate ranged from 5.3 % to 8.6 % for the three months ended March 31, 2026.
As of March 31, 2026 and December 31, 2025, the balance of securitized assets held in unconsolidated securitization trusts was $7.3 billion and $7.2 billion, respectively. As of March 31, 2026 and December 31, 2025, the securitization trusts held $6.7 billion and $6.6 billion, respectively, of notes due to investors.
- 16 -
As of March 31, 2026, there were no material payments from debtors to the securitization trusts that were greater than 90 days past due.
We have a $3 million allowance for losses on our retained interests in securitization trusts related to assets secured by property assessed clean energy liens. This allowance is a result of changes in our estimates of cash flows due to prepayments on certain of these assets. There has been no change in the underlying credit quality of the securitized assets since origination.
Of our retained interests in securitization trusts, 60 % are related to contracts where the underlying cash flows are secured by an interest in real estate which are typically senior in terms of repayment to other financings. Receivables from contracts for the installation of energy efficiency and other technologies are the source of cash flows of 40 % of our securitization residual assets. These technologies are typically installed in facilities owned by, or operated for or by, federal, state or local government entities where the ultimate obligor for the receivable is a governmental entity. The contracts may have guarantees of energy savings from third-party service providers, which typically are entities rated investment grade by an independent rating agency.
6.Our Portfolio
As of March 31, 2026, our Portfolio included approximately $7.6 billion of equity method investments, receivables, real estate and debt securities on our balance sheet. The equity method investments represent our non-controlling equity investments in energy transition projects. The receivables and debt securities are typically collateralized by contractually committed debt obligations of government entities or private high credit quality obligors and are often supported by additional forms of credit enhancement, including security interests and supplier guaranties. The real estate is typically land and related lease intangibles for long-term leases to wind and solar projects.
In developing and evaluating performance against our credit criteria, we consider a number of qualitative and quantitative criteria which may include a project’s operating results, loan-to-value ratio, any cash reserves, the ability of expected cash from operations to cover the cash flow requirements currently and into the future, key terms of the transaction, the ability of the borrower to refinance the transaction, the financial and operating capability of the borrower, its sponsors or the obligor as well as any guarantors and the project’s collateral value. In addition, we consider the overall economic environment, the sectors in which we invest, the effect of local, industry and broader economic factors, the impact of any variation in weather and the historical and anticipated trends in interest rates, defaults and loss severities for similar transactions.
The following is an analysis of the Performance Ratings of our Portfolio as of March 31, 2026, which is assessed quarterly:
| Portfolio Performance | |||||||||||||||||||||||||||||
1 (1) | 2 (2) | 3 (3) | Total | ||||||||||||||||||||||||||
| Commercial | Government | Commercial | Commercial | ||||||||||||||||||||||||||
Receivable vintage (4) | (dollars in millions) | ||||||||||||||||||||||||||||
| 2026 | $ | $ | $ | $ | $ | ||||||||||||||||||||||||
| 2025 | |||||||||||||||||||||||||||||
| 2024 | |||||||||||||||||||||||||||||
| 2023 | |||||||||||||||||||||||||||||
| 2022 | |||||||||||||||||||||||||||||
| 2021 | |||||||||||||||||||||||||||||
Prior to 2021 | |||||||||||||||||||||||||||||
| Total receivables held-for-investment | |||||||||||||||||||||||||||||
Less: Allowance for loss on receivables | ( | ( | ( | ||||||||||||||||||||||||||
Net receivables held-for-investment | |||||||||||||||||||||||||||||
| Receivables held-for-sale | |||||||||||||||||||||||||||||
Debt securities and real estate | |||||||||||||||||||||||||||||
Equity method investments (5) | |||||||||||||||||||||||||||||
Total | $ | $ | $ | $ | $ | ||||||||||||||||||||||||
| Percent of Portfolio | % | % | % | % | % | ||||||||||||||||||||||||
(1)This category includes our assets where based on our credit criteria and performance to date we believe that our risk of not receiving our invested capital remains low.
- 17 -
(2)This category includes our assets where based on our credit criteria and performance to date we believe there is a moderate level of risk to not receiving some or all of our invested capital. In the first quarter of 2026, we moved into this category from Category 1 two receivables to the same borrower where the underlying assets are experiencing project-specific technical challenges which are currently in the process of being remediated.
(3)This category includes our assets where based on our credit criteria and performance to date, we believe there is substantial doubt regarding our ability to recover some or all of our invested capital. Receivables or debt securities in this category are placed on non-accrual status.
(4)Receivable vintage refers to the period in which the relevant agreement is signed, and a given vintage may contain advances made in periods subsequent to the period in which the agreement was signed.
(5)Some of the individual projects included in portfolios that make up our equity method investments have government offtakers. As they are part of large portfolios, they are not classified separately.
The following is an analysis of the Performance Ratings of our Portfolio as of December 31, 2025, which is assessed quarterly:
| Portfolio Performance | |||||||||||||||||||||||||||||
1 (1) | 2 (2) | 3 (3) | Total | ||||||||||||||||||||||||||
| Commercial | Government | Commercial | Commercial | ||||||||||||||||||||||||||
Receivable vintage (4) | (dollars in millions) | ||||||||||||||||||||||||||||
| 2025 | $ | $ | $ | $ | $ | ||||||||||||||||||||||||
| 2024 | |||||||||||||||||||||||||||||
| 2023 | |||||||||||||||||||||||||||||
| 2022 | |||||||||||||||||||||||||||||
| 2021 | |||||||||||||||||||||||||||||
Prior to 2021 | |||||||||||||||||||||||||||||
| Total receivables held-for-investment | |||||||||||||||||||||||||||||
Less: Allowance for loss on receivables | ( | ( | ( | ||||||||||||||||||||||||||
Net receivables held-for-investment | |||||||||||||||||||||||||||||
| Receivables held-for-sale | |||||||||||||||||||||||||||||
Debt securities and real estate | |||||||||||||||||||||||||||||
Equity method investments (5) | |||||||||||||||||||||||||||||
Total | $ | $ | $ | $ | $ | ||||||||||||||||||||||||
| Percent of Portfolio | % | % | % | % | % | ||||||||||||||||||||||||
(1)This category includes our assets where based on our credit criteria and performance to date we believe that our risk of not receiving our invested capital remains low.
(2)This category includes our assets where based on our credit criteria and performance to date we believe there is a moderate level of risk to not receiving some or all of our invested capital. In 2025, we moved into this category a receivable previously included in Category 1 where the underlying assets are experiencing project-specific technical challenges which are currently in the process of being remediated.
(3)This category includes our assets where based on our credit criteria and performance to date, we believe there is substantial doubt regarding our ability to recover some or all of our invested capital. Receivables or debt securities in this category are placed on non-accrual status.
(4)Receivable vintage refers to the period in which the relevant agreement is signed, and a given vintage may contain advances made in periods subsequent to the period in which the agreement was signed.
Receivables
As of March 31, 2026, our allowance for losses on receivables was $67 million based on our expectation of credit losses over the lives of the receivables in our portfolio. During the three months ended March 31, 2026, we increased our reserve by approximately $5 million, driven primarily by an asset-specific reserve made during the period on the receivable moved into Category 2 discussed above.
- 18 -
Below is a summary of the carrying value of our receivables held-for-investment, loan funding commitments, and allowance by type of receivable or “Portfolio Segment”, as defined by ASC 326, as of March 31, 2026 and December 31, 2025:
| March 31, 2026 | December 31, 2025 | ||||||||||||||||||||||||||||||||||
| Gross Carrying Value | Loan Funding Commitments | Allowance | Gross Carrying Value | Loan Funding Commitments | Allowance | ||||||||||||||||||||||||||||||
| (in millions) | |||||||||||||||||||||||||||||||||||
Commercial (1) | |||||||||||||||||||||||||||||||||||
Government (2) | $ | $ | $ | $ | $ | $ | |||||||||||||||||||||||||||||
| Total | $ | $ | $ | $ | $ | $ | |||||||||||||||||||||||||||||
(1)As of March 31, 2026, this category of assets includes $1.6 billion of mezzanine loans made on a non-recourse basis to bankruptcy-remote special purpose subsidiaries of residential solar companies which hold residential solar assets where we rely on certain limited indemnities, warranties, and other obligations of the residential solar companies or their other subsidiaries. These residential solar assets typically contain back-up servicer provisions to allow for continuity of operations in the event the project sponsor is unable to fulfill its duties in that capacity.
Risk characteristics of our commercial receivables include a project’s operating risks, which include the impact of the overall economic environment, the sectors in which we invest, the effect of local, industry, and broader economic factors, the impact of any variation in weather and trends in interest rates. We use assumptions related to these risks to estimate an allowance using a discounted cash flow analysis or the PD/LGD method as discussed in Note 2 to our financial statements in this Form 10-Q. For those assets in Performance Rating 1, the credit worthiness of the obligor combined with the various structural protections of our assets cause us to believe we have a low risk we will not receive our invested capital, however we recorded a $54 million allowance on these $3.1 billion in assets as a result of lower probability assumptions utilized in our allowance methodology.
(2)As of March 31, 2026, our government receivables include $4 million of U.S. federal government transactions and $26 million of transactions where the ultimate obligors are state or local governments.
Risk characteristics of our government receivables include the energy savings or the power output of the projects and the ability of the government obligor to generate revenue for debt service, via taxation or other means. Transactions may have guarantees of energy savings or other performance support from third-party service providers, which typically are entities that are rated or whose parent is rated investment grade by an independent rating agency. All of our government receivables are included in Performance Rating 1 in the Portfolio Performance table above. Our allowance for government receivables is primarily calculated by using PD/LGD methods as discussed in Note 2 to our financial statements in this Form 10-Q. Our expectation of credit losses for these receivables is immaterial given the high credit-quality of the obligors.
The following table reconciles our beginning and ending allowance for loss on receivables by Portfolio Segment:
| Three months ended March 31, 2026 | Three months ended March 31, 2025 | ||||||||||||||||||||||
| Government | Commercial | Government | Commercial | ||||||||||||||||||||
| (in millions) | |||||||||||||||||||||||
| Beginning balance | $ | $ | $ | $ | |||||||||||||||||||
| Provision for loss on receivables | |||||||||||||||||||||||
| Ending balance | $ | $ | $ | $ | |||||||||||||||||||
We have no receivables on non-accrual status.
The following table provides a summary of the maturity dates of our receivables and the weighted average yield for each range of maturities as of March 31, 2026:
| Total | Less than 1 year | 1-5 years | 5-10 years | More than 10 years | |||||||||||||||||||||||||
| (dollars in millions) | |||||||||||||||||||||||||||||
| Maturities by period (excluding allowance) | $ | $ | $ | $ | $ | ||||||||||||||||||||||||
| Weighted average yield by period | % | % | % | % | % | ||||||||||||||||||||||||
- 19 -
Debt Securities
The following table provides a summary of the maturity dates of our debt securities and the weighted average yield for each range of maturities as of March 31, 2026:
| Total | Less than 1 year | 1-5 years | 5-10 years | More than 10 years | |||||||||||||||||||||||||
| (dollars in millions) | |||||||||||||||||||||||||||||
| Maturities by period (excluding allowance) | $ | $ | $ | $ | $ | ||||||||||||||||||||||||
| Weighted average yield by period | % | % | % | % | % | ||||||||||||||||||||||||
We had no debt securities that were impaired or on non-accrual status as of March 31, 2026 or December 31, 2025, and no allowances associated with our debt securities.
Equity Method Investments
We have made non-controlling equity investments in a number of projects that we account for as equity method investments.
As of March 31, 2026, we held the following equity method investments:
| Investee | Carrying Value | |||||||
| (in millions) | ||||||||
| CarbonCount Holdings 1 LLC | $ | |||||||
| Jupiter Equity Holdings LLC | ||||||||
| Daggett Renewable HoldCo LLC | ||||||||
| Other equity method investments | ||||||||
| Total equity method investments | $ | |||||||
Jupiter Equity Holdings LLC
We have a structured equity interest in Jupiter Equity Holdings LLC (“Jupiter”) that owns eight operating onshore wind projects and four operating utility-scale solar projects with an aggregate capacity of approximately 2.0 gigawatts. Through March 31, 2026, we have made capital contributions to Jupiter of approximately $562 million related to these projects reflecting final funding true-ups after all projects reached substantial completion. Alongside the project sponsor and under terms outlined in the partnership agreement, we have $77 million in loans outstanding to Jupiter to allow for the restructuring of certain power purchase agreements and tax equity arrangements, which we expect to increase both near-term cash flows and expected lifetime return. Those loans are included in our Related Party Transactions disclosures below. The projects typically feature cash flows from fixed-price power purchase agreements and financial hedges contracted with highly creditworthy off-takers and counterparties.
Jupiter is governed by an amended and restated limited liability company agreement, dated July 1, 2020, by and among the members, one of our subsidiaries and a subsidiary of the project sponsor, which contains customary terms and conditions. We own 100 % of the Class A Units in Jupiter corresponding to 49 % of the distributions from Jupiter subject to the preferences discussed below. Most major decisions that may impact Jupiter, its subsidiaries or its assets, require the majority vote of a four person committee on which we and the project sponsor each have two 33 % to us and approximately 67 % to the sponsor. We and the sponsor each have a right of first offer if the other party desires to transfer any of its equity ownership to a third party. We use the equity method of accounting to account for our preferred equity interest in Jupiter, and have elected to recognize earnings from this investment one quarter in arrears to allow for the receipt of financial information.
Daggett Renewable HoldCo LLC
We have a structured equity investment in Daggett Renewable HoldCo LLC (“Daggett”) which owns two utility-scale solar projects developed and managed by the project sponsor. We have made investments in the preferred cash equity interests of Daggett of approximately $232 million through March 31, 2026, reflecting final funding true-ups after all projects reached substantial completion. The Daggett projects feature contracted cash flows with a diversified group of predominately investment grade utility off-takers.
- 20 -
Daggett is governed by a limited liability company agreement between us and the sponsor serving as managing member and contain customary terms and conditions. Most major decisions that may impact Daggett, its subsidiaries or its assets, require a unanimous vote of the representatives present at a meeting of a review committee in which a quorum is present. The review committee is a four -person committee, which includes two of our representatives and two sponsor representatives. Commencing on a certain date following the effective date of the applicable limited liability company agreement, we will be entitled to preferred distributions until certain return targets of each investment are achieved. Subject to customary exceptions, no member can transfer any of its equity ownership in Daggett to a third party without approval of the review committee of Daggett. We use the equity method of accounting to account for our preferred equity interest in Daggett, and have elected to recognize earnings from this investment one quarter in arrears to allow for the receipt of financial information.
Related party transactions
CarbonCount Holdings 1 LLC
We, through our indirect subsidiary, HASI CarbonCount Holdings 1, LLC (“HASI CarbonCount”) and Hoops Midco, LLC (“KKR Hoops”), an investment vehicle managed by an affiliate of Kohlberg Kravis Roberts & Co. L.P. (“KKR”), entered into agreements to acquire interests in CarbonCount Holdings 1 LLC (“CCH1”), established to invest in certain eligible climate-positive projects across the United States, as further described below.
HASI CarbonCount and KKR Hoops have each committed $1.5 billion to CCH1 to be invested in eligible assets through an investment period ending the earlier of December 2027 or when all the commitments have been utilized. In addition, HASI, through its indirect subsidiaries, HASI Securities, LLC (the “Broker-Dealer”) and CarbonCount Holdings Manager LLC (the “Asset Manager”, and, together with the Broker-Dealer, the “Service Providers”), is engaged by CCH1 pursuant to a services agreement (the “Services Agreement”) to provide certain services to CCH1.
CCH1 is governed by a board of directors (the “CCH1 Board”) currently composed of four directors, two of whom are appointed by us and two of whom are appointed by KKR Hoops. Actions of the CCH1 Board generally require the affirmative vote of at least three out of four directors. Pursuant to the Services Agreement, the CCH1 Board has delegated to the Service Providers certain rights and powers to manage the day-to-day business and affairs of CCH1, while retaining control over the significant decision making of CCH1. We account for our investment in CCH1 as an equity method investment.
The Broker-Dealer sources investment opportunities for CCH1 pursuant to the terms of the Services Agreement. Through the Broker-Dealer, HASI is obligated to present all of the investment opportunities it identifies that fit within certain predetermined criteria to the CCH1 Board until either joint venture party’s commitment has been fully invested or upon the date that the investment period described above expires or is earlier terminated. The investment criteria under the Services Agreement includes investment opportunities that we would typically have originated on our balance sheet.
CCH1 pays the Broker-Dealer, for provision of the services provided, an upfront fee on each funding of investments generally equal to 1 % of the total cash consideration funded by CCH1 to the applicable investment counterparty. CCH1 also pays the Asset Manager, for provision of the services provided by it, ongoing fees in respect of asset management and administering the management and operation of CCH1, payable when deducted from CCH1’s cash available for distribution. The fee payable to the Asset Manager is calculated on the basis of certain performance thresholds and will generally not be less than 0.5 % of invested capital per annum, subject to certain limited exceptions, nor more than 1.00 %.
To date, both we and KKR have each funded $792 1.5 2.3 billion book value in Portfolio assets, of which 72 % are equity method investments and of which 28 % are receivables and debt securities. CCH1 has a principal amount of outstanding debt of $684 million as of March 31, 2026. Debt proceeds are used to make investments incremental to the $1.5 63 million of KKR’s equity contribution on their behalf. We were reimbursed this amount by KKR in January 2026, and it is as a cash inflow in Other within the Investing Activities within our statement of cash flows.
While we do not recognize our income from CCH1 in arrears, CCH1 typically recognizes income from its equity method investees one quarter in arrears to allow for its receipt of financial information. The table below provides additional detail on our fees paid by CCH1 to the Broker-Dealer. Amounts below reflect the full fee paid by CCH1 to the broker-dealer. Since HASI owns 50 % of CCH1, we eliminate 50 % of such fee income through our equity method investment income of CCH1.
- 21 -
| Three Months Ended March 31, 2026 | Three Months Ended March 31, 2025 | ||||||||||
| (in millions) | |||||||||||
Up-front origination fees | $ | $ | |||||||||
Ongoing asset management fees | |||||||||||
Total | $ | $ | |||||||||
Other Related Party Transactions
Of our receivables, approximately $550 million are loans made to entities in which we also have non-controlling equity investments of approximately $1.0 billion. Typically, these equity method investments are LLCs taxed as partnerships that we have entered into with various renewable energy project sponsors. We negotiate the commercial terms of these loans with the other partner, and the assets against which the project sponsors are borrowing are contributed into the LLCs. Our equity investments allow us to participate in the residual economics of those contributed assets alongside the other partner, and our rights under the project operating agreements do not allow us to make any significant unilateral decisions regarding the terms of the arrangement. These assets are bankruptcy remote from the project sponsor, and residential solar assets typically contain back-up servicer provisions to allow for continuity of operations in the event the project sponsor is unable to fulfill its duties in that capacity. We are not obligated to contribute capital to support these entities beyond agreements to make contributions to allow for the entities to purchase additional energy transition assets. Because the loans made to these entities are typically subordinate to senior debt and tax equity investors in the projects, these loans, which typically have maturities of over ten years , may accrue PIK interest in the early years of the project until sufficient cash flow is available for our interest payments. Any change in PIK interest is included in Change in accrued interest on receivables and debt securities in the Operating section of our statements of cash flows. On a quarterly basis, we assess these loans for any impairment inclusive of any PIK interest accrued under CECL as discussed above under Receivables.
The following table provides additional detail on our transactions with related party equity method investees:
| Three Months Ended March 31, 2026 | Three Months Ended March 31, 2025 | ||||||||||
| (in millions) | |||||||||||
| Interest income from related party loans | $ | $ | |||||||||
Additional investments made in related party loans | |||||||||||
| Principal collected from related party loans | |||||||||||
| Interest collected from related party loans | |||||||||||
7.Credit facility and commercial paper notes
Unsecured revolving credit facility
We have an unsecured revolving credit facility pursuant to a revolving credit agreement with a syndicate of lenders with a maximum outstanding borrowing amount of $1.825 billion. The facility matures in April 2028. As of March 31, 2026, there were no borrowings outstanding. We have accrued availability fees of $1 million outstanding under the facility and approximately $7 million of remaining unamortized financing costs associated with the unsecured revolving credit facility have been capitalized and included in other assets on our balance sheet and are being amortized on a straight-line basis over the term of the unsecured revolving credit facility.
The unsecured revolving credit facility has a commitment fee based on our current credit rating and bears interest at a rate of SOFR or prime rate plus applicable margins based on our current credit rating, which may also be adjusted up to 0.10 % to the extent our Portfolio achieves certain targeted levels of carbon emissions avoidance, as measured by our CarbonCount© metric. The current applicable margins are 1.625 % for SOFR-based loans and 0.625 % for prime rate-based loans, plus an additional 0.10 %, before applying any adjustments for achieved levels of carbon emissions avoidance. The unsecured revolving credit facility contains terms, conditions, covenants, and representations and warranties that are customary and typical for transactions of this nature, including various affirmative and negative covenants, and limitations on the incurrence of liens and indebtedness, investments, fundamental organizational changes, dispositions, changes in the nature of business, transactions with affiliates, stock repurchases, and dividends we can declare. The unsecured revolving credit facility also includes customary events of default and remedies. At our option, upon maturity of the unsecured revolving credit facility, we have the ability to convert amounts borrowed into term loans for a fee equal to 1.875 % of the term loan amounts.
- 22 -
Credit-Enhanced Commercial Paper Note Program
We have a Green CarbonCount Commercial Paper Note Program (the “commercial paper program”) that allows us to issue commercial paper notes at any time, with such notes supported by an irrevocable direct-pay letter of credit from Bank of America, N.A. (“Credit-Enhanced Commercial Paper Notes”). The capacity of the program allows for up to $125 million outstanding at any time, and the program was extended in the first quarter of 2026 to mature in October 2027.
Bank of America provides a direct-pay letter of credit to the noteholders in the same amount of each Credit-Enhanced Commercial Paper Note. The letter of credit is automatically drawn upon at maturity of a Credit-Enhanced Commercial Paper Note and the noteholders are repaid in full. We have a business-day grace period during which we repay Bank of America for the amount drawn or issue a new Credit-Enhanced Commercial Paper Note. Following the business-day grace period, any amount then-outstanding is converted into a loan from Bank of America. Credit-Enhanced Commercial Paper Notes are not redeemable or subject to voluntary prepayment and cannot exceed 397 days. An amount equal to the proceeds of our Credit-Enhanced Commercial Paper Notes are allocated to either the acquisition or refinance of, in whole or in part, eligible green projects, including assets that are neutral to negative on incremental carbon emissions. As of March 31, 2026, we have no Credit-Enhanced Commercial Paper Notes outstanding under the facility.
Credit-Enhanced Commercial Paper Notes will be issued at a discount based on market pricing, subject to broker fees of 0.10 %. For issuance of the letter of credit, we will pay 1.325 % on any drawn letter of credit amounts to Bank of America, N.A., and 0.35 % on any unused letter of credit capacity. Any loans converted from drawn letter of credit amounts bear interest at a rate of Term SOFR plus 1.875 %, plus an additional 0.10 %. Fees paid on the drawn letters of credit may be adjusted by up to 0.10 % to the extent our Portfolio achieves certain targeted levels of carbon emissions avoidance as measured by our CarbonCount metric. As of March 31, 2026, we have no remaining unamortized financing costs associated with the program and associated letter of credit. The associated letter of credit contains terms, conditions, covenants, and representations and warranties that are customary and typical for a transaction of this nature, including various affirmative and negative covenants, and limitations on the incurrence of liens and indebtedness, investments, fundamental organizational changes, dispositions, changes in the nature of business, transactions with affiliates, use of proceeds, stock repurchases and dividends we declare. The letter of credit also includes customary events of default and remedies.
Standalone Commercial Paper Program
We issue unsecured short-term promissory notes pursuant to a CarbonCount Green Commercial Paper Program which are guaranteed by certain of our subsidiaries (“Standalone Commercial Paper Notes”). Standalone Commercial Paper Notes are issued at a discount based on market pricing, subject to broker fees of 0.05 %. Standalone Commercial Paper Notes are not redeemable, are not subject to voluntary prepayment, and are not to exceed 397 days. Our board of directors has approved the issuance of up to $1 billion principal amount of Standalone Commercial Paper Notes at any given time. As a credit enhancement for our Standalone Commercial Paper Notes, we reserve capacity under our unsecured revolving credit facility for the principal amount of any outstanding Standalone Commercial Paper Notes. The proceeds from our Standalone Commercial Paper Notes are used to acquire or refinance, in whole or in part, eligible green projects, including assets that are neutral to negative on incremental carbon emissions.
As of March 31, 2026, we had no Standalone Commercial Paper Notes outstanding.
8.Long-term Debt
Senior Notes
We have outstanding senior unsecured notes issued by us or jointly by certain of our subsidiaries which are guaranteed by the Company and certain other subsidiaries (the “Senior Notes”). We are in compliance with all covenants as of March 31, 2026 and December 31, 2025. The Senior Notes impose certain requirements in the event that we merge with or sell substantially all of our assets to another entity. We allocate an amount equal to the net proceeds of our Senior Notes to the acquisition or refinance of, in whole or in part, eligible green projects, including assets that are neutral to negative on incremental carbon emissions.
- 23 -
The following are summarized terms of the Senior Notes as of March 31, 2026:
| Outstanding Principal Amount | Maturity Date | Stated Interest Rate | Interest Payment Dates | Redemption Terms Modification Date | |||||||||||||||||||||||||
| (in millions) | |||||||||||||||||||||||||||||
2026 Senior Notes | (1) | June 15, 2026 | % | June 15 and December 15 | N/A | ||||||||||||||||||||||||
2027 Senior Notes | (2) | June 15, 2027 | % | June 15 and December 15 | N/A | ||||||||||||||||||||||||
2030 Senior Notes | (3) | September 15, 2030 | % | February 15 and August 15 | N/A | ||||||||||||||||||||||||
2031 Senior Notes | (4) | January 15, 2031 | % | January 15 and July 15 | December 15, 2030 (5) | ||||||||||||||||||||||||
2034 Senior Notes | (6) | July 1, 2034 | % | July 1 and January 1 | N/A | ||||||||||||||||||||||||
2035 Senior Notes | (7) | July 15, 2035 | % | January 15 and July 15 | April 15, 2035 (5) | ||||||||||||||||||||||||
2036 Senior Notes | (8) | March 15, 2036 | % | March 15 and September 15 | December 15, 2035 (5) | ||||||||||||||||||||||||
(1)We may redeem the 2026 Senior Notes at par, plus accrued and unpaid interest though the redemption date.
(2)In the first quarter of 2026 we used a portion proceeds from the 2036 Senior Notes and the November 2056 Junior Subordinated Notes to redeem the 2027 Senior Notes. We paid a redemption premium of $18 million, and expensed capitalized debt issuance costs of $1 million associated with the redemption.
(3)We issued the $375 million aggregate principal amount of the 2030 Senior Notes for total proceeds of $371 million ($367 million net of issuance costs) at an effective interest rate of 3.87 %. We may redeem the 2030 Senior Notes in whole or in part at redemption prices defined in the indenture governing the 2030 Senior Notes plus accrued and unpaid interest though the redemption date.
(4)We issued the $600 million aggregate principal amount of the 2031 Senior Notes for total proceeds of $598 million ($593 million net of issuance costs) at an effective interest rate of 6.218 %.
(5)Prior to this date, we may redeem, at our option, some or all of the applicable notes for the outstanding principal amount plus the applicable “make-whole” premium as defined in the indenture governing the applicable notes, plus accrued and unpaid interest through the redemption date. On, or subsequent to, this date, we may redeem the applicable notes in whole or in part at a price equal to 100
(6)We issued $700 million principal amount of 2034 Senior Notes, which bear interest at a rate of 6.375 %. The notes were issued for gross proceeds of $695 million, resulting in a yield to maturity of 6.476 %. In a follow-on offering, we issued an additional $300 million principal amount of 2034 Senior Notes for gross proceeds of $300 million.
(7)We issued the $400 million aggregate principal amount of the 2035 Senior Notes for total proceeds of $398 million ($395 million net of issuance costs) at an effective interest rate of 6.815 %.
(8)In 2026, we issued the $400 million aggregate principal amount of the 2036 Senior Notes for total proceeds of $399 million ($397 million net of issuance costs) at an effective rate of 6.025 %.
The following table presents a summary of the components of the Senior Notes:
| March 31, 2026 | December 31, 2025 | ||||||||||
| (in millions) | |||||||||||
| Principal | $ | $ | |||||||||
| Accrued interest | |||||||||||
| Unamortized premium (discount) | ( | ( | |||||||||
| Less: Unamortized financing costs | ( | ( | |||||||||
Carrying value of Senior Notes | $ | $ | |||||||||
The following table presents interest expense related to the Senior Notes:
- 24 -
| Three months ended March 31, | |||||||||||
| 2026 | 2025 | ||||||||||
(in millions) | |||||||||||
Interest Expense | |||||||||||
Junior Subordinated Notes
We have issued Junior Subordinated Notes which are guaranteed by the Company and certain other subsidiaries on a subordinated basis. Our Junior Subordinated Notes provided for certain covenants, including certain requirements in the event that we merge with or sell substantially all of our assets to another entity. In the event of ratings downgrade by two or more rating agencies due to a change of control, there is a provision in the Junior Subordinated Notes that requires us to either elect to redeem the notes at 101 % of the principal amount plus accrued and unpaid interest or, if we elect not to redeem the notes, and we have not given a redemption notice for any other specified reason, the interest rate will be increased by 5.00 %. We will use cash equal to the net proceeds from the offering of the Junior Subordinated Notes to acquire, invest in or refinance, in whole or in part, new and/or existing eligible green projects.
The following are summarized terms of the Junior Subordinated Notes as of March 31, 2026:
| Outstanding Principal Amount | Maturity Date | Stated Interest Rate | Interest Payment Dates | Redemption Terms Modification Date | |||||||||||||||||||||||||
| (in millions) | |||||||||||||||||||||||||||||
June 2056 Junior Subordinated Notes | June 1, 2056 | % | (1) | June 1 and December 1 | March 3, 2031 (2) | ||||||||||||||||||||||||
November 2056 Junior Subordinated Notes | November 15, 2056 | % | (3) | May 15 and November 15 | August 18, 2031 (2) | ||||||||||||||||||||||||
(1)The June 2056 Junior Subordinated Notes bear interest at a rate of 8.000 % per year until June 1, 2031. After that date, the interest rate resets every five years to the then-current five-year Treasury rate plus a spread of 4.301 %, provided that the interest rate will not be reset below 8.000 %.
(2)On or after this date, we may redeem, at our option, the applicable notes in whole or in part at a price equal to 100
(3)The November 2056 Junior Subordinated Notes bear interest at a rate of 7.125 % per year until November 15, 2031. After that date, the interest rate resets every five years to the then-current five-year Treasury rate plus a spread of 3.478 %, provided that the interest rate will not be reset below 7.125 %
The following table presents a summary of the components of our Junior Subordinated Notes:
| March 31, 2026 | December 31, 2025 | ||||||||||
| (in millions) | |||||||||||
| Principal | $ | $ | |||||||||
| Accrued interest | |||||||||||
| Less: Unamortized financing costs | ( | ( | |||||||||
| Carrying value of Junior Subordinated Notes | $ | $ | |||||||||
The following table presents interest expense related to the Junior Subordinated Notes:
| Three months ended March 31, | |||||||||||
| 2026 | 2025 | ||||||||||
(in millions) | |||||||||||
Interest Expense | |||||||||||
Convertible Notes
We have outstanding exchangeable senior notes, and have previously issued convertible senior notes (together, the “Convertible Notes”). Holders may convert or exchange any of their Convertible Notes into shares of our common stock at the applicable conversion or exchange ratio at any time prior to the close of business on the second scheduled trading day immediately preceding the maturity date, unless the Convertible Notes have been previously redeemed or repurchased by us.
- 25 -
The following are summarized terms of the Convertible Notes as of March 31, 2026:
| Outstanding Principal Amount | Maturity Date | Stated Interest Rate | Interest Payment Dates | Conversion/Exchange Ratio | Conversion/Exchange Price | Issuable Shares | Dividend Threshold Amount (1) | ||||||||||||||||||||||
| (in millions) | (in millions) | ||||||||||||||||||||||||||||
| 2025 Exchangeable Senior Notes | $ | (2) | May 1, 2025 | % | N/A | — | $ | $ | |||||||||||||||||||||
| 2028 Exchangeable Senior Notes | August 15, 2028 | % | February 15 and August 15 | 37.0771 | $ | ||||||||||||||||||||||||
(1)The conversion or exchange ratio is subject to adjustment for dividends declared above these amounts per share per quarter and certain other events that may be dilutive to the holder.
(2)In 2025, we used $220 million in proceeds from our unsecured revolving line of credit to repay the 2025 Exchangeable Senior Notes inclusive of accrued interest which was paid at maturity in the form of an accreted premium.
For the 2028 Exchangeable Senior Notes, following the occurrence of a make-whole fundamental change, we will, in certain circumstances, increase the exchange rate for a holder that converts its exchangeable notes in connection with such make-whole fundamental change. Upon exchange of the 2028 Exchangeable Senior Notes, exchange may be settled through cash, shares of our common stock or a combination of cash and shares of our common stock, at our election (as described in the indenture related to the 2028 Exchangeable Senior Notes). Additionally, upon the occurrence of certain fundamental changes involving us, holders of the 2028 Exchangeable Senior Notes may require us to redeem all or a portion of their notes for cash at a price of 100 % of the principal amount outstanding, plus accrued and unpaid interest. We may redeem the 2028 Exchangeable Senior Notes in whole or in part, at our option, on or after August 20, 2026 and prior to the 62 nd scheduled trading day immediately preceding the maturity date for such notes, if certain conditions are met including our common stock trading above 130 % of the exchange price for at least 20 trading days, as set forth in the indenture relating to the 2028 Exchangeable Senior Notes. Any shares of our common stock issuable upon exchange of the 2028 Exchangeable Senior Notes will have certain registration rights.
Upon any exchange of these Notes, holders will receive a number of shares of our common stock equal to the product of (i) the aggregate initial principal amount of the notes to be exchanged, divided by $1,000 and (ii) the applicable exchange rate, plus cash in lieu of fractional shares. We have allocated an amount equal to the net proceeds of this offering to the acquisition or refinancing of, in whole or in part, new and/or existing eligible green projects, which include assets that are neutral to negative on incremental carbon emissions.
The following table presents a summary of the components of our Convertible Notes:
| March 31, 2026 | December 31, 2025 | ||||||||||
| (in millions) | |||||||||||
| Principal | $ | $ | |||||||||
| Accrued interest | |||||||||||
| Less: Unamortized financing costs | ( | ( | |||||||||
Carrying value of Convertible Notes | $ | $ | |||||||||
The following table presents interest expense related to our Convertible Notes:
| Three months ended March 31, | |||||||||||
| 2026 | 2025 | ||||||||||
(in millions) | |||||||||||
Interest Expense | $ | $ | |||||||||
In order to mitigate the potential dilution to our common stock upon exchange of the 2028 Exchangeable Senior Notes, we entered into privately-negotiated capped call transactions (“Capped Calls”) with certain counterparties. The Capped Calls are separate transactions and are not part of the terms of the 2028 Exchangeable Senior Notes. The total premium for the Capped Calls was recorded as a reduction of additional paid-in capital. The Company used a portion of the proceeds from the 2028 Exchangeable Senior Notes to pay for the cost of the Capped Call premium. The material terms of the Capped Calls are as follows:
- 26 -
| (in millions except per share data) | ||||||||
| Aggregate cost of capped calls | $ | |||||||
| Initial strike price per share | $ | |||||||
| Initial cap price per share | $ | |||||||
| Shares of our common stock covered by the capped calls | ||||||||
| Expiration date | August 15, 2028 | |||||||
CarbonCount Term Loan Facility
We have entered into a CarbonCount Term Loan Facility (the “Unsecured Term Loan Facility”) with a syndicate of banks. Under the Unsecured Term Loan Facility, which matures in 2027, loans can be prepaid without penalty. Principal amounts under the Unsecured Term Loan Facility will bear interest at a rate of Term SOFR plus applicable margins based on our current credit rating, which may be adjusted up to 0.10 % to the extent our Portfolio achieves certain targeted levels of carbon emissions avoidance, as measured by our CarbonCount© metric. As of March 31, 2026, the applicable margin is 1.875 % plus 0.10 %. The coupon on any drawn amounts will be reset at monthly, quarterly, or semi-annual intervals at our election. Interest is due and payable monthly. Payments of 1.25 % of the outstanding principal balance are due quarterly. We intend to allocate an amount equal to the net proceeds of this offering to the acquisition or refinancing of, in whole or in part, new and/or existing eligible green projects, which include assets that are neutral to negative on incremental carbon emissions.
As of March 31, 2026, the outstanding principal and accrued interest balance is $231 million, and the current interest rate is 5.59 %. Amounts which were due under the Unsecured Term Loan Facility as of March 31, 2026 are as follows:
| Future maturities | ||||||||
| (in millions) | ||||||||
| April 1, 2026 to December 31, 2026 | $ | |||||||
| 2027 | ||||||||
| Total | ||||||||
| Less: Unamortized Financing Costs | ( | |||||||
| Carrying Value | $ | |||||||
The Unsecured Term Loan Facility contains terms, conditions, covenants, and representations and warranties that are customary and typical for a transaction of this nature, including various affirmative and negative covenants, and limitations on the incurrence of liens and indebtedness, investments, fundamental organizational changes, dispositions, changes in the nature of business, transactions with affiliates, stock repurchases and dividends we declare. The Unsecured Term Loan Facility also includes customary events of default and remedies.
- 27 -
Secured Term Loan
We have a secured term loan (the “Secured Term Loan”) with a maturity date of January 2028, under which principal amounts bear interest at a rate of Daily Term SOFR plus a credit spread of 2.25 %, plus 0.10 %. We are required to hold interest rate swaps with notional values equal to 85 % of the outstanding principal amount of the loan. The Secured Term Loan is subject to mandatory principal amortization of 5 % per annum, with principal and interest payments due quarterly. The Secured Term Loan contains terms, conditions, covenants, and representations and warranties that are customary and typical for a transaction of this nature, including various affirmative and negative covenants, and limitations on the incurrence of liens and indebtedness, investments, fundamental organizational changes, dispositions, changes in the nature of business, transactions with affiliates, use of proceeds, stock repurchases and dividends we declare. The Secured Term Loan also includes customary events of default and remedies.
As of March 31, 2026, the outstanding principal and accrued interest balance is $155 million, the interest rate as of the last rate reset is 6.06 %, and we have receivables, retained interests in securitization trusts, and equity method investments pledged with a carrying value of $425 million. Amounts which were due under the Secured Term Loan Facility as of March 31, 2026 are as follows:
| Future maturities | ||||||||
| (in millions) | ||||||||
| April 1, 2026 to December 31, 2026 | $ | |||||||
| 2027 | ||||||||
| 2028 | ||||||||
| Total | ||||||||
| Less: Unamortized Financing Costs | ( | |||||||
| Carrying Value | $ | |||||||
Delayed-draw term loan agreement
We have entered into an agreement that provides for a delayed-draw term loan facility in an aggregate principal amount of up to $250 million, available to be drawn through the earlier of June 15, 2026 or the date when the full principal amount is drawn. Drawn loans, if any, mature on June 15, 2028. The facility has a commitment fee during the availability period, and bears interest at a rate of SOFR or alternative base rate plus applicable margins based on our current credit rating. The current applicable margins are 1.650 % for SOFR-based loans and 0.650 % for alternative base rate-based loans. The delayed-draw term loan facility contains terms, conditions, covenants, and representations and warranties that are customary and typical for transactions of this nature, including various affirmative and negative covenants, and limitations on the incurrence of liens and indebtedness, investments, fundamental organizational changes, dispositions, changes in the nature of business, transactions with affiliates, stock repurchases, and dividends we can declare. The delayed-draw term loan facility also includes customary events of default and remedies.
Non-recourse debt
We have outstanding the following asset-backed non-recourse debt and bank loans:
| Outstanding Balance as of | Anticipated Balance at Maturity | Carrying Value of Assets Pledged as of | |||||||||||||||||||||||||||||||||||||||||||||
| March 31, 2026 | December 31, 2025 | Interest Rate | Maturity Date | March 31, 2026 | December 31, 2025 | Description of Assets Pledged | |||||||||||||||||||||||||||||||||||||||||
| (dollars in millions) | |||||||||||||||||||||||||||||||||||||||||||||||
| HASI Harmony Issuer | July 2043 | Equity method investments | |||||||||||||||||||||||||||||||||||||||||||||
Other non-recourse debt (1) | 2026 to 2042 | Receivables | |||||||||||||||||||||||||||||||||||||||||||||
| Unamortized financing costs | ( | ( | |||||||||||||||||||||||||||||||||||||||||||||
Non-recourse debt (2) | $ | $ | |||||||||||||||||||||||||||||||||||||||||||||
(1)Other non-recourse debt consists of various debt agreements used to finance certain of our receivables. Scheduled debt service payment requirements are equal to or less than the cash flows received from the underlying receivables.
(2)The total collateral pledged against our non-recourse debt was $303 million and $311 million as of March 31, 2026 and December 31, 2025, respectively. These amounts include $26 million and $35 million of restricted cash pledged for debt service payments as of March 31, 2026 and December 31, 2025, respectively.
- 28 -
We have pledged the financed assets, and typically our interests in one or more parents or subsidiaries of the borrower that are legally separate bankruptcy remote special purpose entities as security for the non-recourse debt. There is no recourse for repayment of these obligations other than to the applicable borrower and any collateral pledged as security for the obligations. Generally, the assets and credit of these entities are not available to satisfy any of our other debts and obligations. The creditors can only look to the borrower, the cash flows of the pledged assets and any other collateral pledged, to satisfy the debt and we are not otherwise liable for nonpayment of such cash flows. The debt agreements contain terms, conditions, covenants and representations and warranties that are customary and typical for transactions of this nature, including limitations on the incurrence of liens and indebtedness, investments, fundamental organizational changes, dispositions, changes in the nature of business, transactions with affiliates, use of proceeds and stock repurchases. The agreements also include customary events of default, the occurrence of which may result in termination of the agreements, acceleration of amounts due and accrual of default interest. We typically act as servicer for the debt transactions. We were in compliance with all covenants as of March 31, 2026 and December 31, 2025.
We have guaranteed the accuracy of certain of the representations and warranties and other obligations of certain of our subsidiaries under certain of the debt agreements and provided an indemnity against certain losses from “bad acts” of such subsidiaries including fraud, failure to disclose a material fact, theft, misappropriation, voluntary bankruptcy or unauthorized transfers.
The stated minimum maturities of non-recourse debt as of March 31, 2026, were as follows:
| Future minimum maturities | |||||
| (in millions) | |||||
| April 1, 2026 to December 31, 2026 | $ | ||||
| 2027 | |||||
| 2028 | |||||
| 2029 | |||||
| 2030 | |||||
| 2031 | |||||
| Thereafter | |||||
| Total minimum maturities | $ | ||||
| Unamortized financing costs | ( | ||||
| Total non-recourse debt | $ | ||||
The stated minimum maturities of non-recourse debt above include only the mandatory minimum principal payments. To the extent there are additional cash flows received from the pledged assets serving as collateral for certain of our non-recourse debt facilities, these additional cash flows may be required to be used to make additional principal payments against the respective debt. Any additional principal payments made due to these provisions may impact the anticipated balance at maturity of these financings. To the extent there are not sufficient cash flows received from those assets pledged as collateral, the investor has no recourse against other corporate assets to recover any shortfalls.
- 29 -
Interest Rate Swaps
We have entered into certain derivatives designed to hedge interest rate risk associated with certain of our floating-rate interest exposures, including floating-rate loans from our Unsecured Term Loan Facility, unsecured revolving credit facility, Secured Term Loan and the anticipated refinancings of certain of our Senior Notes. From time to time we may also enter into forward-starting interest rate swaps to hedge interest rate risks associated with incremental debt we expect to issue.
| Instrument type | Hedged Rate | Notional Value | Fair Value as of | Term of derivative and forecasted transactions | ||||||||||||||||||||||||||||||||||
| Index | March 31, 2026 | December 31, 2025 | ||||||||||||||||||||||||||||||||||||
| $ in millions | ||||||||||||||||||||||||||||||||||||||
| Interest rate swap | 1 month SOFR | $ | $ | ( | $ | ( | March 2023 to March 2033 | |||||||||||||||||||||||||||||||
| Interest rate swap | Overnight SOFR | June 2026 to June 2033 | ||||||||||||||||||||||||||||||||||||
| Interest rate collar | 1 month SOFR | (1) | May 2023 to May 2026 | |||||||||||||||||||||||||||||||||||
| Interest rate swaps | Overnight SOFR | (2) | ( | ( | September 2023 to June 2033 | |||||||||||||||||||||||||||||||||
| Interest rate swap | Overnight SOFR | % | (3) | June 2027 to June 2037 | ||||||||||||||||||||||||||||||||||
Interest rate swap | Overnight SOFR | (2) | December 2026 to December 2033 | |||||||||||||||||||||||||||||||||||
| Interest rate swap | Overnight SOFR | March 2027 to March 2034 | ||||||||||||||||||||||||||||||||||||
| $ | $ | |||||||||||||||||||||||||||||||||||||
(1) Interest rate collar consists of a purchased interest rate cap of 4.00 % and a written interest rate floor of 3.70 %.
(2) Consists of multiple interest rate swaps with identical maturities and effective dates.
(3) In the first quarter of 2026, we settled this swap for cash proceeds of approximately $2 million. The associated benefit in AOCI will be released into net income as a benefit to interest expense over the period of the forecasted transactions.
The fair values of our interest rate derivatives designated and qualifying as effective cash flow hedges are reflected in our consolidated balance sheets as a component of other assets (if in an unrealized gain position) or accounts payable, accrued expenses and other (if in an unrealized loss position) and in net unrealized gains and losses in AOCI. As of March 31, 2026, all of our derivatives were designated as hedging instruments which were deemed to be effective. As of March 31, 2026, we have posted $10 million of collateral, $5 million of which is netted against the derivative liability included in accounts payable, accrued expenses, and other on our balance sheet, with the remainder in other assets. We hold $4 million of collateral posted by our counterparties which we have netted against the derivative asset which is included in other assets on our balance sheet. The below table shows the changes in our AOCI balance related to our interest rate derivatives designated and qualifying as effective cash flow hedges:
| (Amounts in millions) | ||||||||
Beginning Balance - December 31, 2024 | $ | |||||||
| Changes in fair value | ( | |||||||
| Amounts released into interest expense | ( | |||||||
Ending Balance - December 31, 2025 | $ | |||||||
| Changes in fair value | ||||||||
| Amounts released into interest expense | ( | |||||||
Ending Balance - March 31, 2026 | $ | |||||||
We expect a net benefit of approximately $6 million to be released out of AOCI into interest expense over the 12 months following March 31, 2026. The below table shows the benefit (expense) included in interest expense as a result of our hedging activities for the three months ended March 31, 2026 and 2025, respectively.
- 30 -
| Three months ended March 31, | |||||||||||
| 2026 | 2025 | ||||||||||
| (in thousands) | |||||||||||
| Benefit (expense) included in interest expense due to hedging activities | |||||||||||
9.Commitments and Contingencies
Litigation
The nature of our operations exposes us to the risk of claims and litigation in the normal course of our business. We are not currently subject to any legal proceedings that are probable of having a material adverse effect on our financial position, results of operations or cash flows.
Guarantees and other commitments
In connection with some of our transactions, we have provided certain limited representations, warranties, covenants and/or provided an indemnity against certain losses resulting from our own actions, including related to certain investment tax credits. As of March 31, 2026, there have been no such actions resulting in claims against the Company.
As a part of broader project restructuring in order to increase our expected cash flows from the investment, we alongside the project sponsor, made guarantees to support the working capital needs of two of the project companies owned by Jupiter, an equity method investee. The guarantees are in effect until the tax equity investors in those project companies achieve their target preferred returns, and our contractual maximum under these guarantees is $53 million, and is limited to $20 million in any particular calendar year. If required, we would satisfy these guarantees by making additional equity contributions to Jupiter. As of March 31, 2026, we have no liability recorded as a result of these guarantees as we believe it is not probable we will be required to perform under them. As of March 31, 2026, we have not been asked to perform under them.
10. Income Tax
- 31 -
11. Equity
Dividends and Distributions
Our board of directors declared the following dividends in 2025 and 2026:
| Announced Date | Record Date | Pay Date | Amount per share | ||||||||||||||||||||
| 2/13/2025 | 4/4/2025 | 4/18/2025 | $ | ||||||||||||||||||||
| 5/7/2025 | 7/2/2025 | 7/11/2025 | $ | ||||||||||||||||||||
| 8/7/2025 | 10/3/2025 | 10/17/2025 | $ | ||||||||||||||||||||
| 11/6/2025 | 12/29/2025 | (1) | 1/9/2026 | $ | |||||||||||||||||||
| 2/12/2026 | 4/2/2026 | 4/17/2026 | $ | ||||||||||||||||||||
| 5/7/2026 | 7/2/2026 | 7/10/2026 | $ | ||||||||||||||||||||
(1) This dividend is treated as a distribution in the year following the record date for tax purposes.
Equity Offerings
We have an effective universal shelf registration statement registering the potential offer and sale, from time to time and in one or more offerings, of any combination of our common stock, preferred stock, depositary shares, debt securities, warrants and rights (collectively referred to as the “securities”). We may offer the securities directly, through agents, or to or through underwriters by means of ordinary brokers’ transactions on the NYSE or otherwise at market prices prevailing at the time of sale or at negotiated prices and may include “at the market” (“ATM”) offerings to or through a market maker or into an existing trading market on an exchange or otherwise. We have a dividend reinvestment and stock purchase plan, allowing stockholders and holders of OP Units (including LTIP Units) to purchase shares of our common stock by reinvesting cash dividends or distributions received. We completed the following public offerings (including ATM issuances) of our common stock during 2026 and 2025:
| Date/Period | Common Stock Offerings | Shares Issued | Price Per Share | Net Proceeds (1) | ||||||||||||||||||||||
| (amounts in millions, except per share amounts) | ||||||||||||||||||||||||||
| Q1 2025 | ATM | (2) | ||||||||||||||||||||||||
| Q2 2025 | ATM | (2) | ||||||||||||||||||||||||
| Q3 2025 | ATM | (2) | ||||||||||||||||||||||||
| Q4 2025 | ATM | (2) | ||||||||||||||||||||||||
| Q1 2026 | ATM | |||||||||||||||||||||||||
(1)Net proceeds from the offerings are shown after deducting underwriting discounts and commissions.
(2)Represents the average price per share at which investors in our ATM offerings purchased our shares.
Equity-based Compensation Awards
We have issued equity awards that vest from 2026 to 2029 subject to service, performance and market conditions. During the three months ended March 31, 2026, our board of directors awarded employees and directors 676,538 shares of restricted stock, restricted stock units and LTIP Units that vest from 2027 to 2029. Refer to Note 4 to our financial statements in this Form 10-Q for background on the LTIP Units.
- 32 -
For the three months ended March 31, 2026 we recorded $15 million of stock based compensation compared to $10 million during the three months ended March 31, 2025. We have a retirement policy which provides for full vesting at retirement of any time-based awards that were granted prior to the date of retirement and permits the vesting of market-based or performance-based awards that were granted prior to the date of retirement according to the original vesting schedule of the award, subject to the achievement of the applicable market or performance measures. Employees are eligible for the retirement policy upon meeting age and years of service criteria. The total unrecognized compensation expense related to awards of shares of restricted stock and restricted stock units was approximately $31 million as of March 31, 2026. We expect to recognize compensation expense related to our equity awards over a weighted-average term of approximately 2 years. A summary of the unvested shares of restricted common stock that have been issued is as follows:
| Restricted Shares of Common Stock | Weighted Average Grant Date Fair Value | Value | |||||||||||||||
| (per share) | (in millions) | ||||||||||||||||
| Ending Balance — December 31, 2024 | $ | $ | |||||||||||||||
| Granted | |||||||||||||||||
| Vested | ( | ( | |||||||||||||||
| Forfeited | ( | ( | |||||||||||||||
| Ending Balance — December 31, 2025 | $ | $ | |||||||||||||||
| Granted | |||||||||||||||||
| Vested | ( | ( | |||||||||||||||
| Forfeited | ( | ( | |||||||||||||||
| Ending Balance — March 31, 2026 | $ | $ | |||||||||||||||
A summary of the unvested shares of restricted stock units that have market-based vesting conditions that have been issued is as follows:
Restricted Stock Units (1) | Weighted Average Grant Date Fair Value | Value | |||||||||||||||
| (per share) | (in millions) | ||||||||||||||||
| Ending Balance — December 31, 2024 | $ | $ | |||||||||||||||
| Granted | |||||||||||||||||
| Incremental performance shares granted | |||||||||||||||||
| Vested | ( | ( | |||||||||||||||
| Forfeited | ( | ( | |||||||||||||||
| Ending Balance — December 31, 2025 | $ | $ | |||||||||||||||
| Granted | |||||||||||||||||
| Incremental performance shares granted | |||||||||||||||||
| Vested | ( | ( | |||||||||||||||
| Forfeited | |||||||||||||||||
| Ending Balance — March 31, 2026 | $ | $ | |||||||||||||||
(1) As discussed in Note 2, restricted stock units with market-based vesting conditions can vest between 0 % and 200 % subject to both the absolute performance of the Company’s common stock as well as relative performance compared to a group of peers. The incremental performance shares granted relate to the vesting of awards at the achieved performance level.
- 33 -
A summary of the unvested LTIP Units that have time-based vesting conditions that have been issued is as follows:
LTIP Units (1) | Weighted Average Grant Date Fair Value | Value | |||||||||||||||
| (per share) | (in millions) | ||||||||||||||||
| Ending Balance — December 31, 2024 | $ | $ | |||||||||||||||
| Granted | |||||||||||||||||
| Vested | ( | ( | |||||||||||||||
| Forfeited | ( | ( | |||||||||||||||
| Ending Balance — December 31, 2025 | $ | $ | |||||||||||||||
| Granted | |||||||||||||||||
| Vested | ( | ( | |||||||||||||||
| Forfeited | |||||||||||||||||
| Ending Balance — March 31, 2026 | $ | $ | |||||||||||||||
(1) See Note 4 for information on the vesting of LTIP Units.
A summary of the unvested LTIP Units that have market-based vesting conditions that have been issued is as follows:
LTIP Units (1) | Weighted Average Grant Date Fair Value | Value | |||||||||||||||
| (per share) | (in millions) | ||||||||||||||||
| Ending Balance — December 31, 2024 | $ | $ | |||||||||||||||
| Granted | |||||||||||||||||
| Incremental performance shares granted | |||||||||||||||||
| Vested | |||||||||||||||||
| Forfeited | ( | ( | |||||||||||||||
| Ending Balance — December 31, 2025 | $ | $ | |||||||||||||||
| Granted | |||||||||||||||||
| Incremental performance shares granted | |||||||||||||||||
| Vested | ( | ( | |||||||||||||||
| Forfeited | |||||||||||||||||
| Ending Balance — March 31, 2026 | $ | $ | |||||||||||||||
(1) See Note 4 for information on the vesting of LTIP Units. LTIP Units with market-based vesting conditions can vest between 0 % and 200 % subject to both the absolute performance of our common stock as well as relative performance compared to a group of peers. The incremental performance shares granted relate to the vesting of awards at the achieved performance level.
- 34 -
A summary of the unvested LTIP Units that have performance-based vesting conditions that have been issued is as follows:
LTIP Units (1) | Weighted Average Grant Date Fair Value | Value | ||||||||||||||||||
| (per share) | (in millions) | |||||||||||||||||||
| Ending Balance — December 31, 2024 | $ | $ | ||||||||||||||||||
| Granted | ||||||||||||||||||||
| Incremental performance shares granted | ||||||||||||||||||||
| Vested | ||||||||||||||||||||
| Forfeited | ||||||||||||||||||||
| Ending Balance — December 31, 2025 | $ | $ | ||||||||||||||||||
| Granted | ||||||||||||||||||||
| Incremental performance shares granted | ||||||||||||||||||||
| Vested | ||||||||||||||||||||
| Forfeited | ||||||||||||||||||||
| Ending Balance — March 31, 2026 | $ | $ | ||||||||||||||||||
(1) See Note 4 for information on the vesting of LTIP Units. LTIP Units with performance-based vesting conditions can vest between 0 % and 200 % subject to the achievement of certain adjusted earnings per share. The incremental performance shares granted relate to the vesting of awards at the achieved performance level.
12.Earnings per Share of Common Stock
The net income or loss attributable to the non-controlling OP units have been excluded from the basic earnings per share and the diluted earnings per share calculations attributable to common stockholders. Unvested share-based payment awards that contain non-forfeitable rights to dividends or dividend equivalents (whether paid or unpaid) are participating securities and are excluded from net income available to common stockholders in the computation of earnings per share pursuant to the two-class method. Certain share-based awards are included in the diluted share count to the extent they are dilutive as discussed in Note 2. To the extent our Convertible Notes are dilutive under the if-converted method, we add back the interest expense to the numerator and include the weighted average shares of potential common stock over the period issuable upon conversion or exchange of the note in the denominator in calculating dilutive EPS as described in Note 2.
- 35 -
The computation of basic and diluted earnings per common share of our common stock is as follows:
| Three Months Ended March 31, | |||||||||||
| 2026 | 2025 | ||||||||||
| Numerator: | (in millions, except share and per share data) | ||||||||||
Net income (loss) attributable to controlling stockholders and participating securities | $ | ( | $ | ||||||||
Less: Dividends and distributions on participating securities | ( | ( | |||||||||
| Less: Undistributed earnings attributable to participating securities | |||||||||||
| Net income (loss) attributable to controlling stockholders — basic | ( | ||||||||||
| Add: Interest expense related to Convertible Notes under the if-converted method | |||||||||||
| Add: Undistributed earnings attributable to participating securities | |||||||||||
| Net income (loss) attributable to controlling stockholders — dilutive | $ | ( | $ | ||||||||
| Denominator: | |||||||||||
| Weighted-average number of common shares — basic | |||||||||||
| Weighted-average number of common shares — diluted | |||||||||||
| Basic earnings per common share | $ | ( | $ | ||||||||
| Diluted earnings per common share | $ | ( | $ | ||||||||
| Securities being allocated a portion of earnings: | |||||||||||
| Weighted-average number of OP units | |||||||||||
As of March 31, | |||||||||||
| 2026 | 2025 | ||||||||||
| Participating securities: | |||||||||||
| Unvested restricted common stock and unvested LTIP Units with time-based vesting conditions outstanding at period end | |||||||||||
| Three Months Ended March 31, | |||||||||||
| 2026 | 2025 | ||||||||||
| Potentially dilutive securities as of period end that were not dilutive for the presented periods: | |||||||||||
Unvested restricted common stock and unvested LTIP Units with time-based vesting conditions | |||||||||||
| Restricted stock units | |||||||||||
| LTIP Units with market-based vesting conditions | |||||||||||
LTIP Units with performance-based vesting conditions | |||||||||||
| Potential shares of common stock related to Convertible Notes | |||||||||||
- 36 -
13. Equity Method Investments
As of March 31, 2026 and December 31, 2025, we had 49 and 47 equity method investments, respectively. The majority of these investees are limited liability companies taxed as partnerships wherein we participate in cash distributions and tax attributes according to pre-negotiated profit-sharing arrangements. The limited liability company agreements do not define a fixed percentage of our ownership of these entities, and our claims on the net assets of each investment changes over time as preferred investors achieve their pre-negotiated preferred returns. We describe our accounting for non-controlling equity investments in Note 2.
The following is a summary of the consolidated balance sheets and income statements of the entities in which we have a significant equity method investment. These amounts are presented on the underlying investees’ accounting basis. In certain instances, adjustment to these equity values may be necessary in order to reflect our basis in these investments, for reasons including but not limited to the investees reporting to us being on a cost basis rather than a fair value basis or due to our allocations under HLBV differing from our purchase price of the investment. As described in Note 2, any difference between the amount of our investment and the amount of our share of underlying equity is generally amortized over the life of the assets and liabilities to which the differences relate. Certain of our equity method investments have the unrealized mark-to-market losses on energy hedges at the project level that do not qualify for hedge accounting. These unrealized mark-to-market losses, which resulted from rising energy prices, are recorded in the revenue line of the projects’ statements of operations. As these swaps are settled, the projects will sell power at the higher market price, offsetting the loss recognized on the energy hedges. Certain of the projects in which we have equity method investments also have interest rate swaps which are designated as cash flow hedges, and we recognize the portion of the gain or loss allocated to us related to those instruments through other comprehensive income. As of March 31, 2026 and December 31, 2025, we have accumulated other comprehensive income net of tax effect of $25 million and $24 million respectively, related to the interest rate swaps designated as cash flow hedges by our investees.
Palmetto HASI Holdings LLC | Other Investments (1) | Total | |||||||||||||||
| (in millions) | |||||||||||||||||
| Balance Sheet | |||||||||||||||||
As of December 31, 2025 | |||||||||||||||||
| Current assets | $ | $ | $ | ||||||||||||||
| Total assets | |||||||||||||||||
| Current liabilities | |||||||||||||||||
| Total liabilities | |||||||||||||||||
Members’ equity | |||||||||||||||||
As of December 31, 2024 | |||||||||||||||||
| Current assets | |||||||||||||||||
| Total assets | |||||||||||||||||
| Current liabilities | |||||||||||||||||
| Total liabilities | |||||||||||||||||
Members’ equity | |||||||||||||||||
| Income Statement | |||||||||||||||||
For the year ended December 31, 2025 | |||||||||||||||||
| Revenue | |||||||||||||||||
| Income (loss) from continuing operations | ( | ( | ( | ||||||||||||||
| Net income (loss) | ( | ( | ( | ||||||||||||||
For the year ended December 31, 2024 | |||||||||||||||||
| Revenue | |||||||||||||||||
| Income (loss) from continuing operations | ( | ( | |||||||||||||||
| Net income (loss) | ( | ( | |||||||||||||||
(1)Represents aggregated financial statement information for investments not separately presented.
- 37 -
Item 2. Management’s Discussion and Analysis of Financial Condition and Results of Operations
In this Form 10-Q, unless specifically stated otherwise or the context otherwise indicates, references to “we,” “our,” “us,” and the “Company” refer to HA Sustainable Infrastructure Capital, Inc., a Delaware corporation, Hannon Armstrong Sustainable Infrastructure, L.P., and any of our other subsidiaries. Hannon Armstrong Sustainable Infrastructure, L.P. is a Delaware limited partnership of which we are the sole general partner and to which we refer in this Form 10-Q as our “Operating Partnership.” We invest in projects which, among others things, are focused on reducing the impact of greenhouse gases that have been scientifically linked to climate change. We refer to these gases, which are often for consistency expressed as carbon dioxide equivalents, as carbon emissions.
The following discussion is a supplement to and should be read in conjunction with the accompanying Condensed Consolidated Financial Statements and related notes and with our Annual Report on Form 10-K for the year ended December 31, 2025, as amended by our Amendment No. 1 to our Annual Report on Form 10-K for the year ended December 31, 2025 (collectively, our “2025 Form 10-K”), that was filed with the SEC.
Our Business
We are an investor in sustainable infrastructure assets advancing the energy transition. With more than $16 billion in Managed Assets, our investment strategy is focused primarily on long-lived real assets that generate long-term recurring cash flows. Our investments take many forms, including equity, joint ventures, real estate, receivables or securities, and other financing transactions. We generate recurring income from net investment income from our portfolio, from income through our residual ownership in securitization and co-investment structures, and from asset management and other services. We also generate income through gain-on-sale securitization transactions, broker/dealer and other services.
We are internally managed by an executive team that has extensive relevant industry knowledge and experience, and have a team of over 170 clean energy investment, operating, and technical professionals. We have long-standing relationships with some of the leading U.S. clean energy project developers, owners and operators, utilities, and energy service companies (“ESCOs”), which provide recurring, programmatic investment and fee-generating opportunities, while also enabling scale benefits and operational and transactional efficiencies.
Our investments are focused on three markets:
•Behind-the-Meter (“BTM”): distributed renewable energy projects which reduce energy cost and/or usage and increase resiliency through residential, commercial & industrial, and community solar power and energy storage deployments, as well as energy efficiency improvements such as heating, ventilation, and air conditioning systems (HVAC), lighting, energy controls, roofs, windows, building shells, and/or combined heat and power systems. The off-taker or counterparty for BTM assets may be the building owner or occupant, and our investment may be secured by the installed improvements or other real estate rights;
•Grid-Connected (“GC”): utility-scale renewable energy projects that deploy cleaner energy sources, such as solar, solar-plus-storage, and wind, to generate cleaner, lower cost energy. The offtakers or counterparties for GC assets may be utilities, electric users, or participants in the wholesale electric power markets who have entered into contractual commitments, such as power purchase agreements (“PPAs”), to purchase power produced by a renewable energy project at a specified price with potential price escalators for a portion of the project’s estimated life; and
•Fuels, Transport, and Nature (“FTN”): a range of infrastructure assets that are designed to reduce emissions and/or provide environmental benefits in projects beyond the power grid, such as transportation and fuels, including renewable natural gas (RNG) plants, transportation fleet enhancements, and ecological restoration projects, among others. For FTN assets, the off-takers may be oil and gas refiners, industrial companies, and vertically integrated electric utilities.
We have also identified additional markets beyond our three traditional markets in which we believe we can identify potential investments which align with our investment strategy.
Our primary objective is to earn attractive risk-adjusted returns that sufficiently exceed our cost of capital. We believe we are able to generate superior risk-adjusted returns in part due to our adherence to a core set of investment criteria. In particular, we are focused primarily on investments which are:
•income-generating sustainable infrastructure assets;
•supported by underlying, long-term recurring cash flows;
•contracted with creditworthy, incentivized off-takers;
•reliant upon proven commercial technologies; and
- 38 -
•originated by programmatic clients.
We completed approximately $637 million of transactions during the three months ended March 31, 2026, compared to approximately $706 million during the same period in 2025. As of March 31, 2026, our total Managed Assets are $16.4 billion, and include our Portfolio, the portion of assets owned by others in our co-investment vehicle, and other assets in securitization trusts. We held approximately $7.6 billion of transactions on our balance sheet, which we refer to as our “Portfolio.” As of March 31, 2026, our Portfolio consisted of over 600 assets and we seek to manage the diversity of our Portfolio by, among other factors, project type, project operator, type of investment, type of technology, transaction size, geography, obligor and maturity. The fee-generating assets attributable to other investors in our co-investment structures that were not consolidated as part of our Portfolio totaled approximately $1.1 billion.
Certain of the assets we originate have a risk and return profile which makes them better suited for other institutional investors rather than for inclusion in our own Portfolio. We finance such investments via securitization transactions, where we transfer all or a portion of an investment to a securitization trust in exchange for cash and/or residual interests in the trust, and in some cases, ongoing fees. As of March 31, 2026, we manage approximately $7.3 billion in assets in such securitization trusts.
Our equity investments in energy transition assets and infrastructure projects are operated by various renewable energy companies or by joint ventures in which we participate. These transactions allow us to participate in the cash flows associated with these projects, typically on a priority basis. Our debt investments in various renewable energy or other sustainable infrastructure projects or portfolios of projects are generally secured by the installed improvements, or other real estate rights. Our energy efficiency debt investments are usually assigned the payment stream from the project savings and other contractual rights, often using our pre-existing master purchase agreements with the ESCOs.
Investing greater than 30% of our equity capital in any single investment requires the approval of a majority of our independent directors. A single investment of greater than 15% of of our equity capital may require the approval of a majority of our independent directors, if the investment does not meet certain board-approved investment criteria. We may adjust the mix and duration of our assets over time in order to allow us to manage various aspects of our Portfolio, including expected risk-adjusted returns, macroeconomic conditions, liquidity, availability of adequate financing for our assets, and our exemption from registration as an investment company under the 1940 Act.
We believe we have a broad range of financing sources available to fund our growing investment volume. We finance our business through cash on hand, debt which may be either unsecured or secured and either fixed- or floating-rate, or equity, and we may also decide to finance such transactions through the use of off-balance sheet securitizations or co-investment structures. We have an active co-investment vehicle with KKR where we jointly invest in eligible projects, and we may consider further use of similar structures to allow us to expand the investments that we make or to manage our Portfolio diversification. Our revolving line of credit and our commercial paper programs allow us flexibility with regards to the timing of long-term capital markets transactions. We manage the interest rate risk associated with debt issuances through hedging activities, including the use of interest rate swaps. When issuing debt, we generally provide the estimated carbon emission savings using CarbonCount. In addition, certain of our debt issuances meet the environmental eligibility criteria for green bonds as defined by the International Capital Markets Association’s Green Bond Principles, which we believe makes our debt more attractive for certain investors compared to such offerings that do not qualify under these principles.
We have a large and active pipeline of potential new opportunities that are in various stages of our underwriting process. We refer to potential opportunities as being part of our pipeline if we have determined that the project fits within our investment strategy and exhibits the appropriate risk and reward characteristics through an initial credit analysis, including a quantitative and qualitative assessment of the opportunity, as well as research on the relevant market and sponsor. Our pipeline of transactions that could potentially close in the next 12 months consists of opportunities in which we will be the lead originator as well as opportunities in which we may participate with other institutional investors. There can be no assurance with regard to any specific terms of such pipeline transactions or that any or all of the transactions in our pipeline will be completed. As of March 31, 2026, our pipeline consisted of more than $6.5 billion in new equity, debt and real estate opportunities. Of our pipeline, approximately 34% is related to BTM assets, 47% is related to GC assets, and 14% are related to FTN assets, with the remainder related to other sustainable infrastructure.
As part of our investment process, we calculate the ratio of the estimated first year of metric tons of carbon emissions avoided by our investments divided by the capital invested to quantify the carbon impact of our investments. In this calculation, which we refer to as CarbonCount, we use emissions factor data, expressed on a CO2 equivalent basis, representing the locational marginal emissions associated with a project to determine an estimate of a project’s energy production or savings to compute an estimate of metric tons of carbon emissions avoided. In addition to carbon emission avoidance, we also consider other environmental attributes, such as water use reduction, stormwater remediation benefits and stream restoration benefits.
We operate our business in a manner that permits us to maintain our exemption from registration as an investment company under the 1940 Act.
- 39 -
Factors Impacting our Operating Results
We expect that our results of operations will be affected by a number of factors and will primarily depend on the size and transaction mix of our Portfolio, the income we receive from securitizations, syndications and other services, our Portfolio’s credit risk profile, changes in market interest rates, commodity prices, federal, state and/or municipal governmental policies, general market conditions in local, regional and national economies, and our ability to maintain our exemption from registration as an investment company under the 1940 Act. We provide a summary of the factors impacting our operating results in our 2025 Form 10-K under “Item 7. Management Discussion and Analysis of Financial Condition and Results of Operations – Factors Impacting our Operating Results.”
Critical Accounting Policies and Use of Estimates
Our financial statements are prepared in accordance with GAAP, which requires the use of estimates and assumptions that involve the exercise of judgment and use of assumptions as to future uncertainties. Understanding our accounting policies and the extent to which we make judgments and estimates in applying these policies is integral to understanding our financial statements. We believe the estimates and assumptions used in preparing our financial statements and related footnotes are reasonable and supportable based on the best information available to us as of March 31, 2026. Various uncertainties may materially impact the accuracy of the estimates and assumptions used in the financial statements and related footnotes and, as a result, actual results may vary significantly from estimates.
We have identified the following accounting policies as critical because they require significant judgments and assumptions about highly complex and inherently uncertain matters and the use of reasonably different estimates and assumptions could have a material impact on our reported results of operations or financial condition. These critical accounting policies govern Consolidation, Equity Method Investments, Impairment or the establishment of an allowance under ASC 326 for our Portfolio and Securitization of Financial Assets. We evaluate our critical accounting estimates and judgments on an ongoing basis and update them, as necessary, based on changing conditions. We provide additional information on our critical accounting policies and use of estimates under “Item 7. Management’s Discussion and Analysis of Financial Condition and Results of Operation — Critical Accounting Policies and Use of Estimates” in our 2025 Form 10-K and under Note 2 to our financial statements in this Form 10-Q.
Financial Condition and Results of Operations
Our Portfolio
Our Portfolio totaled approximately $7.6 billion as of March 31, 2026 and included approximately $3.8 billion of BTM assets, approximately $2.6 billion of GC assets, and approximately $1.2 billion of FTN assets. Approximately 54% of our Portfolio consisted of equity method investments in renewable energy related projects. Approximately 38% consisted of fixed-rate receivables and debt securities, approximately 6% consisted of floating-rate receivables, and 2% of our Portfolio was real estate leased to renewable energy projects under lease agreements. Our Portfolio consisted of over 600 transactions with an average size of $12 million and the weighted average remaining life of our Portfolio (excluding match-funded transactions) of approximately 16 years as of March 31, 2026. Our Portfolio consisted of the following asset classes as of March 31, 2026:
- 40 -
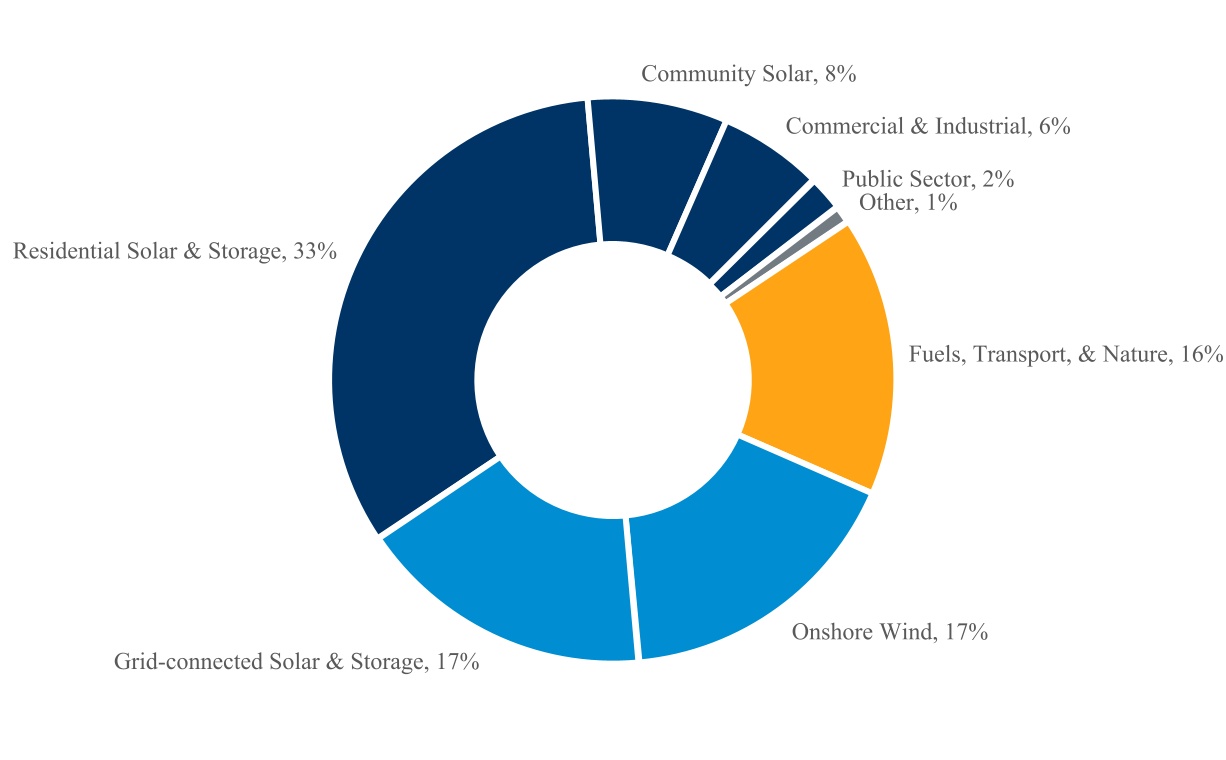

The table below provides details on the interest rate and maturity of our receivables and debt securities as of March 31, 2026:
| Balance | Maturity | ||||||||||
| (in millions) | |||||||||||
Floating rate receivables, interest rates 9.50% or greater per annum | $ | 471 | 2027 to 2030 | ||||||||
| Fixed-rate receivables, interest rates less than 5.00% per annum | 43 | 2029 to 2047 | |||||||||
Fixed-rate receivables, interest rates from 5.00% to 6.49% per annum | 51 | 2026 to 2041 | |||||||||
Fixed-rate receivables, interest rates from 6.50% to 7.99% per annum | 890 | 2027 to 2069 | |||||||||
Fixed-rate receivables, interest rates from 8.00% to 9.49% per annum | 942 | 2026 to 2067 | |||||||||
Fixed-rate receivables, interest rates 9.50% or greater per annum | 922 | 2026 to 2050 | |||||||||
| Receivables | 3,319 | (1) | |||||||||
| Allowance for loss on receivables | (67) | ||||||||||
| Receivables, net of allowance | 3,252 | ||||||||||
Fixed-rate debt securities, interest rates less than 5.00% per annum | 6 | 2033 to 2047 | |||||||||
Fixed-rate debt securities, interest rates from 8.01% to 9.49% per annum | 3 | 2055 | |||||||||
Fixed-rate debt securities, interest rates 9.50% or greater per annum | 64 | 2055 | |||||||||
Total receivables and debt securities | $ | 3,325 | |||||||||
(1) Excludes receivables held for sale of $36 million.
The table below presents, for the receivables, debt securities, and real estate related holdings of our Portfolio and our interest-bearing liabilities inclusive of our short-term commercial paper issuances and revolving credit facilities, the average outstanding balances, income earned, the interest expense incurred, and average yield or cost. Our earnings from our equity method investments are not included in this table.
- 41 -
| Three Months Ended March 31, | |||||||||||
| 2026 | 2025 | ||||||||||
| (dollars in millions) | |||||||||||
| Portfolio, excluding equity method investments | |||||||||||
Interest and rental income from receivables, debt securities, and real estate | $ | 82 | $ | 66 | |||||||
Average balance of receivables, debt securities, and real estate | $ | 3,433 | $ | 3,052 | |||||||
Average yield from receivables, debt securities, and real estate | 9.5 | % | 8.7 | % | |||||||
| Debt | |||||||||||
Interest expense (1) | $ | 80 | $ | 64 | |||||||
| Average balance of debt | $ | 5,267 | $ | 4,555 | |||||||
| Average cost of debt | 6.1 | % | 5.7 | % | |||||||
(1) Excludes any loss on debt modification or extinguishment included in interest expense in our income statements.
The following table provides a summary of our anticipated principal repayments for our receivables and debt securities as of March 31, 2026:
| Principal payment due by Period | |||||||||||||||||||||||||||||
| Total | Less than 1 year | 1-5 years | 5-10 years | More than 10 years | |||||||||||||||||||||||||
| (in millions) | |||||||||||||||||||||||||||||
| Receivables (excluding allowance) | $ | 3,319 | $ | 246 | $ | 2,185 | $ | 677 | $ | 211 | |||||||||||||||||||
Debt securities | 73 | 1 | 8 | 4 | 60 | ||||||||||||||||||||||||
See Note 6 to our financial statements in this Form 10-Q for information on:
•the anticipated maturity dates of our receivables and debt securities and the weighted average yield for each range of maturities as of March 31, 2026;
•the term of our leases and a schedule of our future minimum rental income under our land lease agreements as of March 31, 2026;
•the Performance Ratings of our Portfolio; and
•the receivables on non-accrual status.
For information on our retained interests in securitization trusts, see Note 5 to our financial statements in this Form 10-Q. These assets do not have a contractual maturity date and the underlying securitized assets have contractual maturity dates until 2065.
- 42 -
Results of Operations
Comparison of the Three Months Ended March 31, 2026 vs. Three Months Ended March 31, 2025
| Three months ended March 31, | |||||||||||||||||||||||
| 2026 | 2025 | $ Change | % Change | ||||||||||||||||||||
| (dollars in thousands) | |||||||||||||||||||||||
| Revenue | |||||||||||||||||||||||
Interest and rental income | $ | 82,689 | $ | 66,477 | $ | 16,212 | 24 | % | |||||||||||||||
| Gain on sale of assets | 22,752 | 18,668 | 4,084 | 22 | % | ||||||||||||||||||
Management fees and retained interest income | 9,731 | 6,999 | 2,732 | 39 | % | ||||||||||||||||||
Origination fee and other income | 9,054 | 4,797 | 4,257 | 89 | % | ||||||||||||||||||
| Total Revenue | 124,226 | 96,941 | 27,285 | 28 | % | ||||||||||||||||||
| Expenses | |||||||||||||||||||||||
| Interest expense | 99,275 | 64,677 | 34,598 | 53 | % | ||||||||||||||||||
Provision for loss on receivables and retained interests in securitization trusts | 4,541 | 3,812 | 729 | 19 | % | ||||||||||||||||||
| Compensation and benefits | 35,505 | 24,980 | 10,525 | 42 | % | ||||||||||||||||||
| General and administrative | 10,166 | 9,378 | 788 | 8 | % | ||||||||||||||||||
| Total expenses | 149,487 | 102,847 | 46,640 | 45 | % | ||||||||||||||||||
| Income (loss) before equity method investments | (25,261) | (5,906) | (19,355) | 328 | % | ||||||||||||||||||
| Income (loss) from equity method investments | (79,258) | 87,989 | (167,247) | (190) | % | ||||||||||||||||||
| Income (loss) before income taxes | (104,519) | 82,083 | (186,602) | (227) | % | ||||||||||||||||||
| Income tax (expense) benefit | 30,777 | (23,898) | 54,675 | (229) | % | ||||||||||||||||||
| Net income (loss) | $ | (73,742) | $ | 58,185 | $ | (131,927) | (227) | % | |||||||||||||||
•Net income decreased by $132 million due primarily to a decrease in income (loss) from equity method investments of $167 million and an increase in total expenses of $47 million, offset by an increase in revenue of $27 million and a $55 million decrease in income tax expense.
•Total revenue increased by $27 million due to an increase in interest and rental income of $16 million caused by a higher average asset balance and asset yield, a $4 million increase in gain on sale of assets driven by a change in the mix of assets being securitized, a $4 million increase in origination fee and other income due to a structuring advisory fee recognized, and a $3 million increase in management fees and retained interest income due to a larger fee-earning Managed Assets balance.
•Interest expense increased by $35 million due to $19 million in redemption fees and the expensing of capitalized debt issuance costs associated with our redemption of the 2027 Senior Notes, as well due to a larger average outstanding debt balance and a higher average interest rate driven by the issuance of Junior Subordinated Notes that bear a higher interest rate but which reduce our need to issue equity to maintain our desired financial leverage ratio as a result of the partial equity treatment of these instruments by rating agencies. We recorded a $5 million provision for loss on receivables and retained interests in securitization trusts, driven primarily by a loan-specific reserve where the underlying assets are experiencing project-specific technical challenges which are currently in the process of being remediated.
•Compensation and benefits expenses increased by $11 million primarily due to the acceleration of share-based compensation due to employees meeting the criteria of the Company’s retirement policy.
•Income (loss) from equity method investments decreased by $167 million primarily due to a $97 million loss caused by a timing difference between an investee’s execution of an investment tax credit sale agreement and their distribution of cash for the credit sale to the tax equity investors. The execution of the sale agreement increased the tax equity investors’ capital accounts, which increased their allocation of GAAP equity relative to ours under the HLBV method. The tax equity investors’ capital accounts are expected to normalize in a subsequent period when the cash is distributed to the tax equity investors, which will increase our allocation of GAAP equity. The timing of the tax capital account impacts does not affect our economics from the investment.
•Income tax expense decreased by $55 million primarily due to lower pre-tax book income.
- 43 -
Non-GAAP Financial Measures
We consider the following non-GAAP financial measures useful to investors as key supplemental measures of our performance: (1) Adjusted Earnings, (2) Adjusted Recurring Net Investment Income, (3) Managed Assets, and (4) Adjusted Cash from Operations plus Other Portfolio Collections. These non-GAAP financial measures should be considered along with, but not as alternatives to, net income or loss as measures of our operating performance. These non-GAAP financial measures, as calculated by us, may not be comparable to similarly named financial measures as reported by other companies that do not define such terms exactly as we define such terms.
Adjusted Earnings
We calculate Adjusted Earnings as GAAP net income (loss) excluding equity-based expenses, provisions for loss on receivables, amortization of intangibles, losses (gains) from modification or extinguishment of debt facilities, non-cash tax charges and the earnings attributable to our non-controlling interest of our Operating Partnership. We also make an adjustment to eliminate our portion of fees we earn from related-party co-investment structures, and for our equity method investments in the renewable energy projects as described below. We will use judgment in determining when we will reflect the losses on receivables in our Adjusted Earnings, and will consider certain circumstances such as the time period in default, sufficiency of collateral as well as the outcomes of any related litigation. In the future, Adjusted Earnings may also exclude one-time events pursuant to changes in GAAP and certain other adjustments as approved by a majority of our independent directors.
We believe a non-GAAP measure, such as Adjusted Earnings, that adjusts for the items discussed above is and has been a meaningful indicator of our economic performance in any one period and is useful to our investors as well as management in evaluating our performance, including as it relates to expected dividend payments over time. Additionally, we believe that our investors also use Adjusted Earnings, or a comparable supplemental performance measure, to evaluate and compare our performance to that of our peers, and as such, we believe that the disclosure of Adjusted Earnings is useful to our investors.
Certain of our equity method investments in renewable energy and energy efficiency projects are structured using typical partnership “flip” structures where the investors with cash distribution preferences receive a pre-negotiated return consisting of priority distributions from the project cash flows, in many cases, along with tax attributes. Tax equity investors typically realize a large portion of their return through an allocation of the majority of tax attributes, such as tax depreciation and tax credits, as such credits are realized by the project. Once this preferred return is achieved, the partnership “flips” and the common equity investor, often the operator or sponsor of the project, receives more of the cash flows through its equity interests while the previously preferred investors retain an ongoing residual interest. We have made investments in both the preferred and common equity of these structures. Given our equity method investments are in project companies, they typically have a finite expected life. We typically negotiate the purchase prices of our equity investments based on our underwritten project cash flows discounted back to a net present value, based on a target investment rate, with the cash flows to be received in the future reflecting both a return on the capital (at the investment rate) and a return of the capital we have committed to the project. We use a similar approach in the underwriting of our receivables.
Under GAAP, we account for these equity method investments utilizing the HLBV method. Under this method, we recognize income or loss based on the change in the amount each partner would receive if the assets were liquidated at book value, after adjusting for any distributions or contributions made during such quarter. The amount received in a liquidation is typically based on the negotiated profit and loss allocation, which may differ from the allocation of distributable cash in any given period. The amount allocated to a tax equity investor during the hypothetical liquidation is typically reduced over time as tax attributes are allocated to them and they achieve portions of their preferred return. Accordingly, tax equity investors are allocated losses as they receive tax benefits, while the sponsors of the project and other investors subordinate to tax equity are allocated gains of a similar amount. Tax equity investors can generally elect either investment tax credits or production tax credits, which are each recognized over different time periods. This results in different HLBV income profiles despite the fact that cash allocations are typically not directly impacted by such a tax credit election. In addition, the agreed upon allocations of the project’s cash flows may differ materially from the profit and loss allocation used for the HLBV calculations in a given period.
The application of the HLBV method described above results in GAAP income or loss in any one period that is often significantly different from the economic returns achieved from the investment in any one period as a result of the impact of tax allocations, the high levels of depreciation and other non-cash expenses that are common to renewable energy projects and the differences between the agreed upon profit and loss and the cash flow allocations. Thus, in calculating Adjusted Earnings, we adjust GAAP net income (loss) for certain of our investments where there are characteristics as described above to take into account our calculation of the return on capital (based upon the underwritten investment rate), as adjusted to reflect the performance of the project and the cash distributed. In calculating the underwritten investment rate, we make certain assumptions, including the timing and amounts of cash flows generated by our investments, which may differ from actual results, and may update this yield to reflect our most current estimates of project performance. We believe this equity method investment adjustment to our GAAP net income (loss) in calculating our Adjusted Earnings measure is an important
- 44 -
supplement to the income (loss) from equity method investments as determined under GAAP that helps investors understand the economic performance of these investments where HLBV income can differ substantially from the economic returns in any one period.
We have acquired equity investments in portfolios of projects which have the majority of the distributions payable to more senior investors in the first few years of the project. The following table provides results related to our equity method investments for the three months ended March 31, 2026 and 2025.
| Three months ended March 31, | |||||||||||
| 2026 | 2025 | ||||||||||
| (in millions) | |||||||||||
| Income (loss) under GAAP | $ | (79) | $ | 88 | |||||||
Collections of Adjusted Earnings | $ | 35 | $ | 20 | |||||||
| Return of Capital | 30 | 6 | |||||||||
| Cash collected | $ | 65 | $ | 26 | |||||||
Adjusted Earnings does not represent cash generated from operating activities in accordance with GAAP and should not be considered as an alternative to net income (determined in accordance with GAAP), or an indication of our cash flow from operating activities (determined in accordance with GAAP), or a measure of our liquidity, or an indication of funds available to fund our cash needs, including our ability to make cash distributions. In addition, our methodology for calculating Adjusted Earnings may differ from the methodologies employed by other companies to calculate the same or similar supplemental performance measures, and accordingly, our reported Adjusted Earnings may not be comparable to similar metrics reported by other companies.
The table below provides a reconciliation of our GAAP net income (loss) to Adjusted Earnings for the three months ended March 31, 2026 and 2025.
| Three Months Ended March 31, | |||||||||||||||||||||||
| 2026 | 2025 | ||||||||||||||||||||||
| $ | Per Share | $ | Per Share | ||||||||||||||||||||
| (dollars in thousands, except per share amounts) | |||||||||||||||||||||||
Net income (loss) attributable to controlling stockholders (1) | $ | (71,965) | $ | (0.57) | $ | 56,612 | $ | 0.44 | |||||||||||||||
| Adjustments: | |||||||||||||||||||||||
Reverse GAAP (income) loss from equity method investments | 79,258 | (87,989) | |||||||||||||||||||||
Adjusted income from equity method investments (2) | 91,103 | 69,863 | |||||||||||||||||||||
Elimination of proportionate share of up-front origination fees earned from co-investment structures (3) | (1,956) | (1,953) | |||||||||||||||||||||
Elimination of proportionate share of ongoing asset management fees earned from co-investment structures (4) | (1,887) | (750) | |||||||||||||||||||||
| Equity-based expenses | 17,814 | 12,678 | |||||||||||||||||||||
Provision for loss on receivables | 4,541 | 3,812 | |||||||||||||||||||||
Loss (gain) on debt modification or extinguishment (5) | 18,818 | 321 | |||||||||||||||||||||
Amortization of intangibles | 3 | 2 | |||||||||||||||||||||
Non-cash provision (benefit) for income taxes (6) | (32,205) | 23,898 | |||||||||||||||||||||
Current year earnings attributable to non-controlling interest | (1,777) | 1,573 | |||||||||||||||||||||
Adjusted Earnings | $ | 101,747 | $ | 0.77 | $ | 78,067 | $ | 0.64 | |||||||||||||||
Shares for Adjusted Earnings per share (7) | 131,510,437 | 122,613,563 | |||||||||||||||||||||
(1)The per share data reflects the GAAP diluted earnings per share which is the most comparable GAAP measure to our Adjusted Earnings per share.
(2)This is a non-GAAP adjustment to reflect the return on capital of our equity method investments as described above.
(3)This adjustment is to eliminate the intercompany portion of up-front origination fees received from co-investment structures that for GAAP net income is included in the Equity method income line item. Since we remove GAAP Equity method income for purposes of our Adjusted Earnings metric, we add back the elimination through this adjustment.
- 45 -
(4)This adjustment is to eliminate the intercompany portion of ongoing asset management received from co-investment structures that for GAAP net income is included in the Equity method income line item. Since we remove GAAP Equity method income for purposes of our Adjusted Earnings metric, we add back the elimination through this adjustment.
(5)Included in Interest expense within our statements of operations.
(6)Includes impact of cash paid for state income taxes during the three months ended March 31, 2026.
(7)Shares used to calculate Adjusted Earnings per share represents the weighted average number of shares outstanding including our issued unrestricted common shares, restricted stock awards, restricted stock units, long-term incentive plan units, and the non-controlling interest in our Operating Partnership. We include any potential common stock issuances related to share based compensation units in the amount we believe is reasonably certain to vest. As it relates to Convertible Notes, we assess whether the instrument is more akin to debt or equity based on the value of the underlying shares compared to the conversion price during each period. If the instrument is determined to be more debt-like then we will include any related interest expense and exclude the underlying shares issuable upon conversion of the instrument. If the instrument is determined to be more equity-like and is more dilutive when treated as equity then we will exclude any related interest expense and include the weighted average shares underlying the instrument. We will consider the impact of any capped calls we hold in assessing whether an instrument is equity-like or debt-like.
Adjusted Recurring Net Investment Income
We have a Portfolio of investments that we finance using a combination of debt and equity, and we also generate recurring income from our retained interests in securitization trusts and from ongoing management fees from our securitization trusts and our co-investment vehicle. We calculate Adjusted Recurring Net Investment Income as shown in the table below by adjusting GAAP-based net investment income for those earnings adjustments that are applicable to Adjusted Recurring Net Investment Income. We believe that this measure is useful to investors as it shows the recurring income generated by our Portfolio after the associated interest cost of debt financing and from our asset management activities. Our management also uses Adjusted Recurring Net Investment Income in this way. Our non-GAAP Adjusted Recurring Net Investment Income measure may not be comparable to similarly titled measures used by other companies. This measure also differs from our previously reported “Adjusted Net Investment Income”, as Adjusted Net Investment Income did not include Management fees and retained interest income. For further information on the adjustments between GAAP-based net investment income and Adjusted Recurring Net Investment Income, including information about our equity method investments, see the discussion above related to Adjusted Earnings.
The following is a reconciliation of our GAAP-based net investment income to our Adjusted Recurring Net Investment Income for the three months ended March 31, 2026 and 2025:
| Three Months Ended March 31, | |||||||||||
| 2026 | 2025 | ||||||||||
| (in thousands) | |||||||||||
Interest and rental income | $ | 82,689 | $ | 66,477 | |||||||
Management fees and retained interest income | 9,731 | 6,999 | |||||||||
| Interest expense | (99,275) | (64,677) | |||||||||
GAAP-based net investment income (loss) (1) | (6,855) | 8,799 | |||||||||
Adjusted income from equity method investments (2) | 91,103 | 69,863 | |||||||||
Loss (gain) on debt modification or extinguishment (3) | 18,818 | 321 | |||||||||
| Amortization of real estate intangibles | 3 | 2 | |||||||||
Elimination of proportionate share of ongoing asset management fees earned from co-investment structures (4) | (1,887) | (750) | |||||||||
Adjusted Recurring Net Investment Income | $ | 101,182 | $ | 78,235 | |||||||
(1)GAAP-based net investment income (loss) as reported in previous periods was not defined to include Management fees and retained interest income. It has been included here in comparative periods to reflect the new definition.
(2)This is a non-GAAP adjustment to reflect the return on capital of our equity method investments as described above.
(3)Included in Interest expense within our statements of operations.
(4)GAAP net income includes an elimination of the intercompany portion of ongoing asset management fees received from co-investment structures in the Equity method income line item. Since GAAP Equity method income is not a component of this metric, we include the elimination of the management fee through this adjustment.
- 46 -
Managed Assets
We consolidate assets on our balance sheet, securitize assets off-balance sheet, and manage assets in which we coinvest with other parties via equity method investments. Therefore, certain of our receivables and other assets are not reflected on our balance sheet where we may have a residual interest in the performance of the investment, such as a retained interest in cash flows. Thus, we present our investments on a non-GAAP “Managed Assets” basis. We believe that our Managed Asset information is useful to investors because it portrays the amount of both on- and off-balance sheet assets that we manage, which enables investors to understand and evaluate the credit performance associated with our portfolio of receivables, equity investments and residual assets in off-balance sheet assets. Our management also uses Managed Assets in this way. Our non-GAAP Managed Assets measure may not be comparable to similarly titled measures used by other companies.
The following is a reconciliation of our GAAP-based Portfolio to our Managed Assets as of March 31, 2026 and December 31, 2025:
| As of | |||||||||||
| March 31, 2026 | December 31, 2025 | ||||||||||
| (in millions) | |||||||||||
| Equity method investments | $ | 4,254 | $ | 4,116 | |||||||
| Receivables, net of allowance | 3,252 | 3,280 | |||||||||
| Receivables held-for sale | 36 | 114 | |||||||||
Real estate and debt securities | 76 | 76 | |||||||||
| GAAP-based Portfolio | 7,618 | 7,586 | |||||||||
| Assets held in securitization trusts | 7,326 | 7,220 | |||||||||
Fee generating assets held in co-investment structures (1) | 1,136 | 951 | |||||||||
Non-fee generating assets held in co-investment structures (2) | 316 | 314 | |||||||||
| Managed Assets | $ | 16,396 | $ | 16,071 | |||||||
(1)Represents assets in our co-investment structures which are attributable to our co-investors and on which we earn an asset management fee. Total assets in co-investment structures are $2.3 billion and $1.9 billion as of March 31, 2026 and December 31, 2025, respectively. There are $1.5 billion of closed transactions which have not yet funded as of March 31, 2026.
(2)Represents assets in our co-investment structures which are not attributable to our co-investors, and therefore are not fee-generating. Such assets are attributable to us but were financed with debt issued by the co-investment structure and therefore are not reflected in the carrying value of the equity method investment we hold in the structure.
The following shows our Managed Assets by asset class as of March 31, 2026:
- 47 -
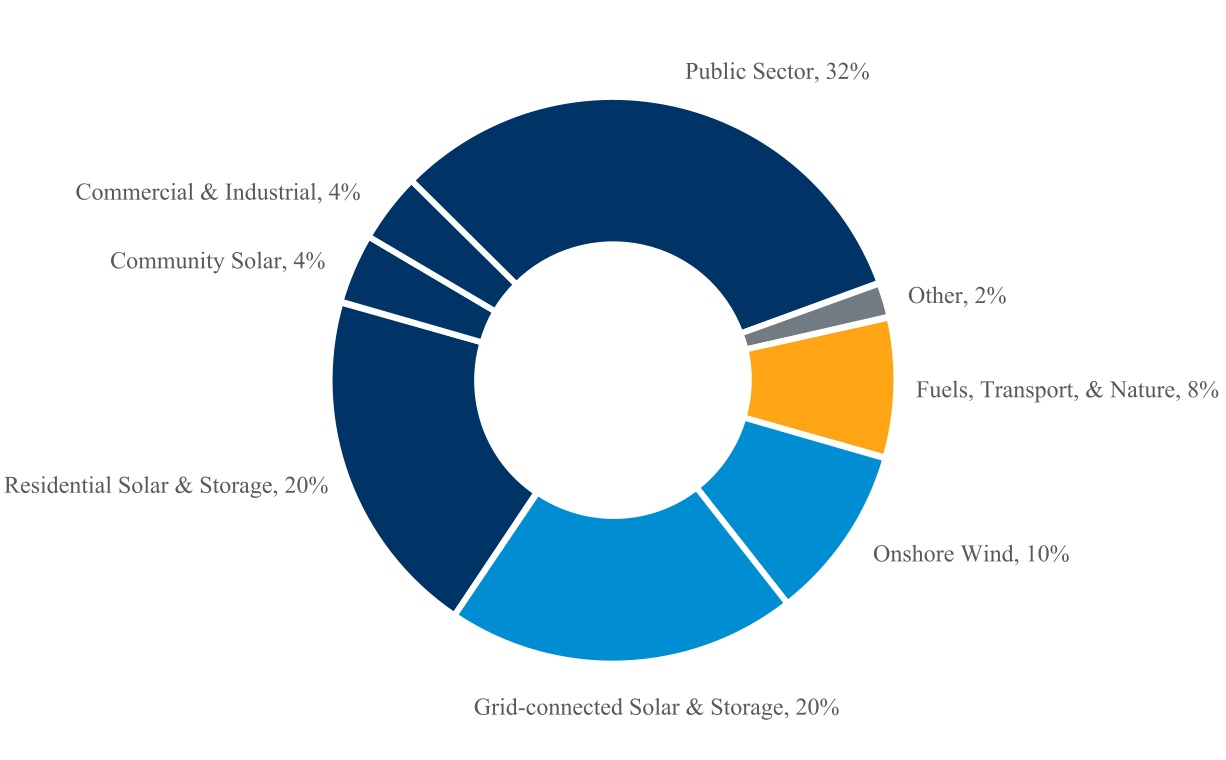
Adjusted Cash from Operations plus Other Portfolio Collections
We operate our business in a manner that considers total cash collected from our Portfolio, after making necessary operating and debt service payments to assess the amount of cash we have available to fund dividends and investments. We believe that the aggregate of these items, which together we present as a non-GAAP financial measure titled Adjusted Cash from Operations plus Other Portfolio Collections, is a useful measure of the liquidity generated from our assets to fund both new investments and our regular quarterly dividends. This non-GAAP financial measure may not be comparable to similarly titled or other similar measures used by other companies. Although there is also not a directly comparable GAAP measure that demonstrates how we consider cash available for dividend payment and reinvestment, below is a reconciliation of this measure to Net cash provided by operating activities.
Adjusted Cash from Operations plus Other Portfolio Collections also differs from Net cash provided by (used in) investing activities in that it excludes many of the uses of cash used in our investing activities such as Equity method investments, Purchases of and investments in receivables, Purchases of debt securities, and Collateral provided to and received from hedge counterparties. In addition, Adjusted Cash from Operations plus Other Portfolio Collections is not comparable to Net cash provided by (used in) financing activities in that it excludes many of our financing activities such as proceeds from common stock issuances and borrowings and repayments of unsecured debt. We evaluate Adjusted Cash from Operations plus Other Portfolio Collections on a trailing twelve month (“TTM”) basis, as cash collections during any one quarter may not be comparable to other single quarters due to, among other reasons, the seasonality of projects operations and the timing of disbursement and payment dates. Cash Available for Reinvestment is a non-GAAP measure which is calculated as Adjusted Cash from Operations Plus Other Portfolio Collections less dividend and distribution payments made during the period. We believe Cash Available for Reinvestment is useful as a measure of our ability to make incremental investments from internally generated capital after factoring in all necessary cash outflows to operate the business. Management uses Cash Available for Reinvestment in this way, and we believe that our investors use it in a similar fashion.
| Plus: | Less: | ||||||||||||||||||||||||||||
| For the year ended, | For the year ended, | For the three months ended, | For the three months ended, | For the TTM ended, | |||||||||||||||||||||||||
| December 31, 2024 | December 31, 2025 | March 31, 2026 | March 31, 2025 | March 31, 2026 | |||||||||||||||||||||||||
- 48 -
| (in thousands) | |||||||||||||||||||||||||||||
| Net cash provided by operating activities | $ | 5,852 | $ | 167,317 | $ | 15,614 | $ | (37,121) | $ | 220,052 | |||||||||||||||||||
| Changes in receivables held-for-sale | 29,273 | 23,759 | (27,350) | 23,719 | (27,310) | ||||||||||||||||||||||||
Equity method investment distributions received (1) | 39,142 | 59,416 | 6,205 | 7,642 | 57,979 | ||||||||||||||||||||||||
| Proceeds from sales of equity method investments | 9,472 | — | — | — | — | ||||||||||||||||||||||||
| Principal collections from receivables | 600,652 | 705,675 | 244,291 | 40,455 | 909,511 | ||||||||||||||||||||||||
| Proceeds from sales of receivables | 171,991 | 8,344 | — | 8,344 | — | ||||||||||||||||||||||||
| Proceeds from sales of land | 115,767 | — | — | — | — | ||||||||||||||||||||||||
Principal collections from debt securities (2) | 47 | 1,849 | 250 | 4 | 2,095 | ||||||||||||||||||||||||
Proceeds from the sale of a previously consolidated VIE (2) | 5,478 | — | — | — | — | ||||||||||||||||||||||||
| Proceeds from sales of debt securities and retained interests in securitization trusts | 5,390 | — | — | — | — | ||||||||||||||||||||||||
| Principal payments on non-recourse debt | (72,989) | (7,136) | (4,426) | (4,348) | (7,214) | ||||||||||||||||||||||||
| Adjusted Cash from Operations plus Other Portfolio Collections | 910,075 | 959,224 | 234,584 | 38,695 | 1,155,113 | ||||||||||||||||||||||||
Less: Dividends and distributions | (192,269) | (209,776) | (56,817) | (50,397) | (216,196) | ||||||||||||||||||||||||
| Cash Available for Reinvestment | $ | 717,806 | $ | 749,448 | $ | 177,767 | $ | (11,702) | $ | 938,917 | |||||||||||||||||||
(1) Represents return of capital distributions from our equity method investments included in cash provided by (used in) investing activities section of our statements of cash flows which is incremental to any equity method investment distributions found in net cash provided by operating activities. | |||||||||||||||||||||||||||||
| (2) Included in Other in the cash provided (used in) investing activities section of our statement of cash flows. | |||||||||||||||||||||||||||||
| Plus: | Less: | ||||||||||||||||||||||||||||
| For the year ended, | For the year ended, | For the three months ended, | For the three months ended, | For the TTM ended, | |||||||||||||||||||||||||
| December 31, 2024 | December 31, 2025 | March 31, 2026 | March 31, 2025 | March 31, 2026 | |||||||||||||||||||||||||
| (in thousands) | |||||||||||||||||||||||||||||
| Components of Adjusted Cash from Operations plus Other Portfolio Collections: | |||||||||||||||||||||||||||||
| Cash collected from our Portfolio | 891,250 | 1,199,907 | 368,657 | 111,249 | 1,457,315 | ||||||||||||||||||||||||
Cash collected from sale of assets (1) | 325,051 | 33,389 | 5,762 | 21,665 | 17,486 | ||||||||||||||||||||||||
| Cash used for compensation and benefit expenses and general and administrative expenses | (85,519) | (89,088) | (44,427) | (36,294) | (97,221) | ||||||||||||||||||||||||
Interest paid (2) | (172,679) | (227,867) | (101,023) | (61,963) | (266,927) | ||||||||||||||||||||||||
| Management fees and retained interest income and origination fees and other income | 33,044 | 50,170 | 14,163 | 9,474 | 54,859 | ||||||||||||||||||||||||
| Principal payments on non-recourse debt | (72,989) | (7,136) | (4,426) | (4,348) | (7,214) | ||||||||||||||||||||||||
| Other | (8,083) | (151) | (4,122) | (1,088) | (3,185) | ||||||||||||||||||||||||
- 49 -
| Adjusted Cash from Operations plus Other Portfolio Collections | $ | 910,075 | $ | 959,224 | $ | 234,584 | $ | 38,695 | $ | 1,155,113 | |||||||||||||||||||
(1) Includes cash from the sale of assets on our balance sheet as well as securitization transactions.
(2) Amounts include the impact of cash settlements from derivatives which were designated as cash flow hedges.
Adjusted Return on Equity
Adjusted Return on Equity is a measure of the economic performance of our invested equity capital. Adjusted Return on Equity is calculated as our Adjusted Earnings divided by our average stockholder’s equity for the period, expressed on an annualized basis. The direct comparable GAAP measure is GAAP-based return on equity, which we have presented below. Adjusted Return on Equity differs from GAAP-based return on equity in that the numerator of the calculation contains those adjustments described in the Adjusted Earnings section above. We believe that Adjusted Return on Equity gives investors an understanding into our performance after considering the effects of financial leverage. Our management uses it in this way and we believe that our investors use it in a similar fashion, and as such, we believe that its disclosure is useful to our investors.
| Three months ended | |||||||||||
| March 31, 2026 | March 31, 2025 | ||||||||||
(in thousands) | |||||||||||
GAAP Net Income | $ | (73,742) | $ | 58,185 | |||||||
Average Stockholders’ Equity (1) | 2,596,342 | 2,437,910 | |||||||||
GAAP-based Return on Equity | (11.4) | % | 9.5 | % | |||||||
Adjusted Earnings | $ | 101,747 | $ | 78,067 | |||||||
Average Stockholders’ Equity (1) | 2,596,342 | 2,437,910 | |||||||||
Adjusted Return on Equity | 15.7 | % | 12.8 | % | |||||||
(1) Average Stockholders’ Equity is calculated as the average of the Stockholders’ Equity at the beginning and end of each quarterly period.
Other Metrics
Portfolio Yield
We calculate Portfolio Yield as the weighted average underwritten yield of the investments in our Portfolio as of the end of the period. Underwritten yield is the rate at which we discount the expected cash flows from the assets in our Portfolio to determine our purchase price. In calculating an investment’s underwritten yield, we make certain assumptions, including the timing and amounts of cash flows generated by our investments, which may differ from actual results, and may update this yield to reflect our most current estimates of project performance. We believe that Portfolio Yield provides an additional metric to understand certain characteristics of our Portfolio as of a point in time. Our management uses Portfolio Yield this way and we believe that our investors use it in a similar fashion to evaluate certain characteristics of our Portfolio compared to our peers, and as such, we believe that the disclosure of Portfolio Yield is useful to our investors. Our Portfolio Yield measure may not be comparable to similarly titled measures used by other companies.
Our Portfolio totaled approximately $7.6 billion as of March 31, 2026. Unlevered Portfolio Yield was 9.2% as of March 31, 2026 and 8.8% as of December 31, 2025. See Note 6 to our financial statements and “MD&A—Our Business” in this Form 10-Q for additional discussion of the characteristics of our Portfolio as of March 31, 2026.
- 50 -
Average Annual Realized Loss on Managed Assets
Average Annual Realized Loss on Managed Assets represents the average annual rate of our incurred losses, calculated as the amount of realized losses incurred in each year as a percentage of each year’s average annual Managed Assets. This metric is calculated over the ten-year period ending March 31, 2026. Incurred losses include both realized losses on equity method investments and realized credit losses on receivables and debt securities. Although there is not a direct comparable GAAP measure, we have presented average annual recognized loss on Managed Assets as calculated under GAAP for comparison. Average Annual Realized Loss on Managed Assets differs from average annual recognized loss on Managed Assets as calculated under GAAP as the timing is based on realization of loss rather than GAAP recognition. We believe that Average Annual Realized Loss on Managed Assets provides an additional metric to our underwriting quality over our history of investing in energy transition assets and infrastructure. Our management uses it in this way and we believe that our investors use it in a similar fashion to evaluate our investment performance, and as such, we believe that its disclosure is useful to our investors. The table below shows these metrics as of March 31, 2026 is:
Average Annual Recognized Loss (GAAP) on Managed Assets | 0.13 | % | |||
Average Annual Realized Loss on Managed Assets | 0.08 | % | |||
Liquidity and Capital Resources
Liquidity is a measure of our available cash and committed short term borrowing capacity. We carefully manage and forecast our liquidity sources and uses on a frequent basis. Our sources of liquidity typically include collections from our Portfolio, cash proceeds from asset sales and securitizations, fee revenue, proceeds from debt transactions, and proceeds from equity transactions. Our uses of liquidity typically include funding investments, operating expenses (including cash compensation), interest and principal payments on our debt, and stockholder dividends and limited partner distributions.
We typically pay our operating expenses, our debt service, and dividends from collections on our Portfolio, fee income and proceeds from sales of Portfolio investments. We use borrowings as part of our financing strategy to increase potential returns to our stockholders and we have available to us a broad range of financing sources, including secured or unsecured debt, equity and off-balance sheet securitization or co-investment structures.
We maintain sufficiently available liquidity in the form of unrestricted cash and immediately available capacity on our credit facilities to manage our net cash flow. Below is a summary of our available liquidity by source:
| As of March 31, 2026 | ||||||||
| (in millions) | ||||||||
| Unrestricted cash | $ | 124 | ||||||
Unused capacity under our unsecured revolving credit facility (1) | 1,816 | |||||||
Unused capacity under our delayed draw term loan (2) | 250 | |||||||
Unused capacity under our Credit-enhanced Commercial Paper Program | 125 | |||||||
| Total liquidity | $ | 2,315 | ||||||
(1) As a credit enhancement for our Standalone Commercial Paper Notes, we reserve capacity under our unsecured revolving credit facility for the principal amount of any outstanding Standalone Commercial Paper Notes, if any. As of March 31, 2026, we had no outstanding Standalone Commercial Paper Notes.
(2) Amounts are available to be drawn through the earlier of June 15, 2026 or the date when the full principal amount is drawn. Drawn loans, if any, mature on June 15, 2028. The facility has a commitment fee during the availability period, and bears interest at a rate of SOFR or alternative base rate plus applicable margins based on our current credit rating. The current applicable margins are 1.650% for SOFR-based loans and 0.650% for alternative base rate-based loans.
Capital markets activity during the three months ended March 31, 2026
During the three months ended March 31, 2026, we issued $600 million principal amount of Junior Subordinated Notes due November 2056 and $400 million principal amount of Senior Notes due 2036. We used a portion of the proceeds of these issuances to redeem the outstanding $450 million principal amount of our 8.00% Senior Notes due 2027, with the remaining proceeds used to temporarily pay down short-term borrowings and ultimately invest in Portfolio assets. We did not issue any equity during the three months ended March 31, 2026.
As discussed in Note 6 to our financial statements in this Form 10-Q, we have an active co-investment vehicle with KKR called CarbonCount Holdings 1, LLC (“CCH1”), under which we each had committed to invest $1.5 billion in eligible projects over an investment period concluding in December 2027.
- 51 -
Maturities of recourse debt obligations
In addition to general operational obligations, which are typically paid as incurred, and dividends and distributions, which are declared by our board of directors quarterly, we have potential future cash needs related to the payments due at maturity of our Commercial Paper Notes, Senior Notes, Junior Subordinated Notes, Convertible Notes and Term Loan facilities. We also have maturities related to our non-recourse debt. However, as it relates to the non-recourse debt, to the extent there are not sufficient cash flows received from investments pledged as collateral for such debt, the investor has no recourse against other corporate assets to recover any shortfalls and corporate cash contributions would not be required. As it relates to the Convertible Notes, those obligations may be settled at maturity with cash, or with the issuance of shares to the extent that the market price of our common stock exceeds the strike price on our Convertible Notes. For further information on our long-term debt, see Note 8 to our financial statements of this Form 10-Q.
The maturity profile of our long-term recourse debt obligations as of March 31, 2026, is shown in the table below.
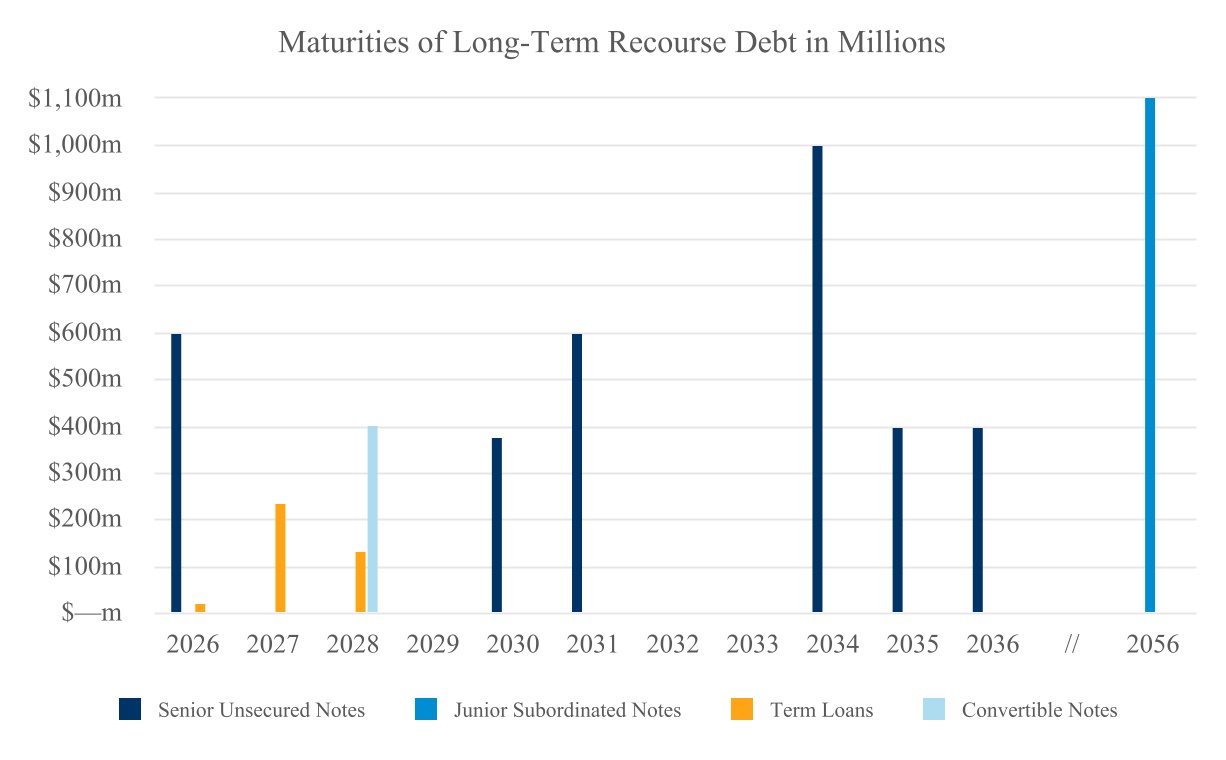
Additional borrowings and financial leverage management
As a means of financing our business, we plan to continue to issue debt which may be either secured or unsecured and either fixed-rate or floating-rate, and may issue additional equity. We also expect to use both on-balance sheet and off-balance sheet securitizations. We also use separately funded special purpose entities or co-investment vehicles to allow us to expand the investments that we make or to manage Portfolio diversification.
The decision as to how we finance specific assets or groups of assets is largely driven by risk, portfolio, and financial management considerations, including the potential for gain on sale or fee income, the overall interest rate environment including prevailing credit spreads, the terms of available financing, and financial market conditions. During periods of market disruptions, certain sources of financing may be more readily accessible than others which may impact our financing decisions. Over time, as market conditions change, we may use other forms of debt and equity in addition to these financing arrangements.
The amount of financial leverage we may use will depend upon our target capital structure and the availability of particular types of financing and our assessment of the credit, liquidity, price volatility and other risks of such assets, and the interest rate environment. As shown in the table below, our debt to equity ratio was approximately 1.6 to 1 as of March 31, 2026, within our target operating range of between 1.5 to 1 and 2.0 to 1, and below our current board-approved leverage limit of up to 2.5 to 1. Our debt to equity ratio reflects 50% of our outstanding principal amount of Junior Subordinated Notes as equity as consistent with the treatment by rating agencies and as approved by our board. Our percentage of fixed rate debt including the impact of our interest rate derivatives was approximately 100% as of March 31, 2026, which is within our targeted fixed rate debt percentage range of 75% to 100%. Our targeted fixed rate debt range allows for percentages as low as 70% on a short term basis if we intend to repay or swap floating rate borrowings in the near term.
- 52 -
The calculation of our fixed-rate debt and financial leverage as of March 31, 2026 and December 31, 2025 is shown in the chart below:
| March 31, 2026 | % of Total | December 31, 2025 | % of Total | ||||||||||||||||||||
| (dollars in millions) | (dollars in millions) | ||||||||||||||||||||||
Floating-rate borrowings (1) | $ | — | — | % | $ | 49 | 1 | % | |||||||||||||||
Fixed-rate debt (2) | 5,386 | 100 | % | 5,100 | 99 | % | |||||||||||||||||
| Total debt | $ | 5,386 | 100 | % | $ | 5,149 | 100 | % | |||||||||||||||
Debt for leverage calculation (3) | $ | 4,836 | $ | 4,899 | |||||||||||||||||||
Equity for leverage calculation (3) | $ | 3,085 | $ | 2,908 | |||||||||||||||||||
| Leverage | 1.6 to 1 | 1.7 to 1 | |||||||||||||||||||||
(1)Floating-rate borrowings include borrowings under our floating-rate credit facilities and commercial paper issuances with less than six months original maturity, to the extent such borrowings are not hedged using interest rate derivatives.
(2)Fixed-rate debt includes the impact of our interest rate derivatives on debt that is otherwise floating. Debt excludes securitizations that are not consolidated on our balance sheet. Since the borrowing rate associated with our junior subordinated notes is fixed for the first five years until which time we have the option to redeem them, we have included those notes as fixed-rate debt.
(3)Our leverage ratio includes the impact, as approved by our board of directors and as consistent with the methodologies of the credit rating agencies, of reflecting the principal amount of any Junior Subordinated Notes outstanding as being 50% equity.
We intend to use financial leverage for the primary purpose of financing our Portfolio and business activities and not for the purpose of speculating on changes in interest rates. While we may temporarily exceed the leverage limit, if our board of directors approves a material change to this limit, we anticipate advising our stockholders of this change through disclosure in our periodic reports and other filings under the Exchange Act.
While we generally intend to hold our target assets that we do not securitize upon acquisition as long term investments, certain of our investments may be sold in order to manage our interest rate risk and liquidity needs, to meet other operating objectives and to adapt to market conditions. The timing and impact of future sales of receivables, debt securities, or equity method investments, if any, cannot be predicted with any certainty.
We may, at any time and from time to time, seek to retire or purchase our outstanding debt through cash purchases and/or exchanges for equity or debt, in open-market purchases, privately negotiated transactions or otherwise. Such repurchases or exchanges, if any, will be upon such terms and at such prices as we may determine, and will depend on prevailing market conditions, our liquidity requirements, contractual restrictions and other factors. The amounts involved may be material.
We believe our identified sources of liquidity will be adequate for purposes of meeting our short-term and long-term liquidity needs, which include funding future investments, debt service, operating costs and distributions to our stockholders.
Sources and Uses of Cash
We had approximately $151 million and $145 million of unrestricted cash, cash equivalents, and restricted cash as of March 31, 2026 and December 31, 2025, respectively. The following table summarizes our cash flows for the three months ended March 31, 2026 and 2025. See our statements of cash flows for full details on the components of each category of cash flows. As discussed above, Adjusted Cash from Operations plus Other Portfolio Collections was $235 million for the three months ended March 31, 2026.
| For the three months ended, | ||||||||||||||
| March 31, 2026 | March 31, 2025 | |||||||||||||
| (in millions) | ||||||||||||||
| Cash provided by (used in) operating activities | $ | 16 | $ | (37) | ||||||||||
| Cash provided by (used in) investing activities | (184) | (324) | ||||||||||||
| Cash provided by (used in) financing activities | 174 | 294 | ||||||||||||
| Increase (decrease) in cash and cash equivalents | $ | 6 | $ | (67) | ||||||||||
- 53 -
Discussion of changes in cash provided by (used in) operating activities
Cash provided by (used in) operating activities for the three months ended March 31, 2026 was $53 million higher than the same period ended March 31, 2025. Net income was $132 million lower in the current period, and there was a greater adjustment to net income of $185 million when compared to the prior period. This increase in adjustment to net income includes $51 million greater cash received (paid) for held-for-sale receivables and $41 million more in equity method investment distributions which were classified as operating, which were offset partially by increased cash interest paid of $41 million.
Discussion of changes in cash provided by (used in) investing activities
Cash provided by (used in) investing activities for the three months ended March 31, 2026 was $140 million lower than the same period ended March 31, 2025. We collected $204 million more in principal from receivables in the current period, which was partially offset by $105 million additional invested in equity method investments and receivables. We also collected a $63 million reimbursement from a co-investor for CCH1 advances made by us on their behalf in December 2025.
Discussion of changes in cash provided by (used in) financing activities
Cash provided by (used in) financing activities for the three months ended March 31, 2026 was $120 million lower than the same period ended March 31, 2025. We had lower net borrowings from our revolving credit facility and commercial paper notes of $602 million compared to the prior period, while net proceeds from senior notes and junior subordinated notes were $549 million higher in the current period than in the prior period. We also issued $47 million in common stock in the prior period, which did not recur in the current period.
Supplemental Guarantor Information
The Company and each of Hannon Armstrong Sustainable Infrastructure, L.P., Hannon Armstrong Capital, LLC. HAC Holdings I LLC, HAC Holdings II LLC, HAT Holdings I LLC and HAT Holdings II LLC (the “Subsidiary Guarantors”) have filed registration statements with the SEC pursuant to which the Company has offered and may in the future offer and sell debt securities from time to time and such securities have been and may be guaranteed by the Subsidiary Guarantors. The Subsidiary Guarantors are consolidated in the Company’s Consolidated Financial Statements and separate Consolidated Financial Statements of the Subsidiary Guarantors have not been presented in accordance with Rule 3-10 of Regulation S-X. Furthermore, as permitted under Rule 13-01(a)(4)(vi), the Company has excluded the summarized financial information for the Subsidiary Guarantors as the assets, liabilities and results of operations of the Company and the Subsidiary Guarantors are not materially different than the corresponding amounts presented in the Consolidated Financial Statements of the Company, and management believes such summarized financial information would be repetitive and not provide incremental value to investors.
Off-Balance Sheet Arrangements
We have relationships with non-consolidated entities or financial partnerships, often referred to as structured investment vehicles, special purpose entities, or variable interest entities, established to facilitate the sale of securitized assets. We have retained interests in securitization trusts (including any outstanding servicer advances) of approximately $339 million as of March 31, 2026, that may be at risk in the event of defaults or prepayments in our securitization trusts and certain limited guarantees as discussed below. We have not guaranteed any obligations of non-consolidated entities or entered into any commitment or intent to provide additional funding to any such entities except as disclosed in Note 9 to our financial statements in this Form 10-Q. A more detailed description of our relations with non-consolidated entities can be found in Note 2 to our financial statements in this Form 10-Q. Additionally, we have made certain loans to equity method investees which we describe in Note 6 to our financial statements in this Form 10-Q.
In connection with some of our transactions, we have provided certain limited guarantees to other transaction participants covering the accuracy of certain limited representations, warranties or covenants and provided an indemnity against certain losses from “bad acts” including fraud, failure to disclose a material fact, theft, misappropriation, voluntary bankruptcy or unauthorized transfers. In some transactions, we have also guaranteed our compliance with certain tax matters, such as negatively impacting the investment tax credit and certain other obligations in the event of a change in ownership or our exercising certain protective rights.
- 54 -
Dividends
Any distributions we make will be at the discretion of our board of directors and will depend upon, among other things, our actual results of operations. These results and our ability to pay distributions will be affected by various factors, including the net interest and other income from our assets, our operating expenses and any other expenditures. In the event that our board of directors determines to make distributions in excess of the income or cash flow generated from our assets, we may make such distributions from the proceeds of future offerings of equity or debt securities or other forms of debt financing or the sale of assets.
The dividends declared in 2025 and 2026 are described in Note 11 to our financial statements in this Form 10-Q.
Book Value Considerations
As of March 31, 2026, we carried only our debt securities, our receivables held-for-sale for which we had elected the fair value option, if any, our retained interests in securitization trusts, and derivatives at fair value on our balance sheet. As a result, in reviewing our book value, there are a number of important factors and limitations to consider. Other than those assets listed above that are carried on our balance sheet at fair value as of March 31, 2026, the carrying value of our remaining assets and liabilities are typically determined using a cost basis approach in accordance with GAAP, adjusted for income or loss recognized on and cash collected from such assets. Other than the allowance for current expected credit losses applied to our receivables, our remaining assets and liabilities do not incorporate other factors that may have a significant impact on their value, most notably any impact of business activities, changes in estimates, or changes in general economic conditions, interest rates or commodity prices since the dates the assets or liabilities were initially recorded. Accordingly, our book value does not necessarily represent an estimate of our net realizable value, liquidation value or our fair market value.
Item 3. Quantitative and Qualitative Disclosures about Market Risk
We anticipate that our primary market risks will be related to the credit quality of our counterparties and project companies, market interest rates, the liquidity of our assets, commodity prices and environmental factors. We will seek to manage these risks while, at the same time, seeking to provide an opportunity to stockholders to realize attractive returns through ownership of our common stock.
Credit Risks
We source and identify quality opportunities within our broad areas of expertise and apply our rigorous underwriting processes to our transactions, which, we believe, will generally enable us to minimize our credit losses and maintain access to attractive financing. Through our investments in various projects, we will be exposed to the credit risk of the obligor of the project’s PPA or other long-term contractual revenue commitments, as well as to the credit risk of certain suppliers and project operators. We have invested in mezzanine loans and, as a result, we are exposed to additional credit risk. We are exposed to credit risk in our other projects that do not benefit from governments obligors such as on-balance sheet financing of projects undertaken by universities, schools and hospitals, as well as privately owned commercial projects. While we do not anticipate facing significant credit risk in our assets related to government energy efficiency projects, we are subject to varying degrees of credit risk in these projects in relation to guarantees provided by ESCOs where payments under energy savings performance contracts are contingent upon achieving pre-determined levels of energy savings. We seek to manage credit risk through thorough due diligence and underwriting processes, strong structural protections in our transaction agreements with customers and continual, active asset management and portfolio monitoring. Nevertheless, unanticipated credit losses could occur and during periods of economic downturn in the global economy, our exposure to credit risks from obligors increases, and our efforts to monitor and mitigate the associated risks may not be effective in reducing our credit risks.
We use a risk rating system to evaluate projects that we target. We first evaluate the credit rating of the off-takers or counterparties involved in the project using an average of the external credit ratings for an obligor, if available, or an estimated internal rating based on a third-party credit scoring system. We then estimate the probability of default and estimated recovery rate based on the obligors’ credit ratings and the terms of the contract. We also review the performance of each investment, including through, as appropriate, a review of project performance, monthly payment activity and active compliance monitoring, regular communications with project management and, as applicable, its obligors, sponsors and owners, monitoring the financial performance of the collateral, periodic property visits and monitoring cash management and reserve accounts. The results of our reviews are used to update the project’s risk rating as necessary. Additional detail of the credit risks surrounding our Portfolio can be found in Note 6 to our financial statements in this Form 10-Q.
Interest Rate and Borrowing Risks
Interest rate risk is highly sensitive to many factors, including governmental monetary and tax policies, domestic and international economic and political considerations and other factors beyond our control.
- 55 -
We are subject to interest rate risk in connection with new asset originations and our floating-rate borrowings, and in the future, any new floating rate assets, credit facilities or other borrowings. Because short-term borrowings are generally short-term commitments of capital, lenders may respond to market conditions, making it more difficult for us to secure continued financing. If we are not able to renew our then existing borrowings or arrange for new financing on terms acceptable to us, or if we default on our covenants or are otherwise unable to access funds under any of these borrowings, we may have to curtail our origination of new assets and/or dispose of assets. We face particular risk in this regard given that we expect many of our borrowings will have a shorter duration than the assets they finance. Increasing interest rates may reduce the demand for our investments while declining interest rates may increase the demand. Both our current and future revolving credit facilities and other borrowings may be of limited duration and are periodically refinanced at then current market rates. We attempt to reduce interest rate risks and to minimize exposure to interest rate fluctuations through the use of fixed rate financing structures, when appropriate, whereby we seek to (1) match the maturities of our debt obligations with the maturities of our assets, (2) borrow at fixed rates for a period of time or (3) match the interest rates on our assets with like-kind debt (i.e., we may finance floating rate assets with floating rate debt and fixed-rate assets with fixed-rate debt), directly or through the use of interest rate derivatives or other financial instruments, or through a combination of these strategies. We expect these instruments will allow us to minimize, but not eliminate, the risk that we must refinance our liabilities before the maturities of our assets and to reduce the impact of changing interest rates on our earnings. In addition to the use of traditional derivative instruments, we also seek to mitigate interest rate risk by using securitizations, syndications and other techniques to construct a portfolio with a staggered maturity profile. We monitor the impact of interest rate changes on the market for new originations and often have the flexibility to negotiate the terms of our investments to offset interest rate increases.
Typically, our long-term debt, or that of the projects in which we invest if applicable, is at fixed rates or may at times be fixed using interest rate hedges that convert most of the floating rate debt to fixed rate debt. If interest rates rise, and our fixed rate debt balance remains constant, we expect the fair value of our fixed rate debt to decrease and the value of our hedges, if any, on floating rate debt to increase. See Note 3 to our financial statements in this Form 10-Q for the estimated fair value of our fixed rate long-term debt, which is based on upon the terms of comparable debt that could have been borrowed at the date presented, at prevailing current market interest rates.
We have $5.4 billion of debt with either fixed rates or which we have hedged pursuant to strategies described above to hedge floating rate debt. We have no debt outstanding as of March 31, 2026 with unhedged variable interest rates. Accordingly, an increase in benchmark interest rates would not increase the quarterly interest expense related to our variable rate borrowings. Such hypothetical impact of interest rates on our variable-rate borrowings does not consider the effect of any change in overall economic activity that could occur in a rising interest rate environment. Further, in the event of such a change in interest rates, we may take actions to further mitigate our exposure to such a change. However, due to the uncertainty of the specific actions that would be taken and their possible effects, the analysis assumes no changes in our financial structure.
We record certain of our assets at fair value in our financial statements and any changes in the discount rate would impact the value of these assets. See Note 3 to our financial statements in this Form 10-Q.
Liquidity and Concentration Risk
The assets that comprise our Portfolio are not and are not expected to be publicly traded. A portion of these assets may be subject to legal and other restrictions on resale or will otherwise be less liquid than publicly-traded securities. The illiquidity of our assets may make it difficult for us to sell such assets if the need or desire arises, including in response to changes in economic and other conditions. Many of our assets, or the collateral supporting those assets, are concentrated in certain geographic areas and markets, which may make those assets or the related collateral more susceptible to market or environmental disruptions. As it relates to environmental risks, when we underwrite and structure our investments the environmental risks and opportunities are an integral consideration to our investment parameters See also “Credit Risks” discussed above.
Commodity and Environmental Attribute Price Risk
When we make equity or debt investments in an energy transition project that acts as a substitute for an underlying commodity, we may be exposed to volatility in prices for that commodity. The performance of renewable energy projects that produce electricity or natural gas can be impacted by volatility in the market prices of various forms of energy, including electricity, coal and natural gas. This is especially true for GC utility scale projects that sell power on a wholesale basis, as BTM projects compete against the retail or delivered costs of electricity which includes the cost of transmitting and distributing the electricity to the end user. Projects in which we invest, or in which we may plan to invest, may also be exposed to volatility in the prices of environmental attributes which the project may produce, such as renewable energy credits (“RECs”) or renewable identification numbers (“RINs”).
Although we generally focus on renewable energy projects that have the majority of their operating cash flow supported by long-term PPAs or leases, many of the projects in which we invest have shorter term contracts (which may have the potential of producing higher current returns) or sell their power, energy or environmental attributes in the open market on a merchant
- 56 -
basis. The cash flows of certain projects, and thus the repayment of, or the returns available for, our assets, are subject to risk if energy or environmental attribute prices change. We also attempt to mitigate our exposure through structural protections. These structural protections, which are typically in the form of a preferred return mechanism, are designed to allow recovery of our capital and an acceptable return over time. When structuring and underwriting these transactions, we evaluate these transactions using a variety of scenarios, including natural gas prices remaining low for an extended period of time. As energy or environmental attribute price volatility continues or as PPAs expire, the cash flows from certain of the projects in which we have invested are exposed to these market conditions. We work with the projects sponsors to minimize any impact as part of our on-going active asset management and portfolio monitoring. Certain of the projects in which we invest may also be obligated to physically deliver energy under PPAs or related agreements, and to the extent they are unable to do so may be negatively impacted. Certain PPAs or related agreements may also price power at a different location than the location where power is delivered to the grid, and the projects may be negatively impacted to the extent to which these prices differ. To the extent transmission and distribution infrastructure in geographies in which we invest is not able to accommodate additional power, additional renewable penetration from other new projects in certain geographic areas could decrease the revenues of our projects.
Risk Management
Our ongoing active asset management and portfolio monitoring processes provide investment oversight and valuable insight into our origination, underwriting and structuring processes. These processes create value through active monitoring of the state of our markets, enforcement of existing contracts and asset management. As described above, we engage in a variety of interest rate management techniques that seek to mitigate the economic effect of interest rate changes on the values of, and returns on, some of our assets. We seek to manage credit risk using thorough due diligence and underwriting processes, strong structural protections in our loan agreements with customers and continual, active asset management and portfolio monitoring. Additionally, we have a Finance and Risk Committee of our board of directors which discusses and reviews policies and guidelines with respect to our risk assessment and risk management for various risks, including, but not limited to, our interest rate, counter party, credit, capital availability, refinancing risks, and cybersecurity risks. As it relates to natural event risks, when we underwrite and structure our investments the environmental risks and opportunities are an integral consideration to our investment parameters. While we cannot fully protect our investments, we seek to mitigate these risks by using third-party experts to conduct engineering and weather analysis and insurance reviews as appropriate. Weather related risks are at times managed in cooperation with our clients where they buy offsetting power positions to mitigate power market disruptions or operational impacts. Once a transaction has closed we continue to monitor the environmental risks to the Portfolio.
Item 4. Controls and Procedures
The Company’s Chief Executive Officer and Chief Financial Officer, based on their evaluation of the Company’s disclosure controls and procedures (as defined in Rules 13a-15(e) and 15d-15(e) under the Exchange Act) required by paragraph (b) of Rule 13a-15 or Rule 15d-15, have concluded that as of March 31, 2026, the Company’s disclosure controls and procedures were effective to give reasonable assurances to the timely collection, evaluation and disclosure of information relating to the Company that would potentially be subject to disclosure under the Exchange Act and the rules and regulations promulgated thereunder.
Notwithstanding the foregoing, a control system, no matter how well designed and operated, can provide only reasonable, not absolute, assurance that it will detect or uncover failures within the Company to disclose material information otherwise required to be set forth in our periodic reports.
Changes in Internal Controls over Financial Reporting
There have been no changes in the Company’s “internal control over financial reporting” (as defined in Rule 13a-15(f) of the Exchange Act) that occurred during the three-month period ended March 31, 2026, that have materially affected, or were reasonably likely to materially affect, the Company’s internal control over financial reporting.
PART II. OTHER INFORMATION
Item 1. Legal Proceedings
From time to time, we may be involved in various claims and legal actions in the ordinary course of business. As of March 31, 2026, we are not currently subject to any legal proceedings that are likely to have a material adverse effect on our financial position, results of operations or cash flows.
Item 1A. Risk Factors
- 57 -
For a discussion of our potential risks and uncertainties, see the information in Item 1A. “Risk Factors” of our 2025 Form 10-K, filed with the SEC, which is accessible on the SEC’s website at www.sec.gov.
Item 2. Unregistered Sales of Equity Securities and Use of Proceeds
Purchases of Equity Securities by the Issuer and Affiliated Purchasers
During the three months ended March 31, 2026, certain of our employees surrendered common stock owned by them to satisfy their federal and state tax obligations associated with the vesting of their restricted stock awards.
The table below summarizes our repurchases of common stock during 2026. These repurchases are related to the surrender of common stock by certain of our employees to satisfy their tax and other compensation related withholdings associated with the vesting of restricted stock. The price paid per share is based on the closing price of our common stock as of the date of the withholding.
| Period | Total number of shares purchased | Average price per share | Total number of shares purchased as part of publicly announced plans or programs | Maximum number of shares that may yet be purchased under the plans or programs | ||||||||||||||||||||||
| 3/5/2026 | 55,916 | $ | 36.43 | N/A | N/A | |||||||||||||||||||||
There were no OP units held by our non-controlling interest holders exchanged for shares of our common stock during the three months ended March 31, 2026.
Item 3. Defaults Upon Senior Securities
None.
Item 4. Mine Safety Disclosures
Not applicable.
Item 5. Other Information
Effective May 11, 2026, Marc Pangburn will transition from his current role as Senior Managing Director & Chief Revenue and Strategy Officer, and a Company employee, to a Strategic Advisor (the “Transition”). In connection with the Transition, the Company and Mr. Pangburn have entered into a non-employee consulting agreement (the “Consulting Agreement”) pursuant to which Mr. Pangburn will provide strategic consulting services to the Company until March 5, 2028, subject to termination by either party. Under the terms of the Consulting Agreement, Mr. Pangburn will be eligible to earn fees on an hourly basis for services provided and certain of his existing unvested LTIP Units will continue to vest in accordance with their terms, subject to continued consulting services and his compliance with restrictive covenants. The LTIP Units granted to Mr. Pangburn in 2026 will be forfeited.
The foregoing summary of the Consulting Agreement does not purport to be complete and is qualified in its entirety by the terms of the Consulting Agreement and the amendments to the relevant equity award agreements, each of which will be filed as an exhibit to the Company’s next periodic report.
- 58 -
Item 6. Exhibits
| Exhibit number | Exhibit description | |||||||
| 3.1 | ||||||||
| 3.2 | ||||||||
| 4.1 | ||||||||
| 4.2 | ||||||||
| 4.3 | ||||||||
| 4.4 | ||||||||
| 4.5 | ||||||||
| 4.6 | ||||||||
| 4.7 | ||||||||
| 4.8 | ||||||||
| 4.9 | ||||||||
4.10 | ||||||||
4.11 | ||||||||
- 59 -
* Filed herewith.
** Furnished herewith.
- 60 -
SIGNATURES
Pursuant to the requirements of the Securities Exchange Act of 1934, as amended, the Registrant has duly caused this report to be signed on its behalf by the undersigned thereunto duly authorized.
HA SUSTAINABLE INFRASTRUCTURE CAPITAL, INC. (Registrant) | ||||||||||||||
| Date: May 8, 2026 | /s/ Jeffrey A. Lipson | |||||||||||||
| Jeffrey A. Lipson | ||||||||||||||
| Chief Executive Officer and President | ||||||||||||||
| Date: May 8, 2026 | /s/ Charles W. Melko | |||||||||||||
| Charles W. Melko | ||||||||||||||
Senior Managing Director, Chief Financial Officer, and Treasurer | ||||||||||||||
| Date: May 8, 2026 | /s/ Michelle E. Whicher | |||||||||||||
| Michelle E. Whicher | ||||||||||||||
Senior Managing Director and Chief Accounting Officer | ||||||||||||||
- 61 -