10-K: Annual report pursuant to Section 13 and 15(d)
Published on February 25, 2020
UNITED STATES
SECURITIES AND EXCHANGE COMMISSION
WASHINGTON, D.C. 20549
FORM 10-K
ANNUAL REPORT PURSUANT TO SECTION 13 OR 15(d) OF THE SECURITIES EXCHANGE ACT OF 1934 |
|
For the fiscal year ended December 31, 2019
OR
TRANSITION REPORT PURSUANT TO SECTION 13 OR 15(d) OF THE SECURITIES EXCHANGE ACT OF 1934 |
|
For the transition period from to
Commission File Number: 001-35877
HANNON ARMSTRONG SUSTAINABLE
INFRASTRUCTURE CAPITAL, INC.
(Exact name of registrant as specified in its charter)
|
(State or other jurisdiction of
incorporation or organization)
|
(I.R.S. Employer
Identification No.)
|
|
(Address of principal executive offices) |
(Zip Code) |
|
(410 ) 571-9860
(Registrant’s telephone number, including area code)
Securities registered pursuant to Section 12(b) of the Act:
Title of each class |
Trading Symbol(s) |
Name of each exchange on which registered |
Securities registered pursuant to Section 12(g) of the Act:
None
Indicate by check mark if the registrant is a well-known seasoned issuer, as defined in Rule 405 of the Securities Act. Yes ☒ No ☐
Indicate by check mark if the registrant is not required to file reports pursuant to Section 13 or Section 15(d) of the Exchange Act. Yes ☐ No ☒
Indicate by check mark whether the registrant (1) has filed all reports required to be filed by Section 13 or 15(d) of the Securities Exchange Act of 1934 during the preceding 12 months (or for such shorter period that the registrant was required to file such reports), and (2) has been subject to such filing requirements for the past 90 days. Yes ☒ No ☐
Indicate by check mark whether the registrant has submitted electronically every Interactive Data File required to be submitted pursuant to Rule 405 of Regulation S-T (§ 232.405 of this chapter) during the preceding 12 months (or for such shorter period that the registrant was required to submit such files). Yes ☒ No ☐
Indicate by check mark whether the registrant is a large accelerated filer, an accelerated filer, a non-accelerated filer, a smaller reporting company, or an emerging growth company. See the definitions of “large accelerated filer”, “accelerated filer,” “smaller reporting company” and “emerging growth company” in Rule 12b-2 of the Exchange Act.
☒ |
Accelerated filer |
☐ |
|
Non-accelerated filer |
☐
|
Smaller reporting company |
|
Emerging growth company |
|||
If an emerging growth company, indicate by check mark if the registrant has elected not to use the extended transition period for complying with any new or revised financial accounting standards provided pursuant to Section 13(a) of the Exchange Act. ☐
Indicate by check mark whether the registrant is a shell company (as defined in Rule 12b-2 of the Exchange Act). Yes ☐ No ☒
As of June 30, 2019, the aggregate market value of the registrant’s common stock (includes unvested restricted stock) held by non-affiliates of the registrant was $1.8 billion based on the closing sales price of the registrant’s common stock on June 30, 2019 as reported on the New York Stock Exchange.
On February 18, 2020, the registrant had a total of 67,088,363 shares of common stock, $0.01 par value, outstanding (which includes 750,242 shares of unvested restricted common stock).
DOCUMENTS INCORPORATED BY REFERENCE
Portions of the registrant’s proxy statement for the 2020 annual meeting of stockholders are incorporated by reference into Part III of this Annual Report on Form 10-K.
TABLE OF CONTENTS
Page |
||
Item 1. |
||
Item 1A. |
||
Item 1B. |
||
Item 2. |
||
Item 3. |
||
Item 4. |
||
Item 5. |
||
Item 6. |
||
Item 7. |
||
Item 7A. |
||
Item 8. |
||
Item 9. |
||
Item 9A. |
||
Item 9B. |
||
Item 10. |
||
Item 11. |
||
Item 12. |
||
Item 13. |
||
Item 14. |
||
Item 15. |
||
Item 16. |
||
- 2 -
FORWARD-LOOKING STATEMENTS
We make forward-looking statements in this Annual Report on Form 10-K (“Form 10-K”) within the meaning of Section 27A of the Securities Act of 1933, as amended (the “Securities Act”), and Section 21E of the Securities Exchange Act of 1934, as amended (the “Exchange Act”) that are subject to risks and uncertainties. For these statements, we claim the protections of the safe harbor for forward-looking statements contained in such Sections. These forward-looking statements include information about possible or assumed future results of our business, financial condition, liquidity, results of operations, plans and objectives. When we use the words “believe,” “expect,” “anticipate,” “estimate,” “plan,” “continue,” “intend,” “should,” “may” or similar expressions, we intend to identify forward-looking statements.
Forward-looking statements are subject to significant risks and uncertainties. Investors are cautioned against placing undue reliance on such statements. Actual results may differ materially from those set forth in the forward-looking statements. Statements regarding the following subjects, among others, may be forward-looking:
• |
our expected returns and performance of our investments; |
• |
the state of government legislation, regulation and policies that support or enhance the economic feasibility of projects that reduce carbon emissions or increase resilience to climate change, which we refer to as climate change solutions, including energy efficiency and renewable energy projects and the general market demands for such projects; |
• |
market trends in our industry, energy markets, commodity prices, interest rates, the debt and lending markets or the general economy; |
• |
our business and investment strategy; |
• |
availability of opportunities to invest in climate change solutions including energy efficiency and renewable energy projects and our ability to complete potential new opportunities in our pipeline; |
• |
our relationships with originators, investors, market intermediaries and professional advisers; |
• |
competition from other providers of capital; |
• |
our or any other company’s projected operating results; |
• |
actions and initiatives of the federal, state and local governments and changes to federal, state and local government policies, regulations, tax laws and rates and the execution and impact of these actions, initiatives and policies; |
• |
the state of the U.S. economy generally or in specific geographic regions, states or municipalities and economic trends; |
• |
our ability to obtain and maintain financing arrangements on favorable terms, including securitizations; |
• |
general volatility of the securities markets in which we participate; |
• |
changes in the value of our assets, our portfolio of assets and our investment and underwriting process; |
• |
the impact of weather conditions, natural disasters, accidents or equipment failures or other events that disrupt the operation of our investments or negatively impact the value our assets; |
• |
rates of default or decreased recovery rates on our assets; |
• |
interest rate and maturity mismatches between our assets and any borrowings used to fund such assets; |
• |
changes in interest rates and the market value of our assets and target assets; |
• |
changes in commodity prices, including continued low natural gas prices; |
• |
effects of hedging instruments on our assets or liabilities; |
• |
the degree to which our hedging strategies may or may not protect us from risks, such as interest rate volatility; |
• |
impact of and changes in accounting guidance; |
• |
our ability to maintain our qualification as a real estate investment trust (a “REIT”) for U.S. federal income tax purposes; |
• |
our ability to maintain our exemption from registration under the Investment Company Act of 1940, as amended (the “1940 Act”); |
• |
availability of and our ability to attract and retain qualified personnel; |
- 3 -
• |
estimates relating to our ability to generate sufficient cash in the future to operate our business and to make distributions to our stockholders; and |
• |
our understanding of our competition. |
Forward-looking statements are based on beliefs, assumptions and expectations as of the date of this Form 10-K. Any forward-looking statement speaks only as of the date on which it is made. New risks and uncertainties arise over time, and it is not possible for us to predict those events or how they may affect us. Except as required by law, we are not obligated to, and do not intend to, update or revise any forward-looking statements after the date of this Form 10-K, whether as a result of new information, future events or otherwise.
The risks included here are not exhaustive. Other sections of this Form 10-K may include additional factors that could adversely affect our business and financial performance. Moreover, we operate in a very competitive and rapidly changing environment. New risk factors emerge from time to time and it is not possible for management to predict all such risk factors, nor can it assess the impact of all such risk factors on our business or the extent to which any factor, or combination of factors, may cause actual results to differ materially from those contained in any forward-looking statements. Given these risks and uncertainties, investors should not place undue reliance on forward-looking statements as a prediction of actual results.
- 4 -
PART I
In this Form 10-K, unless specifically stated otherwise or the context otherwise indicates, references to “we,” “our,” “us” and “our company” refer to Hannon Armstrong Sustainable Infrastructure Capital, Inc., a Maryland corporation, Hannon Armstrong Sustainable Infrastructure, L.P. and any of our other subsidiaries. Hannon Armstrong Sustainable Infrastructure, L.P. is a Delaware limited partnership of which we are the sole general partner and to which we refer in this Form 10-K as our “Operating Partnership.” Our business is focused on reducing the impact of greenhouse gases that have been scientifically linked to climate change. We refer to these gases, which are often for consistency expressed as carbon dioxide equivalents, as carbon emissions.
Item 1. |
Business |
GENERAL
We make investments in climate change solutions by providing capital to leading companies in energy efficiency, renewable energy and other sustainable infrastructure markets. We believe that we are one of the first U.S. public companies solely dedicated to climate change investments. Our goal is to generate attractive returns from a diversified portfolio of projects with long-term, predictable cash flows from proven technologies that reduce carbon emissions or increase resilience to climate change.
We are internally managed, and our management team has extensive relevant industry knowledge and experience, dating back more than 30 years. We have long-standing relationships with the leading energy service companies (“ESCOs”), manufacturers, project developers, utilities, owners and operators. Our origination strategy is to use these relationships to generate recurring, programmatic investment and fee-generating opportunities. Additionally, we have relationships with leading banks, investment banks, and institutional investors from which we are referred additional investment and fee-generating opportunities.
We completed approximately $1.3 billion of transactions during 2019, compared to approximately $1.2 billion during 2018. As of December 31, 2019, we held approximately $2.1 billion of transactions on our balance sheet, which we refer to as our “Portfolio.” For those transactions that we choose not to hold on our balance sheet, we transfer all or a portion of the economics of the transaction, typically using securitization trusts, to institutional investors in exchange for a gain on the transfer and in some cases, ongoing fees. As of December 31, 2019, we managed approximately $4.1 billion in these trusts or vehicles that are not consolidated on our balance sheet. When combined with our Portfolio, as of December 31, 2019, we manage approximately $6.2 billion of assets, which we refer to as our “Managed Assets.”
Our investments have taken many forms, including equity, joint ventures, land ownership, lending, or other financing transactions. We also generate ongoing fees through gain-on-sale securitization transactions, services, and asset management. We use borrowings as part of our strategy to increase potential returns to our stockholders and have available a broad range of financing sources including non-recourse or recourse debt, equity, and off-balance sheet securitization structures. A further description of our financing activities can be found below.
We have a large and active pipeline of potential new opportunities that are in various stages of our underwriting process. We refer to potential opportunities as being part of our pipeline if we have determined that the project fits within our investment strategy and exhibits the appropriate risk and reward characteristics through an initial credit analysis, including a quantitative and qualitative assessment of the opportunity, as well as research on the relevant market and sponsor. Our pipeline of transactions that could potentially close in the next 12 months consists of opportunities in which we will be the lead originator as well as opportunities in which we may participate with other institutional investors. As of December 31, 2019, our pipeline consisted of more than $2.5 billion in new equity, debt and real estate opportunities. There can, however, be no assurance with regard to any specific terms of such pipeline transactions or that any or all of the transactions in our pipeline will be completed.
We elected to be taxed as a REIT for U.S. federal income tax purposes, commencing with our taxable year ended December 31, 2013 and operate our business in a manner that will permit us to maintain our exemption from registration as an investment company under the 1940 Act.
- 5 -
INVESTMENT STRATEGY
With scientific consensus that global-warming trends are linked to human activities and resulting in various extreme weather events, we believe our firm is well-positioned to generate attractive risk-adjusted returns by investing in, and managing a portfolio of, assets that address climate-changing greenhouse gas emissions. Further, with increasing weather-related events, we see similar investment opportunities in infrastructure assets that mitigate the impact of, and increase the resiliency to, these weather events and other adverse impacts of climate change.
Our vision is that every investment improves our climate future and thus the carbon impact of an investment is at the core of our business model. We believe that climate positive investments will produce attractive risk adjusted returns and require investments to be neutral to negative on incremental carbon emissions or have some other tangible environmental benefit such as reducing water consumption.
Our climate-positive investment thesis is based on the following theories:
• |
More efficient technologies are more productive and thus should lead to higher economic returns; |
• |
Lower portfolio risk is inherent in a portfolio of smaller investments, generated by trends of increasing decentralization and digitalization of energy assets, compared to larger, centralized utility-scale investments; |
• |
Investing in assets aligned with scientific consensus and society’s general beliefs will reduce potential regulatory and social costs through better internalization of externalities; and |
• |
Assets that reduce carbon emissions represent an embedded option that may increase in value if carbon regulations were to set a price on carbon emissions. |
We believe combining this investment thesis with our multi-decade experience in investing in our markets through multiple interest rate and business cycles, intermittent governmental support for reducing carbon emissions and several ‘boom and bust’ cycles of business expansions in renewable and other sustainable infrastructure markets, will allow us to earn attractive risk-adjusted returns on the assets in which we invest. We also believe there is potentially a very large market opportunity as the legacy technologies for generating and using energy and the systems that produce carbon emissions are converted to low-to-no carbon emission systems while mitigation and resiliency investments continue to increase in an effort to address weather events and climate change.
Our investments are focused on three areas:
• |
Behind-the-Meter (“BTM”): distributed building or facility projects, which reduce energy usage or cost through the use of solar generation and energy storage or energy efficiency improvements including heating, ventilation and air conditioning systems (“HVAC”), lighting, energy controls, roofs, windows, building shells, and/or combined heat and power systems;
|
• |
Grid-Connected (“GC”): projects that deploy cleaner energy sources, such as solar and wind to generate power where the off-taker or counterparty is part of the wholesale electric power grid; and
|
• |
Sustainable Infrastructure: upgraded transmission and distribution systems, water and storm water infrastructure, and other projects that improve water or energy efficiency, increase resiliency, positively impact the environment or more efficiently use natural resources.
|
Of our pipeline, 78% is related to BTM assets and 10% is related to GC assets, with the remainder related to other sustainable infrastructure. We prefer investments where the assets have a long-term, investment-grade rated off-taker or counterparties. In the case of BTM, the off-taker or counterparty may be the building owner or occupant, and we may be secured by the installed improvements or other real estate rights. In the case of GC, the off-taker or counterparty may be a utility or electric user who has entered into a contractually committed agreement, such as a power purchase agreement (“PPA”), to purchase power produced by a renewable energy project at a minimum price with potential price escalators for a portion of the project’s estimated life.
We make our investments utilizing a variety of structures, including:
• |
Equity investments in either preferred or common structures in unconsolidated entities; |
• |
Government and commercial receivables or securities, such as loans for renewable energy and energy efficiency projects; and |
• |
Real estate, such as land or other assets leased for use by sustainable infrastructure projects typically under long term leases. |
Our equity investments in renewable energy projects are operated by various renewable energy companies or by joint ventures in which we participate. These transactions allow us to participate in the cash flows associated with these projects,
- 6 -
typically on a priority basis. Our energy efficiency debt investments are usually assigned the payment stream from the project savings and other contractual rights, often using our pre-existing master purchase agreements with the ESCOs. Our debt investments in various renewable energy or other sustainable infrastructure projects or portfolios of projects are generally secured by the installed improvements or other real estate rights. We also own, directly or through equity investments, over 31,000 acres of land that are leased under long-term agreements to over 60 renewable energy projects, where our investment returns are typically senior to most project costs, debt, and equity.
We focus on projects that use proven technology and that often have contractually committed agreements with an investment grade rated off-taker or counterparties. While we prefer investments in which we hold a senior or preferred position in a project, as our markets evolve and grow, we are seeing increasing opportunities to invest, and have invested, in mezzanine debt or common equity in projects where we are subordinated to project debt and/or preferred forms of equity. Investing greater than 15% of our assets in any individual project requires the approval of a majority of our independent directors. We may adjust the mix and duration of our assets over time in order to allow us to manage various aspects of our portfolio, including expected risk-adjusted returns, macroeconomic conditions, liquidity, availability of adequate financing for our assets, and the maintenance of our REIT qualification and our exemption from registration as an investment company under the 1940 Act.
As of December 31, 2019, our Portfolio consisted of over 180 investments and we seek to manage the diversity of our Portfolio by, among other factors, project type, project operator, type of investment, type of technology, transaction size, geography, obligor and maturity. The mix of our Portfolio is expected to vary over time and approximately 62% of our Portfolio was invested in BTM assets and approximately 38% was invested in GC assets, which includes our land holdings.
As part of our investment process, we calculate the ratio of the estimated first year of metric tons of carbon emissions avoided by our investments divided by the capital invested to quantify the carbon impact of our investments. In this calculation, which we refer to as CarbonCount®, we use emissions factor data, expressed on a CO2 equivalent basis, from the U.S. Government or the International Energy Administration to an estimate of a project’s energy production or savings to compute an estimate of metric tons of carbon emissions avoided. We estimate that our investments originated in 2019 will reduce annual carbon emissions by approximately 385 thousand metric tons. In addition to carbon, we also consider other environmental attributes, such as water use reduction, stormwater remediation benefits and stream restoration benefits.
We believe that our long history of sustainable infrastructure investing, the experience, expertise and relationships of our management team, the anticipated credit strength of the obligors or investees involved in our investments and the size and growth potential of our market, position us well to capitalize on our strategy.
Refer to Item 7. Management’s Discussion and Analysis of Financial Condition and Results of Operations—Results of Operations, for additional discussion on the performance of our investment portfolio.
FINANCING STRATEGY
We believe we have available a broad range of financing sources as part of our strategy that are designed to increase potential returns to our stockholders. We may finance our investments through the use of non-recourse debt, recourse debt, or equity and may also decide to finance such transactions through the use of off-balance sheet securitization structures.
We have worked to expand our liquidity and access to the debt and bank loan markets, including our inaugural issuance of unsecured senior notes, which qualify as green bonds, in the third quarter of 2019. We often provide, and our sources of financing are increasingly interested in, the estimated carbon emission savings or environmental ratings associated with our financings.
We plan to raise additional equity capital and continue to use other fixed and floating rate borrowings which may be in the form of additional bank credit facilities, including term loans and revolving facilities, warehouse facilities, repurchase agreements and public and private equity and debt issuances. We also expect to use both on-balance sheet and non-consolidated securitizations and believe we will be able to customize securitized tranches to meet the investment preferences of different investors. We may also consider the use of separately financed special purpose entities or funds to allow us to expand our investments or manage Portfolio diversity.
The decision on how we finance specific assets or groups of assets is largely driven by the capital structure of the related projects, and risk and portfolio management considerations, as well as the overall interest rate environment, prevailing credit spreads and the terms of available financing and market conditions. Over time, as market conditions change, we may use other forms of leverage in addition to these financing arrangements. Although we are not restricted by any regulatory requirements as to the type or amount of leverage we may utilize, we do have certain targets we seek to, but are not required to, operate within including maintaining a leverage ratio at or below 2.5 to 1. In February 2020, our board of directors increased our target range for our percentage of fixed rate debt to total debt from between 60% to 85% to between 75% and 100%. See additional discussion in Item 7. Management’s Discussion and Analysis of Financial Conditions and Results of Operations—Liquidity and Capital Resources regarding our ongoing evaluation of our leverage and fixed-rate debt targets.
- 7 -
For those transactions that we choose not to hold on our balance sheet, we transfer all or a portion of the economics of the transaction, typically using securitization trusts, to institutional investors in exchange for a gain on the transfer and in some cases, ongoing fees. The market for the assets we finance has remained active throughout various market cycles due to investor demand for high credit quality, long-term investments. We may arrange such securitizations of loans or other assets prior to originating the transaction and thus avoid exposure to credit spread, interest rate and funding risks that are normally associated with traditional capital markets conduit transactions. We also typically manage and service these assets in exchange for fees. We may also use other funds or structures where institutional investors purchase all or a portion of the economics of the transaction and where we may receive upfront or ongoing fees for managing the assets. We periodically provide other services, including arranging financings that are held on the balance sheet of other investors and advising various companies with respect to structuring investments.
Refer to Item 7. Management’s Discussion and Analysis of Financial Conditions and Results of Operations—Liquidity and Capital Resources, for additional discussion on our financings and our ratios and Item 8. Financial Statements and Supplementary Data, Notes 5, 7 and 8 to our financial statements for further information on the types and amounts of our financing activities.
ENVIRONMENTAL AND SOCIAL RESPONSIBILITY AND CORPORATE GOVERNANCE
We own and invest in a diversified portfolio of sustainable infrastructure projects focused on reducing or mitigating the impacts of climate change through the allocation of our capital across the energy efficiency, renewable energy and other sustainable infrastructure markets. Under the direction of our chief executive officer and the board of directors, we are focused on achieving a high level of environmental and social responsibility and strong corporate governance. The Nominating, Governance and Corporate Responsibility Committee of our board of directors is responsible for our environmental, social and governance (“ESG”) oversight, including related policies and communications. Additionally, we have a committee comprised of employees from across our organization that is focused on implementing ESG strategies and policies and reports directly to our chief executive officer. In 2019, we issued our inaugural ESG report that illustrates our progress on these matters.
Our business and business strategy are focused on addressing climate change, in part through the reduction of carbon emissions that have been scientifically linked to climate change. As described in the previous Investment Strategy section , we quantify the carbon impact of each of our investments. In addition, we operate our business in a manner intended to reduce our own environmental impact, including by purchasing 100 percent renewable electricity for our office, encouraging recycling and composting, and offering clean transportation employee incentives for electric and hybrid vehicles. We have also adopted policies focused on minimizing the environmental impact of our operations.
We are a signatory to the United Nations Global Compact, an initiative focused on responsible business practices related to human rights, labor, the environment and anti-corruption. We continue to implement the recommendations of the Task Force on Climate-related Financial Disclosures (“TCFD”) and are located in this filing as follows;
•Governance - Included in this section ”Environmental and Social Responsibility and Corporate Governance”,
•Strategy - Item 1. Business - Investment Strategy,
• |
Risk Management - Item 7. Management’s Discussion and Analysis of Financial Condition and Results of Operations - Factors Impacting our Operating Results - Impact of climate of climate change on our future operations (Scenario Analysis). Also Item 7A. Quantitative and Qualitative Disclosures About Market Risk - Risk Management, and |
• |
Metrics and Targets - Item 7. Management’s Discussion and Analysis of Financial Condition and Results of Operations - Results of Operations - Environmental Metrics. |
We participate in a number of initiatives and coalitions that share our commitment to climate change mitigation, sustainability, and the expansion of clean energy including the United Nations-supported Principles for Responsible Investment (“PRI”), the United Nations Global Compact campaign entitled Business Ambition for 1.5°- Only Our Future, Climate Action 100+, the “We Are Still In” coalition, and the reporting framework established by an international consortium of business and environmental NGOs referred to as the Climate Disclosure Standards Board.
We are also committed to social responsibility within our workforce and our community. We have evaluated and adopted certain human capital and human rights management policies to further our commitment to social responsibility. Our culture is focused on hiring and retaining diverse and highly talented employees and empowering them to create value for our stockholders. In our employee selection process and operation of our business we adhere to equal employment opportunity policies and encourage the participation of our employees in training programs that will enhance their effectiveness in the performance of their duties. Our chief executive officer periodically leads employee meetings intended to encourage employees to understand why sustainability matters and regularly meets with small groups of employees to receive their feedback on the business.
- 8 -
We provide attractive benefits that promote the health of our employees and their families and design compelling job opportunities, aligned with our mission, in an energizing work environment. We also encourage our employees to continue to develop in their careers, including by obtaining advanced degrees or professional certifications. We compensate our employees according to our fair remuneration policies and believe deeply in paying for performance. Therefore, employees generally receive a portion of their compensation in the form of share grants tied to performance. We encourage our employees to contribute their time to support various community and charitable activities and sponsor several local community organizations with a primary focus on environmental organizations.
Our corporate governance philosophy is based on maintaining a close alignment of our interests with those of our stakeholders. Notable features of our corporate governance structure include the following:
• |
our board of directors is not staggered, with each of our directors subject to re-election annually; |
• |
six of our seven directors have been determined to be independent for purposes of the New York Stock Exchange (“NYSE”) corporate governance listing standards and Rule 10A-3 under the Exchange Act; |
• |
the lead independent director of the board of directors convenes and chairs executive sessions of the independent directors to discuss certain matters without management present; |
• |
three of our directors qualify as an “audit committee financial expert” as defined by the Securities and Exchange Commission (the “SEC”); |
• |
two of our directors, including our lead independent director are women, constituting 29% of the board in furtherance of our board diversity policy; |
• |
our Corporate Governance Guidelines provide for a majority vote policy for the election of directors pursuant to which any nominee who receives a greater number of votes “withheld” from his or her election than votes “for” such election shall promptly tender his or her resignation to our board of directors for their consideration as to accept or reject such resignation; |
• |
target retirement age of 75 has been established for our directors; |
• |
we have an active stockholder outreach program, including providing stockholders the right to vote on the fairness of the remuneration of executives; |
• |
our Statement of Corporate Policy Regarding Equity Transaction prohibits our directors and officers from hedging our equity securities, holding such securities in a margin account or pledging such securities as collateral for a loan; |
• |
a Clawback Policy was adopted whereby it is possible to recoup performance or incentive-based compensation in the event of an accounting restatement due to material noncompliance with any financial reporting requirements under the securities laws (other than due to a change in applicable accounting methods, rules or interpretations); |
• |
we have opted out of the control share acquisition statute in the Maryland General Corporations Law (the “MGCL”) and have exempted, from the business combinations statute in the MGCL, transactions that are approved by our board of directors; |
• |
we do not have a stockholder rights plan; and |
• |
our Nominating, Governance and Corporate Responsibility Committee oversees and directs our ESG strategies, activities, policies and communications. |
In order to foster the highest standards of ethics and conduct in all business relationships, we have adopted a Code of Business Conduct and Ethics policy (the “Code of Conduct”). This policy covers a wide range of business practices and procedures and applies to our officers, directors, employees, agents, representatives, and consultants. In addition, we have implemented whistleblowing procedures designed to facilitate the report of accounting and auditing matters as well as Code of Conduct matters (the “Whistleblower Policy”) that sets forth procedures by which any Covered Persons (as defined in the Whistleblower Policy) may report, on a confidential basis, concerns regarding, among other things, any questionable or unethical accounting, internal accounting controls or auditing matters with our Audit Committee as well as any potential Code of Conduct or ethics violations with our Nominating, Governance and Corporate Responsibility Committee or our General Counsel.
We have adopted a Statement of Corporate Policy Regarding Equity Transactions that governs the process to be followed in the purchase or sale of our securities by any of our directors, officers, employees and consultants and prohibits any such persons from buying or selling our securities on the basis of material nonpublic information, and also prohibits our directors and officers from hedging equity securities of the Company, holding such securities in a margin account or pledging such securities as collateral for a loan. We review all of these policies on a periodic basis with our employees.
- 9 -
Our business is managed by our senior management team, subject to the supervision and oversight of our board of directors. Our directors stay informed about our business by attending meetings of our board of directors and its committees and through supplemental reports and communications. Our independent directors, led by the lead independent director, meet regularly in executive sessions without the presence of our officers.
COMPETITION
We compete against a number of parties, including banks, private equity, hedge or infrastructure investment funds, insurance companies, mutual funds, institutional investors, investment banking firms, financial institutions, specialty finance companies, utilities, independent power producers, project developers, pension funds, governmental bodies, public entities established to own infrastructure assets and other entities.
We compete primarily on the basis of service, price, structure and flexibility as well as the breadth and depth of our expertise. We may at times compete and at other times partner or work as a participant with alternative financing sources. The continued low interest rate environment and increasing investor acceptance of the sustainable infrastructure market has increased the level of competition we experience. The increase in the number and/or the size of our competitors in this market has resulted and could continue to result in less attractive terms on our investments or the need to accept a higher level of risks associated with our investments.
We also encounter competition in the form of potential customers or our origination partners electing to use their own capital rather than engaging us as an outside capital provider. In addition, we may also face competition based on technological developments that reduce demand for electricity, increase power supplies through existing infrastructure or that otherwise compete with our sustainable infrastructure projects.
Some of our competitors are significantly larger, have greater access to capital and other resources or enjoy other advantages in comparison to us. In addition, some of our competitors may have higher risk tolerances or different risk assessments which could allow them to consider a wider variety of opportunities and establish more relationships than we can. These competitors may not be subject to the same regulatory constraints (such as REIT compliance or the need to maintain an exemption from registration as an investment company under the 1940 Act) that we face.
We believe that a significant part of our competitive advantage is our management team’s experience and industry expertise. However, we may not be able to achieve our business goals or expectations due to the competitive risks that we face, including increasing competition as a result of the increasing interest by various investors in our assets classes, including renewable energy, to enhance their investment returns. This, or other increases, in competition among competing providers of capital could adversely affect the returns we generate on our investments, and thereby adversely affect the market price of our common stock. For additional information concerning these competitive risks, see Item 1A. Risk Factors—We operate in a competitive market and future competition may impact the terms of our investments.
EMPLOYEES; STAFFING
As of December 31, 2019, we employed 60 people. We intend to hire additional business professionals as needed to assist in the implementation of our business strategy.
INFORMATION ABOUT OUR EXECUTIVE OFFICERS AND OTHER SIGNIFICANT EMPLOYEES
Our executive officers and other significant employees and their ages are as follows:
Jeffrey W. Eckel, 61, has served as our president, chief executive officer, and chairman of our board of directors since 2013 and was with the predecessor of our company as president and chief executive officer since 2000 and prior to that from 1985 to 1989 as a senior vice president. Mr. Eckel is a member of the board of directors of the Alliance To Save Energy, a member of the President’s Council of Ceres, Inc., a member of the Smithsonian Environmental Research Center’s Corporate Leaders program, and on the Board of Trustees of The Nature Conservancy of Maryland and DC. He was appointed by the governor of Maryland to the board of the Maryland Clean Energy Center in 2011 where he served until 2016 while also serving as its chairman from 2012 to 2014. Mr. Eckel has over 35 years of experience in financing, owning and operating infrastructure and energy assets. Mr. Eckel received a Bachelor of Arts degree from Miami University in 1980 and a Master of Public Administration degree from Syracuse University, Maxwell School of Citizenship and Public Affairs, in 1981. He holds Series 24, 63 and 79 securities licenses. We believe Mr. Eckel’s extensive experience in managing companies operating in the energy sector and expertise in energy investments make him qualified to serve as our president and chief executive officer and as chairman of our board of directors.
Jeffrey A. Lipson, 52, joined the Company as our deputy chief financial officer in January 2019. Effective March 1, 2019, Mr. Lipson became an executive vice president and our chief financial officer. From 2013 to 2018, Mr. Lipson was President and Chief Executive Officer and Director of Congressional Bancshares and its subsidiary Congressional Bank. He continues to serve on the Board of Directors of Congressional Bank. Mr. Lipson was the Senior Vice President and Treasurer of CapitalSource Inc. and its subsidiary CapitalSource Bank and Senior Vice President, Corporate Treasury, at Bank of America
- 10 -
and its predecessor FleetBoston Financial. Mr. Lipson received a Bachelor of Science degree in Economics from Pennsylvania State University in 1989 and a Masters in Business Administration in Finance from New York University’s Leonard N. Stern School of Business in 1993. Mr. Lipson serves on the Board of Directors of the Jewish Council for the Aging of Greater Washington.
Steven L. Chuslo, 62, has served as an executive vice president and our general counsel since 2013 and with the predecessor of our company as general counsel since 2008. Mr. Chuslo is responsible for internal governance matters and is actively involved in structuring, developing, negotiating and closing transactions. He has more than 30 years of experience in the fields of securities, commercial finance and energy development, U.S. federal regulation and project finance. Mr. Chuslo received a Bachelor of Arts degree in History from the University of Massachusetts/Amherst and a Juris Doctorate from the Georgetown University Law Center.
J. Brendan Herron, 59, has served as an executive vice president since 2013 and served in a variety of roles at the predecessor of our company and its affiliates from 1994 to 2005, and from 2011 to 2013. Mr. Herron served as our chief financial officer from 2013 to 2019. Effective March 1, 2019, Mr. Herron took on a leadership role as an executive vice president focused on the company’s strategy and growth initiatives. Mr. Herron has over 25 years of experience in structuring, executing and operating infrastructure and technology investments. He formerly served on the U.S. Commerce Secretary’s Renewable Energy and Energy Efficiency Advisory Committee and is presently a member of the Board of Trustees of Calvert Hall College High School (Baltimore, MD). Mr. Herron received a Bachelor of Science degree in accounting and computer science from Loyola University Maryland in 1982 and a Master of Business Administration degree from Loyola University Maryland in 1987 and has passed the CPA and CMA examinations.
Daniel K. McMahon, CFA, 48, has served us as an executive vice president since 2015 and is the head of our portfolio management group. He has been with the Company and its predecessor since 2000 in a variety of roles, including as a senior vice president from 2007 to 2015. He has played a role in analyzing, negotiating, structuring, and managing several billion dollars of transactions. Mr. McMahon received his Bachelor of Arts degree from the University of California, San Diego in 1993, and is a CFA charter holder. He holds Series 24, 63 and 79 securities licenses.
Charles W. Melko, CPA, 39, has served as our senior vice president and chief accounting officer of the Company since 2017. He joined the Company in 2016 as a senior vice president and controller. Prior to this role, he served in a number of roles at PricewaterhouseCoopers LLP since 2005, including as a Senior Manager in the National Professional Services Group where he focused on complex financial instruments accounting issues for energy clients. Mr. Melko received a Bachelor of Science degree in Accountancy in 2002, a Master of Business Administration degree in 2005 and a Master of Science degree in Accountancy from Wheeling Jesuit University in 2005. He holds a CPA license in West Virginia and Maryland.
Susan D. Nickey, 59, has served as a managing director of the Company since 2014. Prior to that, she founded and served as CEO of Threshold Power. Ms. Nickey currently serves as treasurer on the Board of Directors of the American Wind Energy Association and also serves on the Board of Directors of the American Council of Renewable Energy and its Executive Committee. Ms. Nickey received a Bachelor in Business Administration from the University of Notre Dame in 1983 and a Master’s of Science in Foreign Service from Georgetown University in 1986.
Nathaniel J. Rose, CFA, 42, has been an executive vice president since 2015 and our chief investment officer since 2017. He served as our chief operating officer from 2015 to 2017, our chief investment officer from 2013 to 2015 and has been with the Company and its predecessor since 2000. He has been involved with a vast majority of our transactions since 2000. He earned a joint Bachelor of Science and Bachelor of Arts degree from the University of Richmond in 2000, a Master of Business Administration degree from the Darden School of Business Administration at the University of Virginia in 2009, is a CFA charter holder and has passed the CPA examination. He holds a Series 63 and 79 securities licenses.
Dana M. Smith, SPHR, SHRM-SCP, 48, has served as our chief human resources officer since 2017. Prior to that, she was Chief Human Resources Officer for American Capital, Ltd. and its publicly-traded affiliates as well as Senior Vice President of Human Resources and Corporate Marketing for CapitalSource Inc. She received a Bachelor of Science in Economics from The Wharton School of the University of Pennsylvania in 1993 and a Master of Science in Organizational Counseling from The Johns Hopkins University in 2006.
- 11 -
AVAILABLE INFORMATION
We maintain a website at www.hannonarmstrong.com. Information on our website is not incorporated by reference in this Form 10-K. We will make available, free of charge, on our website (a) our Form 10-K, quarterly reports on Form 10-Q and current reports on Form 8-K (including any amendments thereto), proxy statements and other information (collectively, “Company Documents”) filed with, or furnished to, the SEC, as soon as reasonably practicable after such documents are so filed or furnished, (b) Corporate Governance Guidelines, (c) Director Independence Standards, (d) Code of Business Conduct and Ethics policy and (e) written charters of the Audit Committee, Compensation Committee, Nominating, Governance and Corporate Responsibility Committee and Finance and Risk Committee of our board of directors. Company Documents filed with, or furnished to, the SEC are also available for review by the public at the SEC’s website at www.sec.gov. We provide copies of our Corporate Governance Guidelines and Code of Business Conduct and Ethics policy, free of charge, to stockholders who request such documents. Requests should be directed to Investor Relations, 1906 Towne Centre Blvd, Suite 370, Annapolis, Maryland 21401, (410) 571-9860.
Item 1A. |
Risk Factors |
Our business and operations are subject to a number of risks and uncertainties, the occurrence of which could adversely affect our business, financial condition, consolidated results of operations and ability to make distributions to stockholders and could cause the value of our capital stock to decline. We may refer to the energy efficiency, renewable energy and the other sustainable infrastructure projects or market collectively as sustainable infrastructure projects or the industry. Please also refer to the section entitled “Forward-Looking Statements.”
Risks Related to Our Business and Our Industry
Our business depends in part on U.S. federal, state and local government policies and a decline in the level of government support could harm our business.
The projects in which we invest typically depend in part on various U.S. federal, state or local governmental policies and incentives that support or enhance project economic feasibility. Such policies may include governmental initiatives, laws and regulations designed to reduce energy usage and impact the use of renewable energy or the investment in and the use of sustainable infrastructure.
Policies and incentives provided by the U.S. federal government may include tax credits (with some of these tax credits that are related to renewable energy being recently reduced and scheduled to be eliminated or phased out in the future), tax deductions, bonus depreciation, federal grants and loan guarantees and energy market regulations. The value of tax credits, deductions and incentives may be impacted by changes in tax laws, rates or regulations.
Incentives provided by state and local governments may include renewable portfolio standards (“RPS”), which specify the portion of the power utilized by local utilities that must be derived from renewable energy sources such as renewable energy as well as the state or local government sponsored programs where the financing of energy efficiency or renewable energy projects is repaid through a special tax assessment against commercial property in accordance with various state and local government programs known as C-PACE. Additionally, certain states have implemented feed-in tariffs, pursuant to which electricity generated from renewable energy sources is purchased at a higher rate than prevailing wholesale rates. Other incentives include tariffs, tax incentives and other cash and non-cash payments.
Governmental agencies, commercial entities and developers of sustainable infrastructure projects frequently depend on these policies and incentives to help defray the costs associated with, and to finance, various projects. Government regulations also impact the terms of third-party financing provided to support these projects. If any of these government policies, incentives or regulations are adversely amended, delayed, eliminated, reduced, retroactively changed or not extended beyond their current expiration dates, or there is a negative impact from the recent federal law changes or proposals, the operating results of the projects we finance and the demand for, and the returns available from, the investments we make may decline, which could harm our business.
U.S. federal, state and local government entities are major participants in the sustainable infrastructure industry and their actions could be adverse to our projects or our company.
The projects we invest in are subject to substantial regulation by U.S. federal, state and local governmental agencies. For example, many projects require government permits, licenses, concessions, leases or contracts. Government entities, due to the wide-ranging scope of their authority, have significant leverage in setting their contractual and regulatory relationships with third parties. In addition, government permits, licenses, concessions, leases and contracts are generally very complex, which may result in periods of non-compliance, or disputes over interpretation or enforceability. If the projects in which we invest fail to obtain or comply with applicable regulations, permits, or contractual obligations, they could be prevented from being
- 12 -
constructed or subjected to monetary penalties or loss of operational rights, which could negatively impact project operating results and the returns on our assets.
Contracts with government counterparties that support the projects in which we invest may be more favorable to the government counterparties compared to commercial contracts with private parties. For example, a lease, concession or general service contract may enable the government to modify or terminate the contract without requiring the payment of adequate compensation. Typically, our contracts with government counterparties contain termination provisions including prepayment amounts. In most cases, the prepayment amounts provide us with amounts sufficient to repay the financing we have provided but may be less than amounts that would be payable under “make whole” provisions customarily found in commercial lending arrangements.
In addition, government counterparties also may have the discretion to change or increase regulation of project operations, or implement laws or regulations affecting project operations, separate from any contractual rights they may have. These actions could adversely impact the efficient and profitable operation of the projects in which we invest.
Government entities may also suspend or debar contractors from doing business with the government or pursue various criminal or civil remedies under various government contract regulations. They may also issue new government contracts or fail to extend existing government contracts. Our ability to originate new assets could be adversely affected if one or more of the ESCOs or other origination sources with whom we have relationships are suspended or debarred or fail to win new, or renew existing, contracts.
Changes in the terms of energy savings performance contracts could have a material and adverse impact on our business.
We derive a portion of our income from the assignment to us of payment streams under energy savings performance contracts with property owners, including government customers, in which the scope and cost of improvements and services are specified. While U.S. federal, state and local government rules governing such contracts vary, such rules may, for example, permit the funding of such contracts through long-term financing arrangements, permit long-term payback periods from the savings realized through such contracts, allow units of government to exclude debt related to such contracts from the calculation of their statutory debt limitation, allow for award of contracts on a “best value” instead of “lowest cost” basis and allow for the use of sole source providers. To the extent these rules become more restrictive in the future, our ability to provide financing to support these projects could be adversely impacted, which could harm our business. Changes in these rules, including retroactive changes, could also negatively impact the operating results of the projects we finance and the returns on our assets.
A change in the fiscal health, level of appropriations or budgets of U.S. federal, state and local governments could reduce demand for our investments.
Although our energy efficiency investments do not normally require additional governmental appropriations to cover repayment due to the energy and operating savings derived from the newly installed equipment and systems, a significant decline in the fiscal health, level of appropriations or budgets of government customers may make it difficult for them to remain current on existing payment obligations or undesirable to enter into new energy efficiency improvement projects. Alternatively, some government entities may choose to provide appropriations or other credit support for sustainable infrastructure projects, which would negatively impact the use of private capital such as ours. This could have a material and adverse effect on the return of and return on our investments for existing projects and on our ability to originate new assets. Moreover, other changes in resources available to governments may also impact their willingness to undertake energy efficiency projects. For example, an increase in money set aside for government expenditures for energy efficiency projects may reduce demand for our investments.
In addition, to the extent we make investments that involve direct appropriations, we will depend on approval of the necessary spending for the projects. The repayment of the investment, or the return on our asset, could be adversely affected if appropriations for any such projects are delayed or terminated.
Because our business depends to a significant extent upon relationships with key industry players, our inability to maintain or develop these relationships, or the failure of these relationships to generate business opportunities, could adversely affect our business.
We rely, to a significant extent, on our relationships with key industry players in the markets we target. We originate transactions through programmatic finance relationships with various parties, including global ESCOs. We also originate transactions with renewable energy manufacturers, developers and operators who own and operate renewable energy projects, including several U.S. utility companies. In addition to the net proceeds from past and future debt and equity offerings, we have also financed our business by accessing the securitization, syndication, or other debt markets, primarily utilizing our relationships with insurance companies and commercial banks. We also rely on relationships with a variety of key financial participants, including institutional investors, senior lenders, and investment and commercial banks, as well as leading
- 13 -
intermediaries, to complement our origination and financing activities. Our inability to maintain or develop these relationships, or the failure of these relationships to generate business opportunities, could adversely affect our business. In addition, individuals and entities with whom we have relationships are not obligated to provide us with business opportunities, and, therefore, there is no assurance that such relationships will generate business opportunities for us.
If the cost of energy generated by traditional sources of energy continues to stay or further declines from present levels, demand for the projects in which we invest may decline.
Many traditional sources of energy such as coal, petroleum based fuels and natural gas can be influenced by the price of underlying or substitute commodities. While we believe the potential for rising or increasingly volatile commodity prices and inflation will spur investment in our industry, there have been, and may continue to be, decreases in such prices, which may reduce the demand for energy efficiency projects or other projects, including renewable energy facilities, that do not rely on fossil fuel energy sources. For example, we believe low natural gas prices may reduce the demand for projects like renewable energy that can substitute for natural gas. Additionally, low natural gas prices can adversely affect both the price available to renewable energy projects under future power sale agreements and the price of the electricity the projects sell on either a forward or a spot-market basis. Technological progress in electricity generation, storage or in the production of traditional fuels or the discovery of large new deposits of traditional fuels could reduce the cost of energy generated from those sources and consequently reduce the demand for the types of projects in which we invest, which could harm our new business origination prospects as well as the value of our existing portfolio. In addition, volatility in commodity prices, including energy prices, may cause building owners and other parties to be reluctant to commit to projects for which repayment is based upon a fixed monetary value for energy savings that would not decline if the price of energy declines. Any resulting decline in demand for our investments or the price that industry participants receive for the sale of fossil fuel could adversely impact our operating results.
If the market for various types of sustainable infrastructure projects or the investment techniques related to such projects do not develop as we anticipate, new business generation in this target area may be adversely impacted.
The market for various types of sustainable infrastructure projects such as renewable energy projects, commercial office building energy efficiency projects, electricity storage, and storm water and various other sustainable infrastructure projects is emerging and rapidly evolving, leaving their future success uncertain. Similarly, various investing techniques, such as leasing land for renewable energy projects, purchasing interests in existing renewable energy projects, the use of C-PACE financing and the use of taxable debt for state and local energy efficiency or sustainable infrastructure financings are emerging and the future success of these investing techniques is also uncertain. If some or all market segments or investing techniques prove unsuitable for widespread commercial deployment or if demand for such projects or techniques fail to grow sufficiently, the demand for our capital may decline or develop more slowly than we anticipate. Many factors will influence the widespread adoption and demand for such projects and investing techniques, including general and local economic conditions, commodity prices of fossil fuel energy sources, the cost and availability of energy storage, the cost-effectiveness of various projects and techniques, performance and reliability of such technologies compared to conventional power sources and technologies, and the extent of government subsidies and regulatory developments. Any changes in the markets, products, technologies, financing techniques, or the regulatory environment could adversely impact the demand or financial performance for such projects and our investments.
In addition, renewable energy projects rely on electric and other types of transmission lines and facilities owned and operated by third parties to receive and distribute their energy. Any substantial access barriers to these lines and facilities could make projects that depend on them more expensive, which could adversely impact the demand or financial performance for such projects and our investments.
Existing electric utility industry regulations, and changes to regulations, may present technical, regulatory and economic barriers to the purchase and use of renewable energy and energy efficiency systems that may significantly reduce demand for systems in which we can invest.
Federal, state and local government regulations and policies concerning the electric utility industry, and internal policies and regulations promulgated by electric utilities, heavily influence the market for electricity products and services. These regulations and policies often relate to electricity pricing and the interconnection of customer-owned electricity generation. In the United States, governments and utilities continuously modify these regulations and policies. These regulations and policies could deter customers from purchasing energy efficiency and renewable energy systems. For example, the Department of Energy (“DOE”) requested the Federal Energy Regulatory Commission (“FERC”) to change various policies and regulations related to the functioning of the electric markets. FERC rejected DOE’s proposal but conducted its own review of grid resiliency and the functioning of electricity markets and has made, and could continue to make, changes to policies and regulations related to the function of the electricity markets and grid resiliency which may negatively impact the use of renewable energy or encourage the use of fossil fuel energy over renewable energy. This could result in a significant reduction in the potential demand for such systems. Utilities commonly charge fees to larger, industrial customers for disconnecting from
- 14 -
the electric grid or for having the capacity to use power from the electric grid for back-up purposes. In addition, there is an increasing trend towards initiating or increasing fixed fees for users to have electricity service from a utility. These fees could increase our customers’ cost to use energy efficiency and renewable energy systems not supplied by the utility and make them less desirable, thereby harming our business, prospects, financial condition and results of operations. In addition, any changes to government or internal utility regulations and policies that favor electric utilities could reduce competitiveness and cause a significant reduction in demand for systems in which we invest.
Some projects in which we invest rely on net metering and related policies to improve project economics which if reduced could impact repayment of our investments or the return on our assets.
Many states have a regulatory policy known as net energy metering, or net metering. Net metering typically allows some project customers to interconnect their on-site solar or other renewable energy systems to the utility grid and offset their utility electricity purchases by receiving a bill credit at the utility’s retail rate for the amount of energy in excess of their electric usage that is generated by their renewable energy system and is exported to the grid. At the end of the billing period, the customer simply pays for the net energy used or receives a credit at the retail rate if more energy is produced than consumed. Net metering policies are under review or have been limited or amended in a number of states. The ability and willingness of customers to pay for renewable energy systems which benefit from net metering rules may be reduced if net metering rules are eliminated or their benefits reduced, which may also impact our returns on such systems.
Sustainable infrastructure projects that involve the generation, transmission or sale of electricity such as renewable energy projects may be subject to regulation by the Federal Energy Regulatory Commission under the Federal Power Act or other regulations that regulate the sale of electricity, which may adversely affect the profitability of such projects.
Sustainable infrastructure projects that involve the generation, transmission or sale of electricity such as renewable energy projects may be “qualifying facilities” that are exempt from regulation as public utilities by the “FERC under the Federal Power Act, (the “FPA”) while certain other such projects may be subject to rate regulation by the FERC under the FPA. FERC regulations under the FPA confer upon these qualifying facilities key rights to interconnection with local utilities and can entitle such facilities to enter into PPAs with local utilities, from which the qualifying facilities benefit. Changes to these U.S. federal laws and regulations could increase the regulatory burdens and costs and could reduce the revenue of the project. In addition, modifications to the pricing policies of utilities could require sustainable infrastructure projects to achieve lower prices in order to compete with the price of electricity from the electric grid and may reduce the economic attractiveness of certain energy efficiency measures. To the extent that the projects in which we invest are subject to rate regulation, the project owners will be required to obtain FERC acceptance of their rate schedules for wholesale sales of energy, capacity and ancillary services. Any changes in the rates project owners are permitted to charge could impact the repayment of our investments, or the return on our assets.
In addition, the operation of, and electrical interconnection for, our sustainable infrastructure projects may be subject to U.S. federal, state or local interconnection and federal reliability standards, some of which are set forth in utility tariffs. These standards and tariffs specify rules, business practices and economic terms to which the projects where we invest are subject and which may impact a project’s ability to deliver the electricity it produces or transports to its end customer. The tariffs are drafted by the utilities and approved by the utilities’ state and U.S. federal regulatory commissions. These standards and tariffs change frequently and it is possible that future changes will increase our administrative burden or adversely affect the terms and conditions under which the projects render services to their customers.
In addition, under certain circumstances, we may also be subject to the reliability standards of the North American Electric Reliability Corporation. If project owners fail to comply with the mandatory reliability standards, they could be subject to sanctions, including substantial monetary penalties, which could also raise credit risks for, or lower the returns available from, the projects in which we invest.
These various regulations may also limit the transferability or sale of renewable energy projects and any such limits could negatively impact our returns from such projects.
Unfavorable publicity or public perception of the industries in which we operate could adversely impact our operating results and our reputation.
The sustainable infrastructure industry, including various forms of renewable energy and C-PACE financings receives significant media coverage that, whether or not directly related to our business or our projects, can adversely impact our reputation and the demand for our investments. Similarly, negative publicity or public perception of the renewable energy industry or the broader energy industries in which we operate or of climate change in general could reduce demand for our investments and our projects’ services. Any reduction in demand for sustainable infrastructure projects or for our investments could damage our reputation or could have a material adverse effect on our results of operations and business prospects.
- 15 -
Future litigation or administrative proceedings could have a material and adverse effect on our business, financial condition and results of operations.
We may become involved in legal proceedings, administrative proceedings, claims and other litigation that arise in the ordinary course of business. In addition, we may be subject to legal proceedings or claims arising out of the projects in which we invest. Adverse outcomes or developments relating to these proceedings, such as the interpretation of our contracts, judgments for monetary damages, injunctions or denial or revocation of permits, could have a material adverse effect on the projects in which we invest, which could adversely impact the repayment of or the returns available for our assets.
We operate in a competitive market and future competition may impact the terms of our investments.
We compete against a number of parties who may provide alternatives to our investments including specialty finance companies, savings and loan associations, banks, private equity, hedge or infrastructure investment funds, insurance companies, mutual funds, institutional investors, investment banking firms, financial institutions, utilities, independent power producers, project developers, pension funds, government entities, public entities established to own infrastructure assets and other entities. The continued low interest rate environment and increasing investor acceptance of the sustainable infrastructure market have increased the level of competition we experience. We also encounter competition in the form of potential customers or our origination partners electing to use their own capital rather than engaging an outside provider such as us. In addition, we may also face competition based on technological developments that reduce demand for electricity, increase power supplies through existing infrastructure or that otherwise compete with our sustainable infrastructure projects. Some of our competitors are significantly larger than we are, have access to greater capital and other resources than we do and may have other advantages over us. In addition, some of our competitors may have higher risk tolerances or different risk assessments, which could allow them to consider a wider variety of investments and establish more relationships than we can. In addition, many of our competitors are not subject to the operating constraints associated with REIT tax compliance or maintenance of an exemption from the 1940 Act. These characteristics could allow our competitors to consider a wider variety of opportunities, establish more relationships and offer better pricing and more flexible structuring than we can offer. We may lose business opportunities if we do not match our competitors’ pricing, terms and structure. If we match our competitors’ pricing, terms and structure, we may not be able to achieve acceptable risk-adjusted returns on our assets or we may be forced to bear greater risks of loss. The increase in the number and/or the size of our competitors in this market has resulted, and could continue to result, in less attractive terms on our investments or the need to accept a higher level of risks associated with our investments. As a result, competitive pressures we face could have a material adverse effect on our business, financial condition and results of operations.
Our business is affected by seasonal trends and construction cycles, and these trends and cycles could have an adverse effect on our operating results.
The volume and timing of our originations are subject to seasonal fluctuations and construction cycles, particularly in climates that experience colder weather during the winter months, such as the northern United States, or at educational institutions, where large projects are typically carried out during summer months when their facilities are unoccupied. In addition, government customers, many of which have fiscal years that do not coincide with ours, typically follow annual procurement cycles. Further, government contracting cycles can be affected by the timing of, and delays in, the legislative process related to government programs, funding, or incentives that help drive demand for sustainable infrastructure projects. As a result of such fluctuations, we may occasionally experience fluctuations in the timing of new asset opportunities or declines in revenue or earnings as compared to the immediately preceding quarter, and comparisons of our operating results on a period-to-period basis may not be meaningful.
Risks Related to Our Assets and Projects in Which We Invest
Changes in interest rates could adversely affect the value of our assets and negatively affect our profitability.
Interest rates are highly sensitive to many factors, including governmental monetary and tax policies, domestic and international economic and political considerations and other factors beyond our control. Many of our assets pay a fixed rate of interest or provide a fixed preferential return.
With respect to our business operations, increases in interest rates, in general, may over time cause: (1) project owners to be less interested in borrowing or raising equity and thus reduce the demand for our investments; (2) the interest expense associated with our borrowings to increase; (3) the market value of our fixed rate or fixed return assets to decline; and (4) the market value of our interest rate swap agreements to increase. Conversely, decreases in interest rates, in general, may over time cause: (1) project owners to be more interested in borrowing or raising equity and thus increase the demand for our assets; (2) prepayments on our assets, to the extent allowed, to increase; (3) the interest expense associated with our borrowings to decrease; (4) the market value of our fixed rate or fixed return assets to increase; and (5) the market value of our interest rate swap agreements to decrease. Adverse developments resulting from changes in interest rates could have a material adverse effect on our business, financial condition and results of operations.
- 16 -
The lack of liquidity of our assets may adversely affect our business, including our ability to value and sell our assets.
Volatile market conditions could significantly and negatively impact the liquidity of our assets. Illiquid assets typically experience greater price volatility, as a ready market does not exist, and can be more difficult to value. In addition, validating third-party pricing for illiquid assets may be more subjective than more liquid assets. The illiquidity of our assets may make it difficult for us to sell such assets if the need or desire arises. In addition, if we are required to liquidate all or a portion of our Portfolio quickly, we may realize significantly less than the value at which we have previously recorded our assets. To the extent that we utilize leverage to finance our investments that are or become illiquid, the negative impact on us related to trying to sell assets in a short period of time for cash could be greatly exacerbated. As a result, our ability to vary our portfolio in response to changes in economic and other conditions may be relatively limited, which could adversely affect our results of operations and financial condition.
Provisions for loan losses are difficult to estimate.
Our provision for loan losses is evaluated on a quarterly basis. The determination of our provision for loan losses requires us to make certain estimates and judgments, which may be difficult to determine. Our estimates and judgments are based on a number of factors, including a projects operating results, loan-to-value ratio, any cash reserve, the ability of expected cash from operations to cover the cash flow requirements currently and into the future, key terms of the transaction, the ability of the borrower to refinance the transaction, other credit support from the sponsor or guarantor and the project’s collateral value. In addition, we consider the overall economic environment, the sustainable infrastructure sector, the effect of local, industry, and broader economic factors, the impact of any variation in weather and the historical and anticipated trends in interest rates, defaults and loss severities for similar transactions.
Our estimates and judgments may not be correct and, therefore, our results of operations and financial condition could be severely impacted.
In June 2016, the FASB issued ASU No. 2016-13, Financial Instruments-Credit Losses-Measurement of Credit Losses on Financial Instruments (Topic 326), which is effective for accounting periods beginning after December 15, 2019 and replaces the current “incurred loss” model for recognizing credit losses with an “expected loss” model referred to as the Current Expected Credit Loss ("CECL") model. Under the CECL model, we are required to present certain financial assets carried at amortized cost, such as loans held for investment, at the net amount expected to be collected. The measurement of expected credit losses is to be based on information about past events, including historical experience, current conditions, and reasonable and supportable forecasts that affect the collectability of the reported amount. This measurement will take place at the time the financial asset is first added to the balance sheet and updated quarterly thereafter. This differs significantly from the “incurred loss” model required under current accounting principles generally accepted in the United States (“GAAP”), which delays recognition until it is probable a loss has been incurred.
Accordingly, we expect that the adoption of the CECL model will affect how we determine our allowance for loan losses and could require us to increase our allowance and recognize provisions for loan losses earlier in the lending cycle. Moreover, the CECL model may create more volatility in the level of our allowance for loan losses. If our required level of allowance for loan losses is material for any reason, such increase could adversely affect our business, financial condition and results of operations.
We may experience a decline in the fair value of our assets.
A decline in the fair market value of available-for-sale securities, any receivables we hold for sale, our interest rate hedges, if any, or any other assets which we may carry at fair value in the future, may require us to reduce the value of such assets under GAAP. In addition, our other financial assets are subject to an impairment assessment that could result in adjustments to their carrying values. Upon the subsequent disposition or sale of such assets, we could incur future losses or gains based on the difference between the sale price received and adjusted value of such assets as reflected on our balance sheet at the time of sale.
Some of the assets in our portfolio may be recorded at fair value and, as a result, there could be uncertainty as to the value of these assets.
Our investments are not publicly traded. The fair value of assets that are not publicly traded may not be readily determinable. In accordance with GAAP, we record certain of our assets at fair value, which may include unobservable inputs. Because such valuations are subjective, the fair value of these assets may fluctuate over short periods of time and our determinations of fair value may differ materially from the values that would have been used if a ready market for these assets existed. The value of our common stock could be adversely affected if our determinations regarding the fair value of these assets were materially higher than the values that we ultimately realize upon their disposal. Additionally, our results of operations for a given period could be adversely affected if our determinations regarding the fair value of these assets were
- 17 -
materially higher than the values that we ultimately realize upon their disposal. The valuation process can be particularly challenging during periods when market events make valuations of certain assets more difficult, unpredictable and volatile.
We may not realize income or gains from our assets, which could cause the value of our common stock to decline.
We seek to provide attractive risk-adjusted returns to our stockholders. However, our assets may not appreciate in value and, in fact, may decline in value, and the assets we originate or acquire may default or not perform in accordance with our expectations. Accordingly, we may not be able to realize gains or income from our assets. Any gains that we do realize may not be sufficient to offset any other losses we experience. Any income that we realize may not be sufficient to offset our expenses.
Many of our investments are not rated by a rating agency, which may result in an amount of risk, volatility or potential loss of principal that is greater than that of alternative asset opportunities.
Many of our investments are not rated by any rating agency and we expect that some of the assets we originate and acquire in the future will not be rated by any rating agency. Although we focus on sustainable infrastructure projects with high credit quality obligors, we believe that some of the projects or obligors in which we invest, if rated, would be rated below investment grade, due to speculative characteristics of the project or the obligor’s capacity to pay interest and repay principal or pay dividends. Some of our assets may result in an amount of risk, volatility or potential loss of principal that is greater than that of alternative asset opportunities.
Any credit ratings assigned to our assets, debt or obligors are subject to ongoing evaluations and revisions and we cannot assure you that those ratings will not be downgraded.
To the extent our assets, their underlying obligors, or our debt are rated by credit rating agencies or by our internal rating process, such assets , obligors or our debt will be subject to ongoing evaluation by credit rating agencies and our internal rating process, and we cannot assure you that any ratings will not be changed or withdrawn in the future. For example, PG&E Corporation declared bankruptcy in January 2019, and credit rating agencies have downgraded, and are reviewing, a number of other California utilities’ credit ratings as a result of potential wild fire liability. Such downgrades have reduced the amount we can borrow on certain assets that have California utilities as obligors and caused a rating agency to place on review the rating of two of our non-recourse debt facilities. If rating agencies assign a lower-than-expected rating or if a rating is further reduced or withdrawn by a rating agency or us, or if there are indications of a potential reduction or withdrawal of the ratings of our assets, the underlying obligors or our debt in the future, the value of these assets could significantly decline, the level of borrowings based on such asset could be reduced or we could incur higher borrowing costs or incur losses upon disposition or the failure of obligors to satisfy their obligations to us.
Our investments are subject to delinquency, foreclosure and loss, any or all of which could result in losses to us.
Our investments are subject to risks of delinquency, foreclosure and loss. In many cases, the ability of a borrower to return our invested capital and our expected return is dependent primarily upon the successful development, construction and operation of the underlying project. If the cash flow of the project is reduced, the borrower’s ability to return our capital and our expected return may be impaired. We make certain estimates regarding project cash flows or savings during the underwriting of our investment. These estimates may not prove accurate, as actual results may vary from estimates. The cash flows or cost savings of a project can be affected by, among other things: the terms of the power purchase or other use agreements used in such project; the creditworthiness of the off-taker or project user; price of power or services now and in the future; the technology deployed; unanticipated expenses in the development or operation of the project and changes in national, regional, state or local economic conditions, laws and regulations; and acts of God, terrorism, social unrest and civil disturbances.
In the event of any default or shortfall of an investment, we will bear a risk of loss of principal or equity to the extent of any deficiency between the value of the collateral, if any, and the amount of our investment, which could have a material adverse effect on our cash flow from operations and may impact the cash available for distribution to our stockholders. Many of the projects are structured as special purpose limited liability companies which limits our ability to realize any recovery to the collateral or value of the project itself. In the event of the bankruptcy of a project owner, obligor, or other borrower, our investment or the project will be deemed to be subject to the avoidance powers of the bankruptcy trustee or debtor-in-possession and our or the project’s contractual rights may be unenforceable under federal bankruptcy or state law. Foreclosure proceedings against a project can be an expensive and lengthy process, which could have a substantial negative effect on our anticipated return on the foreclosed investment.
Our sustainable infrastructure projects may incur liabilities that rank equally with, or senior to, our investments in such projects.
We provide a range of investment structures, including various types of debt and equity securities, senior and subordinated loans, real property leases, mezzanine debt, preferred equity and common equity. Our projects may have, or may be permitted to incur, other liabilities or equity preferences that rank equally with, or senior to, our positions or investments in such projects or businesses, as the case may be, including with respect to grants of collateral. By their terms, such instruments
- 18 -
may entitle the holders to receive payment of interest, principal payments or other distributions on or before the dates on which we are entitled to receive payments with respect to the instruments in which we invest. Also, in the event of insolvency, liquidation, dissolution, reorganization or bankruptcy of an entity in which we have invested, holders of instruments ranking senior to our investment in that project or business would typically be entitled to receive payment in full before we receive any distribution. After repaying such senior stakeholders, such project may not have any remaining assets to use for repaying its obligation to us. In the case of securities ranking equally with instruments we hold, we would have to share on an equal basis any distributions with other stakeholders holding such instruments in the event of an insolvency, liquidation, dissolution, reorganization or bankruptcy of the relevant project.
Our mezzanine or subordinated loans are less protected against losses than senior debt.
We make or acquire mezzanine and subordinated loans, which are loans made to project owners for sustainable infrastructure projects that are subordinate to other more senior interest or are secured by pledges of the borrower’s ownership interests in the project and/or the project owner. These mezzanine and subordinated loans may be subordinate to senior secured loans on the projects or to the returns required by the investors focused on the tax attributes in a project, known as tax equity investors, but senior to the project owner’s equity. In the event a borrower defaults on a loan and lacks sufficient assets to satisfy our mezzanine or subordinated financing, we may suffer a loss of principal or interest. In the event a borrower declares bankruptcy, we may not have full recourse to the assets of the borrower, or the assets of the borrower may not be sufficient to satisfy our mezzanine or subordinated loan. In addition, mezzanine or subordinated loans are by their nature structurally subordinated to more senior project level investments, and in some cases, to tax equity investors. If a borrower defaults on our mezzanine or subordinated loan, on its obligations to the tax equity investor or on debt or other obligations senior to our loan, or if a borrower declares bankruptcy, our mezzanine or subordinated loan will be satisfied only after the project level debt or other obligations or tax equity and other senior debt is paid in full. Significant losses related to our mezzanine or subordinated loans would result in operating losses for us and may limit our ability to make distributions to our stockholders.
Our subordinated and mezzanine debt and equity investments, many of which are illiquid with no readily available market, involve a substantial degree of risk.
We make subordinated and mezzanine debt and equity investments which may fail to be repaid or appreciate and may decline in value or become worthless and our ability to recover our investment will depend on the success of the project in which we make such investments. Subordinated and mezzanine debt and equity investments involve a number of significant risks, including:
• |
such investments could be subject to further dilution as a result of the issuance of additional debt or equity interests and to serious risks because subordinated and mezzanine debt are subordinate to other indebtedness and in some cases, project tax equity, and equity interests are subordinate to all indebtedness (including trade creditors) and any senior securities in the event that the issuer is unable to meet its obligations or becomes subject to a bankruptcy process; |
• |
to the extent that a project in which we invest requires additional capital and is unable to obtain it, we may not recover our investment; and |
• |
in some cases, subordinated and mezzanine debt may not pay current interest or principal or equity investments may not pay current dividends, and our ability to realize a return on our investment, as well as to recover our investment, will be dependent on the success of the project in which we invest. The project may face unanticipated costs or delays or may not generate projected cash flows which could lead to the project generating lower than expected rates of return. |
We generally do not control the projects in which we invest.
Although the covenants in our financing or investment documentation generally restrict certain actions that may be taken by project owners, we generally do not control the projects in which we invest. As a result, we are subject to the risk that the project owner may make certain business decisions or take risks with which we disagree or otherwise act in ways that do not serve our interests.
- 19 -
We invest in joint ventures and other similar arrangements that subject us to additional risks.
Some of our projects are structured as joint ventures, partnerships, securitizations, syndications and consortium arrangements. Part of our strategy is to participate with other institutional investors or the project’s sponsor on various sustainable infrastructure transactions. These arrangements are driven by the magnitude of capital required to complete acquisitions and the development of sustainable infrastructure projects and other industry-wide trends that we believe will continue. Such arrangements involve risks not present where a third party is not involved, including the possibility that partners or co-venturers might become bankrupt or otherwise fail to fund their share of required capital contributions. Additionally, partners or co-venturers might at any time have economic or other business interests or goals different from ours. These investments generally provide for a reduced level of control over an acquired project because governance rights are shared with others. Accordingly, project decisions relating to the management, operation and the timing and nature of any exit, are often made by a majority vote of the investors or by separate agreements that are reached with respect to individual decisions. In addition, project operations may be subject to the risk that the project owners may make business, financial or management choices with which we do not agree or the management of the project may take risks or otherwise act in a manner that does not serve our interests. Because we may not have the ability to exercise control, we may not be able to realize some or all of the benefits expected from our investment. If any of the foregoing were to occur, our business, financial condition and results of operations could suffer as a result.
In addition, some of our joint ventures, partnerships, and equity investments, subject the sale or transfer of our interests in these projects to rights of first refusal or first offer, tag along or drag along rights and buy-sell, call-put or other restrictions. Such rights may be triggered at a time when we may not want them to be exercised and such rights may inhibit our ability to sell our interest in an entity within our desired time frame or on any other desired terms.
Energy efficiency, renewable energy and other sustainable infrastructure projects are subject to performance risks that could impact the repayment of and the return on our assets.
Energy efficiency, renewable energy and other sustainable infrastructure projects are subject to various construction and operating delays and risks that may cause them to incur higher than expected costs or generate less than expected amounts of savings or outputs such as electricity in the case of a renewable energy project. These risks include construction delays, a failure or degradation of our, our customers’ or the utilities’ equipment; obsolescence of, or an inability to find suitable, equipment or parts; labor shortages; less than expected supply of a project’s source of renewable energy, such as solar insolation and wind; or a faster than expected diminishment of such supply. Further, many projects in which we invest will be subject to competitive risks and to volatility in commodity prices including the price of energy. Any extended interruption in the project’s construction or operation, any cost overrun or failure of the project for any reason to generate the expected amount of output or cash flow, could have a material adverse effect on the repayment of and the return on our assets.
Many of our assets depend on revenues from third-party contractual arrangements.
Many of the projects in which we invest rely on revenue or repayment from contractual commitments of end-customers, including federal, state or local governments for energy efficiency projects or utilities or other customers under PPAs. There is a risk that these customers may default under their contracts. In addition, many of these end-customers are large entities with wide ranging activities. An event in a non-related part of the business could have a material adverse impact on the financial strength of such end-customer such as the effect of recent wildfires on the California utilities. Furthermore, the bankruptcy, insolvency or other liquidity constraints of one or more customers may result in a renegotiation or rejection of the third-party contract, delay the receipt of any obligations or reduce the likelihood of collecting defaulted obligations. Some projects rely on one customer for their revenue and thus the project could be materially and adversely affected by any material change in the financial condition of that customer. While there may be alternative customers for such a project, there can be no assurance that a new contract on the same terms will be able to be negotiated for the project.
Certain of our projects with contractually committed revenues or other sources of repayment under long term contracts will be subject to re-contracting risk in the future. We cannot provide assurance that these contracts can be re-negotiated once their terms expire on equally favorable terms or at all. If it is not possible to renegotiate these contracts on favorable terms, our business, financial condition, results of operations and prospects could be materially and adversely affected.
Revenues at some of the projects in which we invest depend on reliable and efficient metering, or other revenue collection systems, which are often specified in the contract. There is a risk that, if one or more of such projects are not able to operate and maintain the metering or other revenue collection systems in the manner expected, if the operation and maintenance costs, are greater than expected, or if the customer disputes the output of the revenue collection system, the ability of the project to repay our investments or provide a return to us on our asset could be materially and adversely affected.
- 20 -
We are exposed to the credit risk of ESCOs, various project sponsors, and others.
We are subject to varying degrees of credit risk related to ESCOs in government energy efficiency projects in which guarantees provided by ESCOs under energy savings performance contracts are required in the event that certain energy savings are not realized by the customer. We are also exposed to credit risk in projects in which we invest that do not depend on funding from governments.
Where we make loans to or own equity interests in special purposes entities such as those which lease solar energy systems to residential customers, those special purpose entities often enter into various contractual arrangements with, or receive performance guarantees from the affiliate project sponsor to ensure satisfactory equipment or other project performance over the term of the lease or power purchase agreement. To the extent those parties are unable to perform on their contractual obligations or performance guarantees we may see diminished equity returns or the special purpose entity may be unable to repay their loan timely or at all.
We seek to mitigate these credit risks by employing a comprehensive review and asset selection process and careful ongoing monitoring of acquired assets. Nevertheless, unanticipated credit losses could occur which could adversely impact our operating results. During periods of economic downturn in the global economy, our exposure to credit risks from obligors increases, and our efforts to monitor and mitigate the associated risks may not be effective in reducing our credit risks. Certain participants in the sustainable energy industry have experienced significant declines in the value of their equity and difficulty in raising or refinancing debt, which increases the credit risk to these companies and there can be no assurance they will be able to fulfill their obligations which could adversely impact our operating results.
Some of the projects in which we invest have sold their output under PPAs which expose the projects to various risks.
Some of our projects enter into PPAs when they contract to sell all or a fixed proportion of the electricity generated by the project, sometimes bundled with renewable energy credits and capacity or other environmental attributes, to a power purchaser, often a utility, or increasingly, a corporation. PPAs are used to stabilize our revenues from that project. We are exposed to the risk that the power purchaser, who we consider an obligor, will fail to perform under a PPA or the PPA will be terminated or expire, which will lead to that project needing to sell its electricity at the then market price, which could be substantially lower than the price provided in the applicable PPA. In most instances, the project also commits to sell minimum levels of generation. If the project generates less than the committed volumes, it may be required to buy the shortfall of electricity on the open market or make payments of liquidated damages or be in default under a PPA, which could result in its termination. In the event that any of these events were to occur, our business, financial condition and results of operations could suffer as a result.
Portions of the electricity our assets generate is sold on the open market at spot-market prices. A prolonged environment of low prices for natural gas, or other conventional fuel sources such as we are experiencing may, and could continue to, have a material adverse effect on our long-term business prospects, financial condition and results of operations.
Historically low prices for traditional fossil fuels, particularly natural gas, could cause demand for renewable energy to decrease and they have, and may continue to, adversely affect both the future sale price of energy under new PPAs and the current sale price of energy sold on a spot-market basis. Low PPA and spot market power prices, if combined with other factors, can have a material adverse effect on our projects and their respective values and our expected returns, results of operations and cash available for distribution.
The ability of our assets to generate revenue from certain projects depends on having interconnection arrangements and services.
The future success of our assets will depend, in part, on their ability to maintain satisfactory interconnection agreements. If the interconnection or transmission agreement of a project is terminated for any reason, they may not be able to replace it with an interconnection and transmission arrangement on terms as favorable as the existing arrangement, or at all, or they may experience significant delays or costs in connection with securing a replacement. If a network to which one or more of the projects is connected experiences equipment or operational problems or other forms of “down time,” the affected project may lose revenue and be exposed to non-performance penalties and claims from its customers. These may include claims for damages incurred by customers, such as the additional cost of acquiring alternative electricity supply at then-current spot market rates. The owners of the network will not usually compensate electricity generators for lost income due to down time. In addition, our projects may be exposed to a locational basis risk resulting from a difference between where the power is generated and the contracted delivery point. These factors could materially affect these projects, which could negatively affect our business, results of operations, financial condition and cash flow.
- 21 -
Our projects and their obligors are exposed to an increase in climate change or other change in meteorological conditions which could have an impact on electric generation, revenue, insurance costs or the ability of the projects or their obligors to honor their contract obligations, all of which could adversely affect our business, financial condition and results of operations and cash flows.
The electricity produced and revenues generated by a renewable electric generation facility are highly dependent on suitable weather conditions, which are beyond our control. Components of renewable energy systems, such as turbines, solar panels and inverters, could be damaged by natural disasters or severe weather, including wildfires, hurricanes, hailstorms or tornadoes. Furthermore, the potential physical impacts of climate change may impact our projects, including the result of changes in weather patterns (including floods, tsunamis, drought, and rainfall levels), wind speeds, water availability, storm patterns and intensities, and temperature levels. The projects in which we invest will be obligated to bear the expense of repairing the damaged renewable energy systems and replacing spare parts for key components and insurance may not cover the costs or the lost revenue. Natural disasters or unfavorable weather and atmospheric conditions could impair the effectiveness of the renewable energy assets, reduce their output beneath their rated capacity, require shutdown of key equipment or impede operation of the renewable energy assets, which could adversely affect our business, financial condition and results of operations and cash flows. Sustained unfavorable weather could also unexpectedly delay the installation of renewable energy systems, which could result in a delay in our investing in new projects or increase the cost of such projects. The resulting effects of climate change can also have an impact on the cost of, and the ability of a project to obtain, adequate insurance coverage to protect against related losses.
We typically base our investment decisions with respect to each renewable energy facility on the findings of studies conducted on-site prior to construction or based on historical conditions at existing facilities. However, actual climatic conditions at a facility site may not conform to the findings of these studies. Even if an operating project’s historical renewable energy resources are consistent with the long-term estimates, the unpredictable nature of weather conditions often results in daily, monthly and yearly material deviations from the average renewable resources anticipated during a particular period. Therefore, renewable energy facilities in which we invest may not meet anticipated production levels or the rated capacity of the generation assets, which could adversely affect our business, financial condition and results of operations and cash flows.
The amount of electricity renewable energy generation assets produce is also dependent in part on the time of year. For example, because shorter daylight hours in winter months results in less solar irradiation, the generation of particular assets will vary depending on the season. Further, time-of-day pricing factors vary seasonally which contributes to variability of revenues. As a result, we expect the revenue and cash flow from certain of our assets to vary based on the time of year.
In addition, many of the project’s end-customers are large entities with wide ranging activities. A climate related event in a non-related part of the business could have a material adverse impact on the financial strength of such end-customer and their ability to honor their contractual obligations which could negatively impact on revenue and the cash flow of the project and our business.
Operation of the projects in which we invest involves significant risks and hazards customary to our investees that could have a material adverse effect on our business, financial condition, results of operations and cash flows.
The ongoing operation of the projects in which we invest involves risks that include the breakdown or failure of equipment or processes or performance below expected levels of output or efficiency due to wear and tear, latent defect, design error or operator error or force majeure events, among other things. In addition to natural risks such as earthquake, flood, drought, lightning, wildfire, hurricane and wind, other hazards, such as fire, explosion, structural collapse and machinery failure, acts of terrorism or related acts of war, hostile cyber intrusions or other catastrophic events are inherent risks in the operation of a project. These and other hazards can cause significant personal injury or loss of life, severe damage to and destruction of property, plant and equipment and contamination of, or damage to, the environment and suspension of operations. Operation of a project also involves risks that the operator will be unable to transport its product to its customers in an efficient manner due to a lack of transmission capacity. Unplanned outages of projects, including extensions of scheduled outages due to mechanical failures or other problems, occur from time to time and are an inherent risk of the business. Unplanned outages typically increase operation and maintenance expenses and may reduce revenues as a result of selling less electricity or require the project to incur significant costs as a result of obtaining replacement power from third parties in the open market to satisfy forward power sales obligations. The project’s inability to operate its assets efficiently, manage capital expenditures and costs and generate earnings and cash flow could have a material adverse effect on our investment and our business, financial condition, results of operations and cash flows. While the projects maintain insurance, obtain warranties from vendors and obligate contractors to meet certain performance levels, the proceeds of such insurance, warranties or performance guarantees may not cover the lost revenues, increased expenses or liquidated damages payments should the project experience any equipment breakdowns, insurance claims or non-performance by contractors or vendors.
- 22 -
Some of the projects in which we invest may require substantial operating or capital expenditures in the future.
Many of the projects in which we invest are capital intensive and require substantial ongoing expenditures for, among other things, additions and improvements, and maintenance and repair of plant and equipment related to project operations. While we do not typically bear the responsibility for these expenditures, any failure by the equity owner to make necessary operating or capital expenditures could adversely impact project performance. In addition, some of these expenditures may not be recoverable from current or future contractual arrangements.
The use of real property rights that we acquire or are used for our sustainable infrastructure projects may be adversely affected by the rights of lienholders and leaseholders that are superior to those of the grantors of those real property rights to us.
The projects in which we invest often require large areas of land for construction and operation or other easements or access to the underlying land. In addition, we may acquire rights to land or other real property. The rights to own or use the land can be obtained through fee simple title, leases and other rights of use. Although we believe that the real property rights we acquire, or our projects in which we invest, have valid rights to all material easements, licenses and rights of way, not all of such easements, licenses and rights of way are registered against the lands to which they relate and may not bind subsequent owners. Some of our real property rights and projects generally are, and are likely to continue to be, located on land occupied pursuant to long-term easements and leases. The ownership interests in the land subject to these easements and leases may be subject to mortgages securing loans or other liens (such as tax liens) and other easement and lease rights of third parties (such as leases of water, oil or mineral rights) that were created prior to, or are superior to, our or our projects’ easements and leases. As a result, our rights may be subject, and subordinate, to the rights of those third parties. We typically obtain representations or perform title searches or obtain title insurance to protect our real property interest and our investments in our projects against these risks. Such measures may, however, be inadequate to protect against all risk of loss of rights to use the land rights we have acquired or the land on which these projects are located, which could have a material and adverse effect on our land rights, our projects and their financial condition and operating results.
We own land or leasehold interests that are used by renewable energy projects. Negative market conditions or adverse events affecting tenants, or the industries in which they operate, could have an adverse impact on our underwritten returns. Moreover, many of our assets are concentrated in similar geographic locations, which subjects us to an increased risk of significant loss if any property declines in value, incurs a natural disaster or if we are unable to lease a property.
We own land or leasehold interests used by renewable energy projects that are concentrated in a limited number of geographic locations. One consequence of this is that the aggregate returns we realize may be substantially adversely affected by the unfavorable performance of a small number of leases, a significant decline in the market value of any single property or a natural disaster in a concentrated area. Our cash flow depends in part on the ability to lease the real estate to projects or other tenants on economically favorable terms. We could be adversely affected by various facts and events over which we have limited or no control, such as:
• |
lack of demand in areas where our properties are located; |
• |
inability to retain existing tenants and attract new tenants; |
• |
oversupply of space and changes in market rental rates; |
• |
our tenants’ creditworthiness and ability to pay rent, which may be affected by their operations, the current economic situation and competition within their industries from other operators; |
• |
defaults by and bankruptcies of tenants, failure of tenants to pay rent on a timely basis, or failure of tenants to comply with their contractual obligations; |
• |
economic or physical decline of the areas where the properties are located; and |
• |
destruction from natural disasters. |
At any time, any tenant may experience a downturn in its business, including increased operating costs, termination of a PPA or low spot-market prices of products, that may weaken its operating results or overall financial condition, a tenant may delay lease commencement, fail to make rental payments when due, decline to extend a lease upon its expiration, become insolvent or declare bankruptcy. Any tenant bankruptcy or insolvency, leasing delay or failure to make rental payments when due could result in the termination of the tenant’s lease and material losses to us.
If a tenant elects to terminate its lease prior to or upon its expiration or does not renew its lease as it expires, we may not be able to rent or sell the properties or realize our expected value. Furthermore, leases that are renewed and some new leases for properties that are re-leased, may have terms that are less economically favorable than expiring lease terms, or may require us to incur significant costs, such as lease transaction costs. In addition, negative market conditions or adverse events affecting
- 23 -
tenants, or the industries in which they operate, may force us to sell vacant properties for less than their carrying value, which could result in impairments. Any of these events could adversely affect the value of our asset, the cash flow from operations and our ability to make distributions to stockholders and service indebtedness. A significant portion of the costs of owning property, such as real estate taxes, insurance and maintenance, are not necessarily reduced when circumstances cause a decrease in rental revenue from the properties. In a weakened financial condition, tenants may not be able to pay these costs of ownership and we may be unable to recover these operating expenses from them.
Further, the occurrence of a tenant bankruptcy or insolvency could diminish the income we receive from the tenant’s lease or leases. For instance, a bankruptcy court might authorize the tenant to terminate its leases with us. If that happens, our claim against the bankrupt tenant for unpaid future rent would be subject to statutory limitations that most likely would be substantially less than the remaining rent we are owed under the leases. In addition, any claim we have for unpaid past rent, if any, may not be paid in full. As a result, tenant bankruptcies may have a material adverse effect on our results of operations.
In addition, since renewable energy projects are often concentrated in certain states, we would also be subject to any adverse change in the political or regulatory climate in those states or specific counties where such properties are located that could adversely affect our properties and our ability to lease such properties.
Performance of projects where we invest may be harmed by future labor disruptions and economically unfavorable collective bargaining agreements.
A number of the projects where we invest could have workforces that are unionized or that in the future may become unionized and, as a result, are required to negotiate the wages, benefits and other terms with many of their employees collectively. If these projects were unable to negotiate acceptable contracts with any of their unions as existing agreements expire, they could experience a significant disruption of their operations, higher ongoing labor costs and restrictions on their ability to maximize the efficiency of their operations, which could have a material and adverse effect on our business, financial condition and results of operations. In addition, in some jurisdictions where our projects have operations, labor forces have a legal right to strike which may have a negative impact on our business, financial condition and results of operations, either directly or indirectly, for example if a critical upstream or downstream counterparty was itself subject to a labor disruption which impacted the ability of our projects to operate.
We invest in projects that rely on third parties to manufacture quality products or provide reliable services in a timely manner and the failure of these third parties could cause project performance to be adversely affected.
We invest in projects that typically rely on third parties to select, manage or provide equipment or services. Third parties may be responsible for choosing vendors, including equipment suppliers and subcontractors. Project success often depends on third parties who are capable of installing and managing projects and structuring contracts that provide appropriate protection against construction and operational risks. In many cases, in addition to contractual protections and remedies, project owners may seek guaranties, warranties and construction bonding to provide additional protection.
The warranties provided by the third parties and, in some cases, their subcontractors, typically limit any direct harm that results from relying on their products and services. However, there can be no assurance that a supplier or subcontractor will be willing or able to fulfill its contractual obligations and make necessary repairs or replace equipment. In addition, these warranties generally expire within one to five years or may be of limited scope or provide limited remedies. If projects are unable to avail themselves of warranty protection or receive the expected protection under the terms of the guaranties or bonding, we may need to incur additional costs, including replacement and installation costs, which could adversely impact our investment.
Liability relating to environmental matters may impact the value of properties that we may acquire or the properties underlying our assets.
Under various U.S. federal, state and local laws, an owner or operator of real estate or a project may become liable for the costs of removal of certain hazardous substances released from the project or any underlying real property. These laws often impose liability without regard to whether the owner or operator knew of, or was responsible for, the release of such hazardous substances.
The presence of hazardous substances may adversely affect our, or another owner’s, ability to sell a contaminated project or borrow using the project as collateral. To the extent that we, or another project owner, become liable for removal costs, our investment, or the ability of the owner to make payments to us, may be negatively impacted.
We acquire real property rights, make investments in projects that own real property, have collateral consisting of real property and in the course of our business, we may take title to a project or its underlying real estate assets relating to one of our debt financings. In these cases, we could be subject to environmental liabilities with respect to these assets. To the extent that we become liable for the removal costs, our results of operation and financial condition may be adversely affected. The
- 24 -
presence of hazardous substances, if any, may adversely affect our ability to sell the affected real property or the project and we may incur substantial remediation costs, thus harming our financial condition.
Our insurance and contractual protections may not always cover lost revenue, increased expenses or liquidated damages payments.
Although our assets or projects generally have insurance, supplier warranties, subcontractors performance assurances such as bonding and other risk mitigation measures, the proceeds of such insurance, warranties, bonding or other measures may not be adequate to cover lost revenue, increased expenses or liquidated damages payments that may be required in the future.
The repayment of certain of our assets is dependent upon collection of payments from residential customers and we may be indirectly subject to consumer protection laws and regulations.
Certain obligors to which we have credit exposure are, or may be, subject to consumer protection laws, such as federal truth-in-lending, consumer leasing, and equal credit opportunity laws and regulations, as well as state and local sales and finance laws and regulations. Claims arising out of actual or alleged violations of law may be asserted against those obligors by individuals or governmental entities and may exposure them to significant damages or other penalties, including fines, or could reduce the likelihood the residential customer may pay their obligation, which could limit their ability to repay borrowings or make equity distributions to us.
Risks Related to Our Company
We may change our operational policies (including our investment guidelines, strategies and policies) with the approval of our board of directors but without stockholder consent at any time, which may adversely affect the market value of our common stock and our ability to make distributions to our stockholders.
Our board of directors determines our operational policies and may amend or revise our policies, including our policies with respect to acquisitions, dispositions, growth, operations, compensation, indebtedness, capitalization and dividends, or approve transactions that deviate from these policies, without a vote of, or notice to, our stockholders at any time. We may change our investment guidelines, underwriting process and our strategy at any time with the approval of our board of directors, but without the consent of our stockholders, which could result in originating assets that are different in type from, and possibly riskier than, the assets initially contemplated. In addition, our charter provides that our board of directors may authorize us to revoke or otherwise terminate our REIT election, without the approval of our stockholders, if it determines that it is no longer in our best interests to qualify as a REIT. These changes could adversely affect our business, financial condition, results of operations and our ability to make distributions to our stockholders.
Our management and employees depend on information systems and system failures could significantly disrupt our business, which may, in turn, negatively affect the market price of our common stock and our ability to make distributions to our stockholders.
Our underwriting process and our asset and financial management and reporting are dependent on our present and future communications and information systems. Any failure or interruption of these systems could cause delays or other problems in our originating, financing, investing, asset and financial management and reporting activities, which could have a material adverse effect on our operating results.
We contract with information technology service providers where, in part, we rely upon their systems and controls for the quality of the data provided. The inappropriate establishment and maintenance of these systems and controls could cause information that we use to operate our business to be unavailable or inaccurate and could negatively impact our financial results.
Our information technology architecture is partially outsourced. These systems and processes may be either internet based or through traditional outsourced functions and certain of these arrangements are new or emerging. When we contract with these service providers we attempt to evaluate the quality of their systems and controls before we execute the arrangement and may rely on third party reviews and audits of these service providers and attempt to implement certain processes to ensure the quality of the data received from these service providers. Because of the nature and maturity of the technology such efforts may be unsuccessful or incomplete and the unavailability of these systems or the inaccurate data provided from these service providers could negatively impact our financial results.
Cybersecurity risks and cyber incidents may adversely affect our business by causing a disruption to our operations, a compromise or corruption of our confidential information, a misappropriation of funds, and/or damage to our business relationships, all of which could negatively impact our financial results.
A cyber incident is considered to be any adverse event that threatens the confidentiality, integrity or availability of our information resources. These incidents may be an intentional attack or an unintentional event and could involve gaining unauthorized access to our information systems for purposes of misappropriating assets, stealing confidential information,
- 25 -
corrupting data or causing operational disruption. The risk of a security breach or disruption, particularly through cyber-attacks or cyber intrusions, including by computer hackers, nation-state affiliated actors, and cyber terrorists, has generally increased as the number, intensity and sophistication of attempted attacks and intrusions from around the world have increased. The result of these incidents may include disrupted operations, misstated or unreliable financial data, disrupted market price of our common stock, misappropriation of assets, liability for stolen assets or information, increased cybersecurity protection and insurance cost, regulatory enforcement, litigation and damage to our relationships. These risks require continuous and likely increasing attention and other resources from us to, among other actions, identify and quantify these risks, upgrade and expand our technologies, systems and processes to adequately address them and provide periodic training for our employees to assist them in detecting phishing, malware and other schemes. Such attention diverts time and other resources from other activities and there is no assurance that our efforts will be effective. Potential sources for disruption, damage or failure of our information technology systems include, without limitation, computer viruses, security breaches, human error, cyber- attacks, natural disasters and defects in design. Additionally, due to the size and nature of our company, we rely on third-party service providers for many aspects of our business. We can provide no assurance that the networks and systems that our third-party vendors have established or use will be effective. As our reliance on technology has increased, so have the risks posed to both our information systems and those provided by third-party service providers. Our processes, procedures and internal controls that are designed to mitigate cybersecurity risks and cyber intrusions do not guarantee that a cyber incident will not occur or that our financial results, operations or confidential information will not be negatively impacted by such an incident.
We may seek to expand our business internationally, which will expose us to additional risks that we do not face in the United States, which could have an adverse effect on our business, financial condition and operating results.
We generate substantially all of our revenue from operations in the United States. We may seek to expand our revenue and projects outside of the United States in the future. These operations will be subject to a variety of risks that we do not face in the United States, including risk from changes in foreign country regulations, infrastructure, legal systems and markets. Other risks include possible difficulty in repatriating overseas earnings and fluctuations in foreign currencies.
Our overall success in international markets will depend, in part, on our ability to succeed in different legal, regulatory, economic, social and political conditions. We may not be successful in developing and implementing policies and strategies that will be effective in managing these risks in each country where we decide to do business. Our failure to manage these risks successfully could harm our international projects, reduce our international income or increase our costs, thus adversely affecting our business, financial condition and operating results.
We may seek to expand our business in part through future acquisitions or other similar investments.
As we grow our business, we have used, and will continue to use, acquisitions of, or other types of transactions such as equity or convertible debt investments in, companies or assets to invest in new or different projects or markets, expand our project skill-sets and capabilities, expand our geographic markets, add experienced management and increase our product and service offerings. There are a number of risks associated with these transactions and we may not achieve our goals in the transaction. Such transaction could disrupt our business, cause dilution to our stockholders and harm our business, financial condition or operating results. In addition, the time and effort involved to identify candidates and consummate such transactions may divert members of our management from the operations of our company.
Risks Relating to Regulation
We cannot predict the unintended consequences and market distortions that may stem from far-ranging governmental intervention in the economic and financial system or from regulatory reform of the oversight of financial markets.
The U.S. federal government, the Federal Reserve Board of Governors, the U.S. Treasury, the SEC, U.S. Congress and other governmental and regulatory bodies have taken, are taking or may in the future take, various actions to address the financial crisis or other areas of regulatory concern, such as the Dodd—Frank Wall Street Reform and Consumer Protection Act (the “Dodd-Frank Act”). Such actions could have a dramatic impact on our business, results of operations and financial condition, and the cost of complying with any additional laws and regulations or the elimination or reduction in scope of various existing laws and regulations could have a material adverse effect on our financial condition and results of operations. The far-ranging government intervention in the economic and financial system may carry unintended consequences and cause market distortions. We are unable to predict at this time the extent and nature of such unintended consequences and market distortions, if any. The inability to evaluate the potential impacts could have a material adverse effect on the operations of our business.
Loss of our 1940 Act exemption would adversely affect us, the market price of shares of our common stock and our ability to distribute dividends.
We conduct our operations so that we are not required to register as an investment company under the 1940 Act. Section 3(a)(1)(A) of the 1940 Act defines an investment company as any issuer that is or holds itself out as being engaged primarily in the business of investing, reinvesting or trading in securities. Section 3(a)(1)(C) of the 1940 Act defines an
- 26 -
investment company as any issuer that is engaged or proposes to engage in the business of investing, reinvesting, owning, holding or trading in securities and owns or proposes to acquire investment securities having a value exceeding 40% of the value of the issuer’s total assets (exclusive of U.S. Government securities and cash items) on a non-consolidated basis, which we refer to as the 40% test. Excluded from the term “investment securities,” among other things, are U.S. Government securities and securities issued by majority-owned subsidiaries that are not themselves investment companies and are not relying on the exemption from the definition of investment company set forth in Section 3(c)(1) or Section 3(c)(7) of the 1940 Act.
We conduct our businesses primarily through our subsidiaries and our operations so that we comply with the 40% test. The securities issued by any wholly-owned or majority-owned subsidiaries that we hold or may form in the future that are exempted from the definition of “investment company” based on Section 3(c)(1) or 3(c)(7) of the 1940 Act, together with any other investment securities we may own, may not have a value in excess of 40% of the value of our total assets on a non-consolidated basis. Certain of our subsidiaries rely on or will rely on an exemption from registration as an investment company under the 1940 Act pursuant to Section 3(c)(5)(C) of the 1940 Act, which is available for entities which are not primarily engaged in issuing redeemable securities, face-amount certificates of the installment type or periodic payment plan certificates and which are primarily engaged in the business of purchasing or otherwise acquiring mortgages and other liens on and interests in real estate. This exemption generally requires that at least 55% of such subsidiaries’ portfolios must be comprised of qualifying assets and at least 80% of each of their portfolios must be comprised of qualifying assets and real estate-related assets under the 1940 Act. Consistent with guidance published by the SEC staff, we intend to treat as qualifying assets for this purpose loans secured by projects for which the original principal amount of the loan did not exceed 100% of the value of the underlying real property portion of the collateral when the loan was made. We intend to treat as real estate-related assets non-controlling equity interests in joint ventures that own projects whose assets are primarily real property. In general, with regard to our subsidiaries relying on Section 3(c)(5)(C), we rely on other guidance published by the SEC or its staff or on our analyses of guidance published with respect to other types of assets to determine which assets are qualifying real estate assets and real estate-related assets.
In addition, one or more of our subsidiaries qualifies for an exemption from registration as an investment company under the 1940 Act pursuant to either Section 3(c)(5)(A) of the 1940 Act, which is available for entities which are not engaged in the business of issuing redeemable securities, face-amount certificates of the installment type or periodic payment plan certificates, and which are primarily engaged in the business of purchasing or otherwise acquiring notes, drafts, acceptances, open accounts receivable, and other obligations representing part or all of the sales price of merchandise, insurance, and services, or Section 3(c)(5)(B) of the 1940 Act, which is available for entities primarily engaged in the business of making loans to manufacturers, wholesalers, and retailers of, and to prospective purchasers of, specified merchandise, insurance, and services. These exemptions generally require that at least 55% of such subsidiaries’ portfolios must be comprised of qualifying assets that meet the requirements of the exemption. We intend to treat energy efficiency loans where the loan proceeds are specifically provided to finance equipment, services and structural improvements to properties and other facilities and renewable energy and other sustainable infrastructure projects or improvements as qualifying assets for purposes of these exemptions. In general, we also expect, with regard to our subsidiaries relying on Section 3(c)(5)(A) or (B), to rely on guidance published by the SEC or its staff, including reliance on a no-action letter obtained in connection with Sections 3(c)(5)(A) and 3(c)(5)(B) of the 1940 Act, or on our analyses of guidance published with respect to other types of assets to determine which assets are qualifying assets under the exemptions.
Although we monitor the portfolios of our subsidiaries relying on the Section 3(c)(5)(A), (B) or (C) exemptions periodically and prior to each acquisition, there can be no assurance that such subsidiaries will be able to maintain their exemptions. Qualification for exemptions from registration under the 1940 Act will limit our ability to make certain investments. For example, these restrictions will limit the ability of these subsidiaries to make loans that are not secured by real property or that do not represent part or all of the sales price of merchandise, insurance, and services.
There can be no assurance that the laws and regulations governing the 1940 Act, including the Division of Investment Management of the SEC providing more specific or different guidance regarding these exemptions, will not change in a manner that adversely affects our operations. For example, on August 31, 2011, the SEC issued a concept release (No. IC-29778; File No. SW7-34-11, Companies Engaged in the Business of Acquiring Mortgages and Mortgage-Related Instruments) pursuant to which it is reviewing the scope of the exemption from registration under Section 3(c)(5)(C) of the 1940 Act. While the SEC has yet to provide additional information on its position relating to these exemptions and timing of any future changes to the exemptions remain unknown, any additional guidance from the SEC or its staff from this process or in other circumstances could provide additional flexibility to us, or it could further inhibit our ability to pursue the strategies we have chosen. If we or our subsidiaries fail to maintain an exemption from the 1940 Act, we could, among other things, be required either to (1) change the manner in which we conduct our operations to avoid being required to register as an investment company, (2) effect sales of our assets in a manner that, or at a time when, we would not otherwise choose to do so or (3) register as an investment company, any of which could negatively affect our business, our ability to make distributions, our financing strategy and the market price for our shares of common stock.
- 27 -
We have not requested the SEC or its staff to approve our treatment of any company as a majority-owned subsidiary and neither the SEC nor its staff has done so. If the SEC or its staff were to disagree with our treatment of one or more companies as majority-owned subsidiaries, we would need to adjust our strategy and our assets in order to continue to pass the 40% test. Any such adjustment in our strategy could have a material adverse effect on us.
Rapid changes in the values of our assets may make it more difficult for us to maintain our qualification as a REIT or our exemption from the 1940 Act.
If the market value or income potential of our assets changes as a result of changes in interest rates, general market conditions, government actions or other factors, we may need to adjust the portfolio mix of our real estate assets and income or liquidate our non-qualifying assets to maintain our REIT qualification or our exemption from the 1940 Act. If changes in asset values or income occur quickly, this may be especially difficult to accomplish. This difficulty may be exacerbated by the illiquid nature of the assets we may own. We may have to make decisions that we otherwise would not make absent the REIT and 1940 Act considerations.
Because we expect to distribute substantially all of our REIT taxable income to our stockholders, we will need additional capital to finance our growth and such capital may not be available on favorable terms or at all.
We will need additional capital to fund our growth. U.S. federal income tax law generally requires that a REIT distribute annually at least 90% of its REIT taxable income, without regard to the deduction for dividends paid and excluding net capital gains, and that it pay tax at regular corporate rates to the extent that it annually distributes greater than 90% but less than 100% of such REIT taxable income. Because we intend to grow our business, this limitation may require us to incur additional debt or raise additional equity at a time when it may be disadvantageous to do so. We cannot make any assurance that debt and equity financing will be available to us on favorable terms, or at all, and debt financings may be restricted by the terms of any of our outstanding borrowings. If additional funds are not available to us, we could be forced to curtail or cease new asset originations and acquisitions, which could have a material adverse effect on our business and financial condition.
The preparation of our financial statements involves use of estimates, judgments and assumptions, and our financial statements may be materially affected if our estimates prove to be inaccurate.
Financial statements prepared in accordance with GAAP require the use of estimates, judgments and assumptions that affect the reported amounts. Different estimates, judgments and assumptions reasonably could be used that would have a material effect on the financial statements, and changes in these estimates, judgments and assumptions are likely to occur from period to period in the future. Significant areas of accounting requiring the application of management’s judgment include but are not limited to determining the fair value of our assets.
These estimates, judgments and assumptions are inherently uncertain, and, if they prove to be wrong, then we face the risk that charges to income will be required. Any charges could significantly harm our business, financial condition, results of operations and the price of our securities. See Management’s Discussion and Analysis of Financial Condition and Results of Operations—Critical Accounting Policies and Use of Estimates for a discussion of the accounting estimates, judgments and assumptions that we believe are the most critical to an understanding of our business, financial condition and results of operations.
Risks Related to Borrowings
We use leverage in executing our business strategy, which may adversely affect the returns on our assets and may reduce cash available for distribution to our stockholders, as well as increase losses when economic conditions are unfavorable.
We use debt to finance our assets, including credit facilities, recourse and non-recourse debt as well as securitizations and syndications. Changes in the financial markets and the economy generally could adversely affect one or more of our lenders or potential lenders and could cause one or more of our lenders, potential lenders or institutional investors to be unwilling or unable to provide us with financing or participate in securitizations or could increase the costs of that financing or securitization. If we are unable to repay or refinance the remaining balance of this debt, or if the terms of any available refinancing are not favorable, we may be forced to liquidate assets or incur higher costs which may significantly harm our business, financial condition, results of operations, and our ability to make distributions, which could cause the value of our common stock to decline. The return on our assets and cash available for distribution to our stockholders may be reduced to the extent that market conditions prevent us from leveraging our assets or increase the cost of our financing relative to the income that can be derived from the assets acquired. Increases in our financing costs will reduce cash available for distributions to stockholders. We may not be able to meet our financing obligations and, to the extent that we cannot, we risk the loss of some or all of our assets to liquidation or sale to satisfy the obligations.
- 28 -
An increase in our borrowing costs relative to the interest we receive on our assets may adversely affect our profitability and our cash available for distribution to our stockholders. Our borrowings may have a shorter duration than our assets.
As some of our borrowings will have a remaining balance at maturity, we may be required to enter into new borrowings at higher rates or to sell certain of our assets to repay the loan. In addition, any increases in the federal funds rate announced by the Federal Reserve Board of Governors is likely to increase shorter-term interest rates and may lower the difference between shorter-term interest rates and longer-term interest rates which would result in a flattening or inversion of the yield curve. Our credit facilities have rates that adjust on a frequent basis based on prevailing short-term interest rates. An increase in interest rates, or a flattening or inversion of the yield curve, would reduce the spread between the returns on our assets which are typically priced using longer-term interest rates and the cost of any new borrowings or borrowings where the interest rate adjusts to market rates or is based on shorter-term rates. This change in interest rates would adversely affect our earnings and, in turn, cash available for distribution to our stockholders. In addition, as we may use short-term borrowings including repurchase agreements and warehouse facilities that are generally short-term commitments of capital, lenders may respond to market conditions making it more difficult for us to secure continued financing. If we are not able to renew our then existing facilities or arrange for new financing on terms acceptable to us, or if we default on our covenants or are otherwise unable to access funds under any of these facilities, we may have to curtail entering into new transactions and/or dispose of assets. We will face these risks given that a number of our borrowings have a shorter duration than the assets they finance.
We do not have a formal policy limiting the amount of debt we may incur. Our board of directors may change our leverage target without stockholder approval.
Although we are not restricted by any regulatory requirements to maintain our leverage ratio at or below any particular level, the amount of leverage we may deploy for particular assets will depend upon the availability of particular types of financing and our assessment of the credit, liquidity, price volatility and other risks of those assets and the credit quality of our financing counterparties. We have established leverage targets which are discussed in Item 7, Management’s Discussion and Analysis of Financial Conditions and Results of Operations—Liquidity and Capital Resources. However, our charter and bylaws do not limit the amount or type of indebtedness we can incur, and our board of directors has changed, and has the discretion to deviate from or change at any time in the future, our leverage policy, which could result in an investment portfolio with a different risk profile. We utilize non-recourse facilities on certain types of assets that have significantly higher leverage. On these facilities, the lenders’ primary recourse is to the pledged assets and if the value of the pledged assets is below the value of the debt or if we default on a facility, the lender would be able to foreclose on all the pledged assets, which would result in losses and reduce our assets and the cash available for distributions to stockholders. We may apply too much leverage to our assets or may employ an inefficient financing strategy to our assets.
The use of securitizations and special purpose entities would expose us to additional risks.
We presently hold, and to the extent that we securitize loans in the future, we anticipate that we will often hold the most junior certificates or the residual value associated with a securitization. We may also establish other funds or special purpose entities, where we would hold only a partial or subordinate interest or a residual value after taking into account our non-recourse debt facilities or a right to participate in the profits of such entity once it achieves a predefined threshold. As a holder of the residual value or other such interests, we are more exposed to losses on the underlying collateral because the interest we retain in the securitization vehicle or other entity would be subordinate to the more senior notes or interests issued to investors and we would, therefore, absorb all of the losses, up to the value of our interests, sustained with respect to the underlying assets before the owners of the notes or other interests experience any losses. In addition, the inability to securitize our portfolio or assets within our portfolio could hurt our performance and our ability to grow our business.
We also use various special purpose entities to own and finance our assets. These subsidiaries incur various types of debt, which can be used to finance one or more of our assets. This debt is typically structured as non-recourse debt, which means it is repayable solely from the revenue from the investment financed by the debt and is secured by the related physical assets, major contracts, cash accounts and in some cases, a pledge of our ownership interests in the subsidiaries involved in the projects. Although this subsidiary debt is typically non-recourse to us, we make certain representations and warranties or enter into certain guaranties of our subsidiary’s obligations or covenants to the non-recourse debt holder, the breach of which may require us to make payments to the lender. We may also from time to time determine to provide financial support to the subsidiary in order to maintain rights to the project or otherwise avoid the adverse consequences of a default. In the event a subsidiary defaults on its indebtedness, its creditors may foreclose on the collateral securing the indebtedness, which may result in us losing our ownership interest in some or all of the subsidiary’s assets. The loss of our ownership interest in a subsidiary or some or all of a subsidiary’s assets could have a material adverse effect on our business, financial condition and operating results.
- 29 -
Our existing credit facilities and debt contain, and any future financing facilities may contain, covenants that restrict our operations and may inhibit our ability to grow our business and increase revenues.
Our existing credit facilities and debt contain, and any future financing facilities may contain, various affirmative and negative covenants, including maintenance of an interest coverage ratio and limitations on the incurrence of liens and indebtedness, investments, fundamental organizational changes, dispositions, changes in the nature of business, transactions with affiliates, use of proceeds and stock repurchases. In addition, the terms of our non-recourse debt include restrictions and covenants, including limitations on our ability to transfer or incur liens on the assets that secure the debt. For further information see Item 7. Management’s Discussion and Analysis of Financial Condition and Results of Operations—Liquidity and Capital Resources.
The covenants and restrictions included in our existing financings do, and the covenants and restrictions to be included in any future financings may, restrict our ability to, among other things:
• |
incur or guarantee additional debt; |
• |
make certain investments, originations or acquisitions; |
• |
make distributions on or repurchase or redeem capital stock; |
• |
engage in mergers or consolidations; |
• |
reduce liquidity below certain levels; |
• |
grant liens; |
• |
have a tangible net worth below a defined threshold; |
• |
incur operating losses for more than a specified period; and |
• |
enter into transactions with affiliates. |
Our non-recourse debt limits our ability to take action with regard to the assets pledged as security for the debt. These restrictions, as well as any other covenants contained in any future financings, may interfere with our ability to obtain financing, or to engage in other business activities, which may significantly limit or harm our business, financial condition, liquidity and results of operations. Our financing agreements may contain cross-default provisions, so that if a default occurs under any one agreement, the lenders under our other agreements could also declare a default. A default and resulting repayment acceleration could significantly reduce our liquidity, which could require us to sell our assets to repay amounts due and outstanding. This could also significantly harm our business, financial condition, results of operations, and our ability to make distributions, which could cause the value of our common stock to decline and adversely affect our ability to qualify, or remain qualified, as a REIT. A default will also significantly limit our financing alternatives such that we will be unable to pursue our leverage strategy, which could curtail the returns on our assets.
In addition, certain of our financing arrangements contain provisions that provide for a preference in cash flow allocations to the lender from our assets or an acceleration of principal payments owed when certain conditions are present related to the underlying assets that serve as collateral for the financing. These provisions may limit our ability to obtain distributions from the underlying assets and could impact our cash flow and expected returns.
We have issued senior unsecured notes which require us to maintain a certain amount of unencumbered assets as a part of our portfolio, as well as to maintain certain debt coverage service ratios in order to issue additional notes. These provisions may limit our ability to leverage certain assets and limit our overall debt levels.
We will have to pay off the remaining balance or refinance our borrowings when they become due. The failure to be able to pay off the remaining balance or refinance such borrowings or an increase in interest rates of such refinancing could have a material impact on our business.
Some of our borrowings will have a remaining balance when they become due. If our subsidiary is unable to repay or refinance the remaining balance of this debt, or if the terms of any available refinancing are not favorable, we may be forced to liquidate assets or incur higher costs which may significantly harm our business, financial condition, results of operations, and our ability to make distributions, which could cause the value of our common stock to decline.
- 30 -
If a counterparty to repurchase transactions defaults on its obligation to resell the underlying security back to us at the end of the transaction term, or if the value of the underlying security has declined as of the end of that term, or if we default on obligations under the repurchase agreement, we may lose money on repurchase transactions.
In repurchase transactions, we will generally sell certain of our assets to lenders (i.e., repurchase agreement counterparties) and receive cash from the lenders. The lenders will be obligated to resell the same assets back to us at the end of the term of the transaction. Because the cash we will receive from the lender when we initially sell the assets to the lender is less than its value, if the lender defaults on its obligation to resell the same asset back to us we would incur a loss on the transaction equal to the differential in value at which the lender purchased the asset (assuming there was no other change in value). We would also lose money on a repurchase transaction if the value of the underlying asset has declined as of the end of the transaction term, as we would have to repurchase the assets for their initial value but would receive loans worth less than that amount. We may also be forced to sell assets at significantly depressed prices to meet margin calls, post additional collateral and maintain adequate liquidity, which could cause us to incur losses. Moreover, to the extent we are forced to sell assets at such time, given market conditions, we may be selling at the same time as others facing similar pressures, which could exacerbate a difficult market environment and which could result in our incurring significantly greater losses on our sale of such assets. In an extreme case of market duress, a market may not even be present for certain of our assets at any price. Such a situation would likely result in a rapid deterioration of our financial condition and possibly necessitate a filing for protection under the United States Bankruptcy Code (the “Bankruptcy Code”). Further, if we default on one of our obligations under a repurchase transaction, the lender will be able to terminate the transaction and cease entering into any other repurchase transactions with us. Our repurchase agreements may contain cross-default provisions, so that if a default occurs under any one agreement, the lenders under any other of our agreements could also declare a default. If a default occurs under any of our repurchase agreements and the lenders terminate one or more of our repurchase agreements, we may need to enter into replacement repurchase agreements with different lenders. There can be no assurance that we will be successful in entering into such replacement repurchase agreements on the same terms as the repurchase agreements that were terminated or at all. Any losses we incur on our repurchase transactions could adversely affect our earnings and thus our cash available for distribution to our stockholders. In the event of our insolvency or bankruptcy, certain repurchase agreements may qualify for special treatment under the Bankruptcy Code, the effect of which, among other things, would be to allow the lender under the applicable repurchase agreement to avoid the automatic stay provisions of the Bankruptcy Code and to foreclose on the collateral agreement without delay, which could ultimately reduce the amounts we could otherwise recover.
Uncertainty regarding the London interbank offered rate (“LIBOR”) may adversely impact our borrowings and interest rate hedging.
In July 2017, the United Kingdom Financial Conduct Authority announced that it would cease to compel banks to participate in settling LIBOR as a benchmark by the end of 2021 (the “LIBOR Transition Date”). It is unclear whether new methods of calculating LIBOR will be established or other changes made such that LIBOR continues to exist after 2021. The Alternative Reference Rates Committee, a steering committee comprised of large U.S. financial institutions convened by the U.S. Federal Reserve, has recommended the Secured Overnight Financing Rate (“SOFR”) as a more robust reference rate alternative to U.S. dollar LIBOR. SOFR is calculated based on overnight transactions under repurchase agreements, backed by Treasury securities. SOFR is observed and backward looking, which stands in contrast with LIBOR under the current methodology, which is an estimated forward-looking rate and relies, to some degree, on the expert judgment of submitting panel members. Given that SOFR is a secured rate backed by government securities, it will be a rate that does not take into account bank credit risk (as is the case with LIBOR). SOFR is therefore likely to be lower than LIBOR and is less likely to correlate with the funding costs of financial institutions. Whether or not SOFR attains market traction as a LIBOR replacement tool remains in question. As such, the future of LIBOR at this time is uncertain. Some of our debt and interest rate hedge agreements, including a portion of our credit facility, are linked to LIBOR. Before the LIBOR Transition Date, we may need to amend the debt and/or interest rate hedge agreements that utilize LIBOR as a factor in determining the interest rate to reflect any new standard or modification that is established, if any. However, these efforts may not be successful in mitigating the legal and financial risk from changing the reference rate in our legacy agreements. In addition, any resulting differences in interest rate standards among our assets and our financing arrangements may result in interest rate mismatches between our assets and the borrowings used to fund such assets. Furthermore, the transition away from LIBOR may adversely impact our ability to manage and hedge exposures to fluctuations in interest rates using derivative instruments. There is no guarantee that a transition from LIBOR to an alternative will not result in financial market disruptions, significant increases in benchmark rates, or borrowing costs to borrowers, any of which could have an adverse effect on our business, results of operations, financial condition, and stock price.
- 31 -
Risks Related to Hedging
We, or the projects in which we invest, enter into hedging transactions that could expose us to contingent liabilities or additional credit risk in the future and adversely impact our financial condition.
Subject to maintaining our qualification as a REIT, part of our strategy, or the strategy of the projects in which we invest, involves entering into hedging transactions that could require us to fund cash payments in certain circumstances (e.g., the early termination of the hedging instrument caused by an event of default or other early termination event, or the decision by a counterparty to request margin it is contractually owed under the terms of the hedging instrument). The amount due would be equal to the unrealized loss of the open swap positions with the respective counterparty and could also include other fees and charges. These economic losses will be reflected in our, or the project’s, financial statements, and our, or the project’s, ability to fund these obligations will depend on the liquidity of our, or the project’s, assets and access to capital at the time, and the need to fund these obligations could adversely impact our financial condition.
In addition, over-the-counter hedges entered into to hedge interest rates, credit risk or commodity prices involve risk since they often are not traded on regulated exchanges or cleared through a central counterparty. We would remain exposed to our counterparty’s ability to perform on its obligations under each hedge and cannot look to the creditworthiness of a central counterparty for performance. As a result, if a hedging counterparty cannot perform under the terms of the hedge, we would not receive payments due under that hedge, we may lose any unrealized gain associated with the hedge and the hedged liability would cease to be hedged. While we would seek to terminate the relevant hedge transaction and may have a claim against the defaulting counterparty for any losses, including unrealized gains, there is no assurance that we would be able to recover such amounts or to replace the relevant hedge on economically viable terms or at all. In such case, we could be forced to cover our unhedged liabilities at the then current market price. We may also be at risk for any collateral we have pledged to secure our obligations under the hedge if the counterparty becomes insolvent or files for bankruptcy.
Furthermore, our interest rate swaps and other hedge transactions are subject to increasing statutory and other regulatory requirements and, depending on the identity of the counterparty, applicable international requirements. Recently, new regulations have been promulgated by U.S. and foreign regulators to strengthen the oversight of swaps, and any further actions taken by such regulators could constrain our strategy or increase our costs, either of which could materially and adversely impact our results of operations.
In addition, the Dodd-Frank Act requires certain derivatives, including certain interest rate swaps, to be executed on a regulated market and cleared through a central counterparty. Unlike over-the-counter swaps, the counterparty for the cleared swaps is the clearing house, which reduces counterparty risk. However, cleared swaps require us to appoint clearing brokers and to post margin in accordance with the clearing house’s rules, which has resulted in increased costs for cleared swaps compared to over-the-counter swaps. Our over-the-counter hedges with swap dealers became subject to margin regulations promulgated by U.S. regulators on March 1, 2017, which regulations increased the required margin, and the cost to us of over-the-counter swaps. The margin requirements for both cleared and uncleared swaps also limit eligible margin to cash and specified types of securities, which may further increase the costs of hedging and induce us to change or reduce the use of hedging transactions. The margin regulations generally do not apply to any over-the-counter swaps that were entered into prior to the effective date of such regulations.
In addition, any mortgage real estate investment trust that trades in swaps may be considered a "commodity pool," which would cause its operator to be regulated as a "commodity pool operator" (a "CPO"). In December 2012, the Commodity Futures Trading Commission ("CFTC"), issued a no-action letter giving relief to operators of mortgage REITs from any applicable CPO registration requirement. In order for us to qualify for the no-action relief, we must, among other non-operation requirements: (1) limit our initial margin and premiums for commodity interests (swaps and exchange-traded derivatives subject to the jurisdiction of the CFTC) to no more than 5% of the fair market value of our total assets; and (2) limit our net income from commodity interests that are not "qualifying hedging transactions" to less than 5% of its gross income. The need to operate within these parameters could limit the use of swaps and other commodity interests by us below the level that we would otherwise consider optimal or may lead to the registration of our company, our management team or our directors as commodity pool operators, which will subject us to additional regulatory oversight, compliance and costs.
In addition, the projects in which we invest, may enter into various forms of hedging including interest rate and power price hedging. To the extent they enter into such hedges, the financial results of the project will be exposed to similar risks as described above which could adversely impact our results of operations.
- 32 -
If we, or our projects, choose not to pursue, or fail to qualify for, hedge accounting treatment, our operating results may be impacted because losses on the derivatives that we enter into may not be offset by a change in the fair value of the related hedged transaction.
We, or our projects, may choose not to pursue, or fail to qualify for, hedge accounting treatment relating to derivative and hedging transactions. We, or our projects, may fail to qualify for hedge accounting treatment for a number of reasons, including if we, or our projects, use instruments that do not meet the Accounting Standards Codification (“ASC”) Topic 815 definition of a derivative, we, or our projects, fail to satisfy ASC Topic 815 hedge documentation and hedge effectiveness assessment requirements or the hedge relationship is not highly effective. If we, or our projects, fail to qualify for, or choose not to pursue, hedge accounting treatment, our, or our projects, operating results may be impacted because losses on the derivatives that we, or our projects, enter into may not be offset by a change in the fair value of the related hedged transaction.
Risks Related to Our Common Stock
There can be no assurance that an active trading market for our common stock will continue, which could cause our common stock to trade at a discount and make it difficult for holders of our common stock to sell their shares.
Our common stock is listed on the New York Stock Exchange (“NYSE”). However, there can be no assurance that an active trading market for our common stock will continue, which could cause our common stock to trade at a discount to historical prices. Accordingly, no assurance can be given as to the ability of our stockholders to sell their common stock or the price that our stockholders may obtain for their common stock. Some of the factors that could negatively affect the market price of our common stock include:
• |
our actual or projected operating results, financial condition, cash flows and liquidity or changes in business strategy or prospects; |
• |
changes in the mix of our investment products and services, including the level of securitizations or fee income in any quarter; |
• |
actual or perceived conflicts of interest with individuals, including our executives; |
• |
our ability to arrange financing for projects; |
• |
equity issuances by us, or share resales by our stockholders, or the perception that such issuances or resales may occur; |
• |
seasonality in construction and demand for our investments; |
• |
actual or anticipated accounting problems; |
• |
publication of research reports about us or the sustainable infrastructure industry; |
• |
changes in market valuations of similar companies; |
• |
adverse market reaction to any increased indebtedness we may incur in the future; |
• |
commodity price changes; |
• |
interest rate changes; |
• |
additions to or departures of our key personnel; |
• |
speculation or negative publicity in the press or investment community; |
• |
our failure to meet, or the lowering of, our earnings estimates or those of any securities analysts; |
• |
increases in market interest rates, which may lead investors to demand a higher distribution yield for our common stock, and would result in increased interest expenses on certain of our debt; |
• |
changes in governmental policies, regulations or laws; |
• |
failure to qualify, or maintain our qualification, as a REIT or failure to maintain our exemption from registration as an investment company under the 1940 Act; |
• |
price and volume fluctuations in the stock market generally; and |
• |
general market and economic conditions, including the current state of the credit and capital markets. |
Market factors unrelated to our performance could also negatively impact the market price of our common stock. One of the factors that investors may consider in deciding whether to buy or sell our common stock is our distribution rate as a percentage of our stock price relative to market interest rates. If market interest rates increase, prospective investors may
- 33 -
demand a higher distribution rate or seek alternative investments paying higher dividends or interest. As a result, interest rate fluctuations and conditions in capital markets can affect the market value of our common stock.
Common stock and preferred stock eligible for future sale may have adverse effects on our share price.
Subject to applicable law, our board of directors, without stockholder approval, may authorize us to issue additional authorized and unissued shares of common stock and preferred stock on the terms and for the consideration it deems appropriate.
We cannot predict the effect, if any, of future sales of our common stock or the availability of shares for future sales, on the market price of our common stock. Sales of substantial amounts of common stock or the perception that such sales could occur may adversely affect the prevailing market price for our common stock.
We cannot assure you of our ability to make distributions in the future. If our portfolio of assets fails to generate sufficient income and cash flow, we could be required to sell assets, borrow funds, raise additional equity or make a portion of our distributions in the form of a taxable stock distribution or distribution of debt securities.
We are generally required to distribute to our stockholders at least 90% of our REIT taxable income (without regard to the deduction for dividends paid and excluding net capital gains) each year for us to qualify, and maintain our qualification, as a REIT under the Internal Revenue Code of 1986, as amended (the “Internal Revenue Code”). Our current policy is to pay quarterly distributions, which on an annual basis is expected to equal or substantially exceed 90% or more of our REIT taxable income. In the event that our board of directors authorizes distributions in excess of the income or cash flow generated from our assets, we may make such distributions from the proceeds of future offerings of equity or debt securities or other forms of debt financing or the sale of assets.
Our ability to make distributions may be adversely affected by a number of factors. Therefore, although we anticipate making quarterly distributions to our stockholders, our board of directors has the sole discretion to determine the timing, form and amount of any distributions to our stockholders. If our portfolio of assets fails to generate sufficient income and cash flow, we could be required to sell assets, borrow funds, raise additional equity or make a portion of our distributions in the form of a taxable stock distribution or distribution of debt securities. To the extent that we are required to sell assets in adverse market conditions or borrow funds at unfavorable rates, our results of operations could be materially and adversely affected. If we raise additional equity, our stock price could be materially and adversely affected. Our board of directors will make determinations regarding distributions based upon various factors, including our earnings, our financial condition, our liquidity, our debt covenants, maintenance of our REIT qualification, applicable provisions of the MGCL and other factors as our board of directors may deem relevant from time to time. We believe that a change in any one of the following factors could adversely affect our results of operations and impair our ability to make distributions to our stockholders:
• |
our ability to make profitable investments; |
• |
margin calls or other expenses that reduce our cash flow; |
• |
defaults in our asset portfolio or decreases in the value of our portfolio; |
• |
the cash flow we receive from our assets, including those subject to non-recourse debt; and |
• |
the fact that anticipated operating expense levels may not prove accurate, as actual results may vary from estimates. |
As a result, no assurance can be given that we will be able to make distributions to our stockholders at any time in the future or that the level of any distributions we do make to our stockholders will achieve a market yield or increase or even be maintained over time, any of which could materially and adversely affect us.
In addition, all or a portion of the distributions that we make to our stockholders will be taxable as ordinary income, subject to a deduction equal to 20% of the amount of such dividends for taxable years beginning in 2018 and ending in 2025, which generally reduces the effective U.S. federal income tax rate applicable to such dividends. However, a portion of our distributions may be designated by us as long-term capital gains to the extent that they are attributable to capital gain income recognized by us or may constitute a return of capital to the extent that they exceed our earnings and profits as determined for tax purposes. A return of capital is not taxable income but has the effect of reducing the basis of a stockholder’s investment in shares of our common stock.
- 34 -
Future offerings of debt or equity securities, which may rank senior to our common stock, may adversely affect the market price of our common stock.
Our present debt ranks, and any future debt would rank, senior to our common stock. Such debt is, and likely will be, governed by a loan agreement, an indenture or other instrument containing covenants restricting our operating flexibility. Additionally, our convertible securities, and any equity securities or convertible or exchangeable securities that we issue in the future may have rights, preferences and privileges more favorable than those of our common stock and may result in dilution to owners of our common stock. We and, indirectly, our stockholders will bear the cost of issuing and servicing such debt or securities. Because our decision to issue debt or equity securities in any future offering will depend on market conditions and other factors beyond our control, we cannot predict or estimate the amount, timing or nature of our future offerings. Thus, holders of our common stock will bear the risk of our future offerings reducing the market price of our common stock and diluting the value of their stock holdings in us.
Risks Related to Our Organization and Structure
Our business could be harmed if key personnel terminate their employment with us.
Our success depends, to a significant extent, on the continued services of our senior management team. We have entered into employment agreements with certain members of our senior management team. Notwithstanding these agreements, there can be no assurance that any or all members of our senior management team will remain employed by us. We do not maintain key person life insurance on any of our officers other than two policies we maintain for Mr. Eckel under which we are a beneficiary in the amount of approximately $500 thousand. The loss of services of one or more members of our senior management team could harm our business and our prospects.
Conflicts of interest could arise as a result of our structure.
Conflicts of interest could arise in the future as a result of the relationships between us and our affiliates, on the one hand, and our Operating Partnership or any partner thereof, on the other. Our directors and officers have duties to our company under applicable Maryland law in connection with our management. Our duties, as the general partner, to our Operating Partnership and our partners may come into conflict with the duties of our directors and officers to us.
Under Delaware law, a general partner of a Delaware limited partnership owes its limited partners the duties of good faith and fair dealing. Other duties, including fiduciary duties, may be modified or eliminated in the partnership’s partnership agreement, except that conflict of interest transactions may still run afoul of implied contractual standards under Delaware law. The partnership agreement of our Operating Partnership provides that, for so long as we own a controlling interest in our Operating Partnership, any conflict that cannot be resolved in a manner not adverse to either our stockholders or the limited partners will be resolved in favor of our stockholders. We have not obtained an opinion of counsel covering the provisions set forth in the partnership agreement of our Operating Partnership that purport to waive or restrict our fiduciary duties that would be in effect under common law were it not for the partnership agreement of our Operating Partnership.
Additionally, the partnership agreement of our Operating Partnership expressly limits our liability by providing that neither we, as the general partner of the Operating Partnership, nor any of our directors or officers, will be liable or accountable in damages to our Operating Partnership, its limited partners or their assignees for errors in judgment, mistakes of fact or law or for any act or omission if the general partner, director or officer, acted in good faith. In addition, our Operating Partnership is required to indemnify us, our affiliates and each of our and their respective officers, directors, employees and agents to the fullest extent permitted by applicable law against any and all losses, claims, damages, liabilities (whether joint or several), expenses (including, without limitation, attorneys’ fees and other legal fees and expenses), judgments, fines, settlements and other amounts arising from any and all claims, demands, actions, suits or proceedings, civil, criminal, administrative or investigative, that relate to the operations of the Operating Partnership, provided that our Operating Partnership will not indemnify any such person for (1) willful misconduct or a knowing violation of the law, (2) any transaction for which such person received an improper personal benefit in violation or breach of any provision of the partnership agreement of our Operating Partnership, or (3) in the case of a criminal proceeding, the person had reasonable cause to believe the act or omission was unlawful.
- 35 -
Certain provisions of Maryland law could inhibit changes in control.
Certain provisions of the MGCL may have the effect of deterring a third party from making a proposal to acquire us or of impeding a change in control under circumstances that otherwise could provide the holders of our common stock with the opportunity to realize a premium over the then-prevailing market price of our common stock. We are subject to the “business combination” provisions of the MGCL that, subject to limitations, prohibit certain business combinations (including a merger, consolidation, statutory share exchange, or, in circumstances specified in the statute, an asset transfer or issuance or reclassification of equity securities) between us and an “interested stockholder” (defined generally as any person who beneficially owns 10% or more of our then outstanding voting stock or an affiliate or associate of ours who, at any time within the two-year period prior to the date in question, was the beneficial owner of 10% or more of our then outstanding voting stock) or an affiliate thereof for five years after the most recent date on which the stockholder becomes an interested stockholder. After the five-year prohibition, any business combination between us and an interested stockholder generally must be recommended by our board of directors and approved by the affirmative vote of at least (1) 80% of the votes entitled to be cast by holders of outstanding shares of our voting stock and (2) two thirds of the votes entitled to be cast by holders of our voting stock other than shares held by the interested stockholder with whom or with whose affiliate the business combination is to be effected or held by an affiliate or associate of the interested stockholder. These super-majority vote requirements do not apply if, among other conditions, our common stockholders receive a minimum price, as defined under the MGCL, for their shares in the form of cash or other consideration in the same form as previously paid by the interested stockholder for its shares. These provisions of the MGCL do not apply, however, to business combinations that are approved or exempted by a board of directors prior to the time that the interested stockholder becomes an interested stockholder. Our board of directors has by resolution exempted business combinations between us and (1) any other person, provided, that such business combination is first approved by our board of directors (including a majority of our directors who are not affiliates or associates of such person), (2) the Predecessor and its affiliates and associates as part of our formation transactions and (3) persons acting in concert with any of the foregoing. As a result, any person described in the preceding sentence may be able to enter into business combinations with us that may not be in the best interests of our stockholders, without compliance by our company with the supermajority vote requirements and other provisions of the statute. There can be no assurance that our board of directors will not amend or revoke the exemption at any time.
The “control share” provisions of the MGCL provide that, subject to certain exemptions, a holder of “control shares” of a Maryland corporation (defined as shares which, when aggregated with all other shares controlled by the stockholder (except solely by virtue of a revocable proxy), entitle the stockholder to exercise one of three increasing ranges of voting power in electing directors) acquired in a “control share acquisition” (defined as the direct or indirect acquisition of ownership or control of issued and outstanding “control shares”) has no voting rights with respect to such shares except to the extent approved by our stockholders by the affirmative vote of at least two thirds of all the votes entitled to be cast on the matter, excluding votes entitled to be cast by the acquirer of control shares, our officers and our directors who are also our employees. Our bylaws contain a provision exempting from the control share acquisition statute any and all acquisitions by any person of shares of our stock. There can be no assurance that this provision will not be amended or eliminated at any time in the future.
The “unsolicited takeover” provisions of Title 3, Subtitle 8 of the MGCL permit our board of directors, without stockholder approval and regardless of what is currently provided in our charter or bylaws, to implement certain takeover defenses, some of which (for example, a classified board) we do not yet have. Our charter contains a provision whereby we have elected to be subject to the provisions of Title 3, Subtitle 8 of the MGCL, pursuant to which our board of directors has the exclusive power to fill vacancies on our board of directors. These provisions may have the effect of inhibiting a third party from making an acquisition proposal for us or of delaying, deferring or preventing a change in control of us under the circumstances that otherwise could provide the holders of shares of common stock with the opportunity to realize a premium over the then current market price.
Our authorized but unissued shares of common and preferred stock may prevent a change in our control.
Our charter permits our board of directors to authorize us to issue additional shares of our authorized but unissued common or preferred stock. In addition, our board of directors may, without common stockholder approval, amend our charter to increase the aggregate number of our shares of stock or the number of shares of stock of any class or series that we have the authority to issue and classify or reclassify any unissued shares of common or preferred stock and set the terms of the classified or reclassified shares. As a result, our board of directors may establish a series of common or preferred stock that could delay or prevent a transaction or a change in control that might involve a premium price for shares of our common stock or otherwise be in the best interest of our stockholders.
- 36 -
Our rights and the rights of our stockholders to take action against our directors and officers are limited, which could limit stockholder recourse in the event of actions not in our stockholders’ best interests.
Our charter eliminates the liability of our present and former directors and officers to us and our stockholders for money damages to the maximum extent permitted under Maryland law. Under Maryland law, our present and former directors and officers will not have any liability to us or our stockholders for money damages other than liability resulting from:
• |
actual receipt of an improper benefit or profit in money, property or services; or |
• |
active and deliberate dishonesty by the director or officer that was established by a final judgment and was material to the cause of action adjudicated. |
Our charter authorizes us to indemnify our directors and officers for actions taken by them in those and other capacities to the maximum extent permitted by Maryland law. Our bylaws require us to indemnify each present and former director or officer, and each person who served any predecessor of our company in a similar capacity, to the maximum extent permitted by Maryland law, in connection with the defense of any proceeding to which he or she is made, or threatened to be made, a party or a witness by reason of his or her service to us or any predecessor. In addition, we may be obligated to pay or reimburse the expenses incurred by such persons in connection with any such proceedings without requiring a preliminary determination of their ultimate entitlement to indemnification.
Our charter contains provisions that make removal of our directors difficult, which could make it difficult for our stockholders to effect changes to our management.
Our charter provides that, subject to the rights of holders of any series of preferred stock, a director may be removed with or without cause upon the affirmative vote of holders of at least two thirds of the votes entitled to be cast generally in the election of directors. Vacancies may be filled only by a majority of the remaining directors in office, even if less than a quorum. These requirements make it more difficult to change our management by removing and replacing directors and may prevent a change in control of our company that is in the best interests of our stockholders.
Ownership limitations may restrict change of control or business combination opportunities in which our stockholders might receive a premium for their shares.
In order for us to qualify as a REIT for each taxable year after 2013, no more than 50% in value of our outstanding capital stock may be owned, directly or constructively, by five or fewer individuals during the last half of any calendar year, and at least 100 persons must beneficially own our stock during at least 335 days of a taxable year of 12 months, or during a proportionate portion of a shorter taxable year. “Individuals” for this purpose include natural persons, private foundations, some employee benefit plans and trusts, and some charitable trusts. To assist us in preserving our REIT qualification, among other purposes, our charter generally prohibits any person from directly or indirectly owning more than 9.8% in value or in number of shares, whichever is more restrictive, of the aggregate outstanding shares of our capital stock, the outstanding shares of any class or series of our preferred stock or the outstanding shares of our common stock. These ownership limits could have the effect of discouraging a takeover or other transaction in which holders of our common stock might receive a premium for their shares over the then prevailing market price or which holders might believe to be otherwise in their best interests. Our board of directors has established exemptions from these ownership limits that permit certain institutional investors and their clients to hold shares of our common stock in excess of these ownership limits.
We are subject to financial reporting and other requirements for our accounting, internal audit and other management systems and resources and the failure to comply with such requirements may adversely effect our business, operating results and stock price.
We are subject to reporting and other obligations under the Exchange Act, including the requirements of Section 404 of the Sarbanes-Oxley Act of 2002 (the “Sarbanes-Oxley Act”). Section 404 requires annual management assessments of the effectiveness of our internal controls over financial reporting and, our independent registered public accounting firm to express an opinion on the effectiveness of our internal controls over financial reporting. These reporting and other obligations place significant demands on our management, administrative, operational, internal audit and accounting resources and may cause us to incur significant expenses. We have upgraded, and may need to continue to upgrade, our systems or create new systems; implement additional financial and management controls, reporting systems and procedures; expand or outsource our internal audit function; and hire additional accounting, internal audit and finance staff. If we are unable to accomplish these objectives in a timely and effective fashion, our ability to comply with the financial reporting requirements and other rules that apply to reporting companies could be impaired. We believe that we currently have in place accounting, internal audit and other management systems and resources that will allow us to maintain compliance with the requirements of the Sarbanes-Oxley Act. Any failure to maintain effective internal controls could have a material adverse effect on our business, operating results and stock price.
- 37 -
Risks Related to Our Taxation as a REIT
Qualifying as a REIT involves highly technical and complex provisions of the Internal Revenue Code, and our failure to qualify or remain qualified as a REIT would subject us to U.S. federal income tax and applicable state and local tax, which would negatively impact the results of our operations and reduce the amount of cash available for distribution to our stockholders.
We elected and qualified as a REIT for U.S. federal income tax purposes commencing with our taxable year ended December 31, 2013. The U.S. federal income tax laws governing REITs are complex, and judicial and administrative interpretations of the U.S. federal income tax laws governing REIT qualification are limited. To qualify as a REIT and remain so qualified, we must meet, on an ongoing basis through actual operating results, various tests regarding the nature and diversification of our assets and our income, the ownership of our outstanding shares, and the amount of our distributions. Even a technical or inadvertent violation could jeopardize our REIT qualification. Our ability to satisfy the asset tests depends upon our analysis of the characterization and fair market values of our assets, some of which are not susceptible to a precise determination, and for which we will not obtain independent appraisals.
We received a private letter ruling from the Internal Revenue Service (“IRS”), which we refer to as the Ruling, relating to our ability to treat certain of our assets as qualifying REIT assets. We are entitled to rely on this Ruling for those assets which fit within the scope of the Ruling only to the extent that we have the legal and contractual rights described therein, we continue to operate in accordance with the relevant facts described in the ruling request we submitted, that such facts were accurately presented and to the extent such ruling is not inconsistent with the Real Property Regulations (as discussed in more detail below). As a result, no assurance can be given that we will always be able to rely on this Ruling.
In August of 2016, the Treasury Department and the IRS published regulations which we refer to as the Real Property Regulations relating to the definition of “real property” for purposes of the REIT income and asset tests which apply to us with respect to our taxable years beginning after December 31, 2016. Among other things, the Real Property Regulations provide that an obligation secured by a structural component of a building or other inherently permanent structure qualifies as a real estate asset for REIT qualification purposes only if such obligation is also secured by a real property interest in the inherently permanent structure served by such structural component. This aspect of the Real Property Regulations has important implications for our qualification as a REIT since a significant portion of our REIT qualifying assets consists of receivables that are secured by liens on installed structural improvements designed to improve the energy efficiency of buildings and a significant portion of our REIT qualifying gross income is interest income earned with respect to such receivables.
The structural improvements securing our receivables generally qualify as “fixtures” under local real property law, as well as under the Uniform Commercial Code, or the UCC, which governs rights and obligations of parties in secured transactions. Although not controlling for REIT purposes, the general rule in the United States is that once improvements are permanently installed in real properties, such improvements become fixtures and thus take on the character of and are considered to be real property for certain state and local law purposes. In general, in the United States, laws governing fixtures, including the UCC and real property law, afford lenders who have secured their financings with security interests in fixtures with rights that extend not just to the fixtures that secure their financings, but also to the real properties in which such fixtures have been installed. By way of example only, Section 9-604(b) of the UCC, which has been adopted in all but two states in the United States, permits a lender secured by fixtures, upon a default, to enforce its rights under the UCC or under applicable real property laws. Although there is limited authority directly on point, given the nature of, and the extent to which, the structural improvements securing our receivables are integrated into and serve the related buildings, we believe that the better view is that the nature and scope of our rights in such buildings that inure to us as a result of our receivables are sufficient to satisfy the requirements of the Real Property Regulations described above. In addition to the limited authority directly on point, two other important caveats apply in this regard. First, the Real Property Regulations do not define what is required for an obligation secured by a lien on a structural component to also be secured by a real property interest in the building served by such structural component. However, the initial proposed version of the Real Property Regulations, which never became effective, included a requirement that the interest in the real property held by a REIT be “equivalent” to the interest in a structural component held by the REIT in order for the structural component to be treated as a real estate asset. This requirement was ultimately not included in the final Real Property Regulations, in part in response to comments that such requirement may negatively affect investment in energy efficiency and renewable energy assets. We believe the deletion of this requirement implies that under the final Real Property Regulations, our rights in the building need not be equivalent to our rights in the structural components serving the building. Second, real property law is typically relegated to the states and the specific rights available to any lien or mortgage holder, including our rights as a fixture lien holder described above, may vary between jurisdictions as a result of a range of factors, including the specific local real property law requirements and judicial and regulatory interpretations of such laws, and the competing rights of mortgage and other lenders. Furthermore, we have applied the analysis described above to certain receivables secured by liens on structural improvements installed in buildings located in certain U.S. installations outside of the United States, based on our view that such installations are subject to U.S. sovereignty and as a result the UCC applies in such installations. While a number of cases have addressed the rights of fixture lien holders
- 38 -
generally, there are limited judicial interpretations in only a few jurisdictions that directly address the rights and remedies available to a fixture lien holder in the real property in which the fixtures have been installed. Such rights have been addressed in some cases which support our position and, in factual circumstances distinguishable from our own, in some cases where the courts have found these rights to be more limited. The resolution of these issues in many jurisdictions therefore remains uncertain. As a result of the foregoing, no assurance can be given that the IRS will not challenge our position that our receivables meet the requirements of the Real Property Regulations or that, if challenged, such position would be sustained.
The preamble to the Real Property Regulations provides that, to the extent a private letter ruling issued prior to the issuance of the Real Property Regulations is inconsistent with the Real Property Regulations, the private letter ruling is revoked prospectively from the applicability date of the Real Property Regulations. We do not believe that the Ruling is inconsistent with the Real Property Regulations because we believe the analysis in the Ruling was based on similar principles as the relevant portions of the Real Property Regulations, and accordingly we do not believe that the Real Property Regulations impact our ability to rely on the Ruling. However, no assurance can be given that the IRS would not successfully assert that we are not permitted to rely on the Ruling because the Ruling has been revoked by the Real Property Regulations.
If the IRS were to assert that a significant portion of our receivables do not qualify as real estate assets and do not generate income treated as interest income from mortgages on real property, we would fail to satisfy both the gross income requirements and asset requirements applicable to REITs. If this were to occur, we would be required to restructure the manner in which we receive such income and we may realize significant income that does not qualify for the REIT 75% gross income test, which could cause us to fail to qualify as a REIT.
In addition, our compliance with the REIT income and quarterly asset requirements also depends upon our ability to successfully manage the composition of our income and assets on an ongoing basis in accordance with existing REIT regulations and rules and interpretations thereof. Moreover, the IRS, new legislation, court decisions or other administrative guidance, in each case possibly with retroactive effect, may make it more difficult or impossible for us to qualify as a REIT. Our ability to satisfy the requirements to qualify as a REIT also depends in part on the actions of third parties over which we have no control or only limited influence, including in cases where we own an equity interest in an entity that is classified as a partnership for U.S. federal income tax purposes. Thus, given the highly complex nature of the rules governing REITs, the ongoing importance of factual determinations, and the possibility of future changes in our circumstances, no assurance can be given that we will so qualify for any particular year.
If we fail to qualify as a REIT in any taxable year, and we do not qualify for certain statutory relief provisions, we would be required to pay U.S. federal income tax on our net taxable income, and distributions to our stockholders would not be deductible by us in determining our taxable income. In such a case, we might need to borrow money or sell assets in order to pay our taxes. Our payment of income tax would negatively impact the results of our operations and decrease the amount of our income available for distribution to our stockholders. Furthermore, if we fail to maintain our qualification as a REIT, we no longer would be required to distribute substantially all of our taxable income to our stockholders, which would leave our board of directors with more discretion over our future distribution levels. In addition, unless we were eligible for certain statutory relief provisions, we could not re-elect to qualify as a REIT for the subsequent four taxable years following the year in which we failed to qualify.
Complying with REIT requirements may force us to liquidate or forego otherwise attractive investments.
To qualify as a REIT, we must ensure that we meet the REIT gross income tests annually and that, at the end of each calendar quarter, at least 75% of the value of our total assets consists of cash, cash items, government securities, shares in REITs and other qualifying real estate assets. The remainder of our investment in securities (other than government securities and REIT qualified real estate assets) generally cannot include more than 10% of the outstanding voting securities of any one issuer or more than 10% of the total value of the outstanding securities of any one issuer. In addition, in general, no more than 5% of the value of our total assets (other than government securities, securities of a taxable REIT subsidiary (a “TRS”) and securities that are qualifying real estate assets) can consist of the securities of any one issuer, no more than 20% of the value of our total assets can be represented by securities of one or more TRSs, and no more than 25% of the value of our assets can consist of debt instruments issued by publicly offered REITs that are not otherwise secured by real property. If we fail to comply with these requirements at the end of any calendar quarter, we must correct the failure within 30 days after the end of the calendar quarter or qualify for certain statutory relief provisions to avoid losing our REIT qualification and suffering adverse tax consequences. As a result, we may be required to liquidate from our portfolio, or contribute to a TRS, otherwise attractive investments, and may be unable to pursue investments that would be otherwise advantageous to us in order to satisfy the source of income or asset diversification requirements for qualifying as a REIT. These actions could have the effect of reducing our income and amounts available for distribution to our stockholders.
- 39 -
REIT distribution requirements could adversely affect our ability to execute our business plan and may require us to incur debt or sell assets to make such distributions.
In order to qualify as a REIT, we must distribute to our stockholders, each calendar year, at least 90% of our REIT taxable income (including certain items of non-cash income), determined without regard to the deduction for dividends paid and excluding net capital gain. To the extent that we satisfy the 90% distribution requirement, but distribute less than 100% of our REIT taxable income, we will be subject to U.S. federal corporate income tax on our undistributed income. In addition, we will incur a 4% non-deductible excise tax on the amount, if any, by which our distributions in any calendar year are less than a minimum amount specified under U.S. federal income tax laws. We intend to distribute our taxable income to our stockholders in a manner intended to satisfy the REIT 90% distribution requirement and to avoid the 4% non-deductible excise tax.
In addition, differences in timing between the recognition of taxable income, our GAAP income and the actual receipt of cash may occur. For example, we may be required to accrue interest and discount income on debt securities or interests in debt securities before we receive any payments of interest or principal on such assets, and there may be timing differences in the accrual of such interest and discount income for tax purposes and for GAAP purposes.
As a result of the foregoing, we may generate less cash flow than taxable income in a particular year and find it difficult or impossible to meet the REIT distribution requirements in certain circumstances. In such circumstances, we may be required to: (i) sell assets in adverse market conditions, (ii) raise debt or equity on unfavorable terms, (iii) distribute amounts that would otherwise be invested in future acquisitions, capital expenditures or repayment of debt, (iv) make a taxable distribution of our shares as part of a distribution in which stockholders may elect to receive shares or (subject to a limit measured as a percentage of the total distribution) cash or (v) use cash reserves, in order to comply with the REIT distribution requirements and to avoid U.S. federal corporate income tax and the 4% non-deductible excise tax. Thus, compliance with the REIT distribution requirements may hinder our ability to grow, which could adversely affect the value of our common stock.
Even though we qualify as a REIT, we may face tax liabilities that reduce our cash flow.
Even though we qualify for taxation as a REIT, we may be subject to certain U.S. federal, state and local taxes on our income and assets, including taxes on any undistributed income, tax on income from some activities conducted as a result of a foreclosure, and state or local income, franchise, property and transfer taxes, including mortgage recording taxes. In addition, any TRSs we own will be subject to U.S. federal, state and local corporate income or franchise taxes. In order to meet the REIT qualification requirements, or to avoid the imposition of a 100% tax that applies to certain gains derived by a REIT from sales of inventory or property held primarily for sale to customers in the ordinary course of business, we may hold some of our assets through TRSs. Any taxes paid by such TRSs would decrease the cash available for distribution to our stockholders.
The failure of assets subject to a repurchase agreement to be considered owned by us or mezzanine loans or other assets to qualify as real estate assets may adversely affect our ability to qualify as a REIT.
We may enter into repurchase agreements under which we will nominally sell certain of our assets to a counterparty and simultaneously enter into an agreement to repurchase the sold assets. We believe that we will be treated for U.S. federal income tax purposes as the owner of the assets that are the subject of any such agreements and that the repurchase agreements will be treated as secured lending transactions notwithstanding that such agreements may transfer record ownership of the assets to the counterparty during the term of the agreement. It is possible, however, that the IRS could assert that we did not own the assets during the term of the repurchase agreement, in which case our REIT asset test could be adversely affected.
In addition, we may acquire mezzanine loans, which are loans secured by equity interests in a partnership or limited liability company that directly or indirectly owns real property. In IRS Revenue Procedure 2003-65, the IRS provided a safe harbor pursuant to which a mezzanine loan, if it meets each of the requirements contained in the Revenue Procedure, will be treated by the IRS as a real estate asset for purposes of the REIT asset tests, and interest derived from the mezzanine loan will be treated as qualifying mortgage interest for purposes of the REIT 75% gross income test. Although IRS Revenue Procedure 2003-65 provides a safe harbor on which taxpayers may rely, it does not prescribe rules of substantive tax law. We may acquire mezzanine loans that may not meet all of the requirements for reliance on this safe harbor. In the event we own a mezzanine loan that does not meet the safe harbor, the IRS could challenge such loan’s treatment as a real estate asset for purposes of the REIT asset and income tests, and if such a challenge were sustained, we could fail to qualify as a REIT. Further, we invest in assets such as C-PACE bonds and assessments, which we believe are secured by real property for purposes of the REIT income and asset tests but with respect to which no authority is directly on point. If the IRS were to successfully assert that such C-PACE assets are not qualifying assets for purposes of the REIT gross asset tests or do not generate qualifying income for purposes of the 75% gross income test, our REIT qualification could be adversely affected.
We may be required to report taxable income for certain investments in excess of the economic income we ultimately realize from them.
To the extent we acquire debt investments in the secondary market for less than their face amount, the amount of such discount will generally be treated as “market discount” for U.S. federal income tax purposes. Market discount is generally
- 40 -
accrued on the basis of a constant yield to maturity of a debt investment. Accrued market discount is reported as income when, and to the extent that, any payment of principal of the debt instrument is made, unless we elect to include accrued market discount in income as it accrues. Principal payments on certain loans are made monthly, and consequently accrued market discount may have to be included in income each month as if the debt investment was assured of ultimately being collected in full. If we collect less on the debt investment than our purchase price plus the market discount we had previously reported as income, we may not be able to benefit from any offsetting loss deductions.
Similarly, some of the debt investments that we acquire may have been issued with an original issue discount. We will generally be required to report such original issue discount based on a constant yield method and will be taxed based on the assumption that all future projected payments due on such debt investments will be made. If such debt investments turn out not to be fully collectible, an offsetting loss deduction will become available only in the later year that uncollectability is provable. In addition, in the event that any debt investments acquired by us are delinquent as to mandatory principal and interest payments, or in the event payments with respect to a particular debt investment are not made when due, we may nonetheless be required to continue to recognize the unpaid interest as taxable income as it accrues, despite doubt as to its ultimate collectability. While we would in general ultimately have an offsetting loss deduction available to us when such interest was determined to be uncollectible, the utility of that deduction could depend on our having taxable income in that later year or thereafter. Although we do not presently intend to, we may, in the future, acquire debt investments that are subsequently modified by agreement with the borrower. If such amendments are “significant modifications” under the applicable Treasury Regulations, we may be required to recognize taxable income as a result of such amendments. Finally, we may be required under the terms of indebtedness that we incur with private lenders to use cash received from interest payments to make principal payments on that indebtedness, with the effect of recognizing income but not having a corresponding amount of cash available for distribution to our stockholders.
Public law no. 115-97, signed into law on December 22, 2017 and commonly referred to as the Tax Cuts and Jobs Act of 2017 (“TCJA”) implements various changes to the U.S. federal income tax laws that impacts the taxation of us and our shareholders. Among these changes, the TCJA may accelerate our accrual for U.S. federal income tax purposes of certain items of income to the extent that we would otherwise recognize such items of income for U.S. federal income tax purposes later than we would report such items on our financial statements. This provision of the TCJA could increase our taxable income in certain taxable years, which could impact our ability to satisfy the REIT distribution requirements. In addition, this provision of the TCJA may override many of the U.S. federal income tax rules relating to the timing of income inclusions, including such rules that are discussed elsewhere herein. However, recently released proposed Treasury Regulations generally would exclude, among other items, original issue discount (whether or not de minimis) and market discount from the applicability of this rule. Although the proposed Treasury Regulations generally will not be effective until taxable years beginning after the date on which they are issued in final form, we generally are permitted to elect to rely on the proposed Treasury Regulations currently.
The interest apportionment rules under Treasury Regulation Section 1.856-5(c) provide that, if a loan is secured by both real property and other property, a REIT is required to apportion its annual interest income to the real property securing the loan based on a fraction, the numerator of which is the value of such real property, determined when the REIT commits to acquire the loan, and the denominator of which is the highest “principal amount” of the loan during the year. If a mortgage loan is secured by both real property and personal property and the value of the personal property does not exceed 15% of the aggregate value of the property securing the mortgage loan, the mortgage loan is treated as secured solely by real property for this purpose. IRS Revenue Procedure 2014-51 interprets the “principal amount” of the loan to be the face amount of the loan, despite the Internal Revenue Code requiring taxpayers to treat any market discount, that is the difference between the purchase price of the loan and its face amount, for all purposes (other than certain withholding and information reporting purposes) as interest rather than principal. The interest apportionment regulations apply only if the loan in question is secured by both real property and other property and the value of personal property securing the mortgage exceeds 15% of the aggregate value of the property securing the mortgage.
If the IRS were to assert successfully that our loans were secured by property other than real estate, the interest apportionment rules applied for purposes of our REIT testing, and that the position taken in IRS Revenue Procedure 2014-51 should be applied to certain loans in our portfolio, then depending upon the value of the real property securing our loans and their face amount, and the sources of our gross income generally, we may fail to meet the 75% REIT gross income test. If we do not meet this test, we could potentially lose our REIT qualification or be required to pay a penalty to the IRS.
The “taxable mortgage pool” rules may increase the taxes that we or our stockholders may incur and may limit the way we effect future securitizations.
Securitizations by us or our subsidiaries could result in the creation of taxable mortgage pools for U.S. federal income tax purposes. As a result, we could have “excess inclusion income.” Certain categories of stockholders, such as non-U.S. stockholders eligible for treaty or other benefits, U.S. stockholders with net operating losses, and certain U.S. tax-exempt stockholders that are subject to unrelated business income tax, could be subject to increased taxes on a portion of their dividend income from us that is attributable to any such excess inclusion income. In the case of a stockholder that is a REIT, a regulated
- 41 -
investment company (a “RIC”), common trust fund or other pass-through entity, our allocable share of our excess inclusion income could be considered excess inclusion income of such entity. In addition, to the extent that our common stock is owned by U.S. tax-exempt “disqualified organizations,” such as certain government-related entities and charitable remainder trusts that are not subject to tax on unrelated business income, we may incur a corporate level tax on a portion of any excess inclusion income. Because this tax generally would be imposed on us, all of our stockholders, including stockholders that are not disqualified organizations, generally will bear a portion of the tax cost associated with the classification of us or a portion of our assets as a taxable mortgage pool. A RIC, or other pass-through entity owning our common stock in record name will be subject to tax at the highest U.S. federal corporate income tax rate on any excess inclusion income allocated to their owners that are disqualified organizations. Moreover, we could face limitations in selling equity interests in these securitizations to outside investors, or selling any debt securities issued in connection with these securitizations that might be considered to be equity interests for tax purposes. Finally, if we were to fail to qualify as a REIT, any taxable mortgage pool securitizations would be treated as separate taxable corporations for U.S. federal income tax purposes that could not be included in any consolidated U.S. federal corporate income tax return. These limitations may prevent us from using certain techniques to maximize our returns from securitization transactions.
Although our use of TRSs may be able to partially mitigate the impact of meeting the requirements necessary to maintain our qualification as a REIT, our ownership of and relationship with our TRSs is limited and a failure to comply with the limits would jeopardize our REIT qualification and may result in the application of a 100% excise tax.
A REIT may own up to 100% of the stock of one or more TRSs. Subject to certain exemptions, a TRS may hold assets and earn income that would not be qualifying assets or income if held or earned directly by a REIT. Both the subsidiary and the REIT must jointly elect to treat the subsidiary as a TRS. A corporation of which a TRS directly or indirectly owns more than 35% of the voting power or value of the stock will automatically be treated as a TRS. Overall, no more than 20% of the value of a REIT’s total assets may consist of stock or securities of one or more TRSs. In addition, the TRS rules limit the deductibility of interest paid or accrued by a TRS to its parent REIT to assure that the TRS is subject to an appropriate level of corporate taxation. The rules also impose a 100% excise tax on certain transactions between a TRS and its parent REIT that are not conducted on an arm’s-length basis. Our TRSs will pay U.S. federal, state and local income or franchise tax on their taxable income, and their after-tax net income will be available for distribution to us but will not be required to be distributed to us, unless necessary to maintain our REIT qualification. While we will be monitoring the aggregate value of the securities of our TRSs and intend to conduct our affairs so that such securities will represent less than 20% of the value of our total assets, there can be no assurance that we will be able to comply with the TRS limitation in all market conditions.
The tax on prohibited transactions limits our ability to engage in certain types of transactions, including certain methods of securitizing loans, which would be treated as sales for U.S. federal income tax purposes.
A REIT’s net income from prohibited transactions is subject to a 100% tax. In general, prohibited transactions are sales or other dispositions of property, other than foreclosure property, but including loans, held as inventory or primarily for sale to customers in the ordinary course of business. We might be subject to this tax if we were to sell or securitize loans in a manner that was treated as a sale of the loans as inventory for U.S. federal income tax purposes. Therefore, in order to avoid the prohibited transactions tax, we may choose not to engage in certain sales of loans, other than through a TRS, and we may be required to limit the structures we use for our securitization transactions, even though such sales or structures might otherwise be beneficial for us.
Complying with REIT requirements may limit our ability to hedge effectively.
The REIT provisions of the Internal Revenue Code may limit our ability to hedge our assets and operations. Under these provisions, any income that we generate from transactions intended to hedge our interest rate exposure will be excluded from gross income for purposes of the REIT 75% and 95% gross income tests if (i) the instrument (A) hedges interest rate risk on liabilities used to carry or acquire real estate assets or certain other specified types of risk, or (B) hedges an instrument described in clause (A) for a period following the extinguishment of the liability or the disposition of the asset that was previously hedged by the hedged instrument, and (ii) such instrument is properly identified under applicable Treasury Regulations. Income from hedging transactions that do not meet these requirements will generally constitute non-qualifying income for purposes of both the REIT 75% and 95% gross income tests. As a result of these rules, we may have to limit our use of hedging techniques that might otherwise be advantageous or implement those hedges through a TRS. This could increase the cost of our hedging activities because our TRS would be subject to tax on gains or the limits on our use of hedging techniques could expose us to greater risks associated with changes in interest rates than we would otherwise want to bear. In addition, losses in our TRS will generally not provide any tax benefit to us, although subject to limitation, such losses may be carried forward to offset future taxable income of the TRS.
Legislative, regulatory or administrative changes could adversely affect us.
The U.S. federal income tax laws and regulations governing REITs and their stockholders, as well as the administrative interpretations of those laws and regulations, are constantly under review and may be changed at any time, possibly with
- 42 -
retroactive effect. No assurance can be given as to whether, when, or in what form, the U.S. federal income tax laws applicable to us and our stockholders may be enacted. Changes to the U.S. federal income tax laws and interpretations of U.S. federal tax laws could adversely affect an investment in our common stock.
The TCJA, which was signed into law on December 22, 2017, significantly changes U.S. federal income tax laws applicable to businesses and their owners, including REITs and their stockholders, and may lessen the relative competitive advantage of operating as a REIT rather than as a C corporation. For additional discussion, see Item 7. Management’s Discussion and Analysis of Financial Condition and Results of Operations, “U.S. Federal Income Tax Legislation.”
Liquidation of our assets may jeopardize our REIT qualification.
To qualify as a REIT, we must comply with requirements regarding our assets and our sources of income. If we are compelled to liquidate our assets to repay obligations to our lenders, we may be unable to comply with these requirements, thereby jeopardizing our qualification as a REIT, or we may be subject to a 100% tax on any resultant gain if we sell assets that are treated as inventory or property held primarily for sale to customers in the ordinary course of business.
Your investment has various U.S. federal income tax risks.
We urge you to consult your tax advisor concerning the effects of U.S. federal, state, local and foreign tax laws to you regarding an investment in shares of our common stock.
Item 1B. |
Unresolved Staff Comments |
None.
Item 2. |
Properties |
Our principal executive offices are located at 1906 Towne Centre Blvd, Suite 370, Annapolis, Maryland 21401. Our telephone number is (410) 571-9860.
Item 3. |
Legal Proceedings |
From time to time, we may be involved in various claims and legal actions in the ordinary course of business. As of December 31, 2019, we are not currently subject to any legal proceedings that are likely to have a material adverse effect on our financial position, results of operations or cash flows.
Item 4. |
Mine Safety Disclosures |
Not applicable.
- 43 -
PART II
Item 5. |
Market for Registrant’s Common Equity, Related Stockholder Matters and Issuer Purchases of Equity Securities |
Market Information
Our common stock is traded on the NYSE under the symbol “HASI.”
Holders
As of February 18, 2020, we had 150 registered holders of our common stock. The 150 holders of record do not include the beneficial owners of our common stock whose shares are held by a broker or bank. Such information was obtained from The Depository Trust Company.
Dividends
We intend to make regular quarterly distributions to holders of our common stock. Any distributions we make will be at the discretion of our board of directors and will depend upon, among other things, our actual results of operations. These results and our ability to pay distributions will be affected by various factors, including the net interest and other income from our portfolio, our operating expenses and any other expenditures. See Item 1A. Risk Factors, and Item 7. Management’s Discussion and Analysis of Financial Condition and Results of Operations, of this Form 10-K, for information regarding the sources of funds used for dividends and for a discussion of factors, if any, which may adversely affect our ability to pay dividends. See Note 11 of the audited financial statements in this Form 10-K for details of our dividends declared in 2019 and 2018.
Additionally, as we are subject to the REIT requirements to distribute at least 90% of our REIT taxable income, there is a minimum amount of distributions that we are required to make. The taxable income of the REIT can vary from our GAAP earnings due to a number of different factors, including, the book to tax timing differences of income and expense recognition from our transactions as well as the amount of taxable income of our TRSs distributed to the REIT. See Note 10 regarding the amount of our distributions that are taxed as ordinary income to our stockholders.
Stockholder Return Performance
The stock performance graph and table below shall not be deemed, under the Securities Act or the Exchange Act, to be (i) “soliciting material” or “filed” or (ii) incorporated by reference by any general statement into any filing made by us with the SEC, except to the extent that we specifically incorporate such stock performance graph and table by reference.
The following graph is a comparison of the cumulative total stockholder return on our shares of common stock, the Standard & Poor’s 500 Index (the “S&P 500 Index”), the SNL Finance REIT Index, and the Dow Jones Utility Average which are peer group indexes from December 31, 2014 to December 31, 2019. The graph assumes that $100 was invested at closing on December 31, 2014, in our shares of common stock, the S&P 500 Index, and the peer group indexes and that all dividends were reinvested without the payment of any commissions. There can be no assurance that the performance of our common stock will continue in line with the same or similar trends depicted in the graph below.
- 44 -
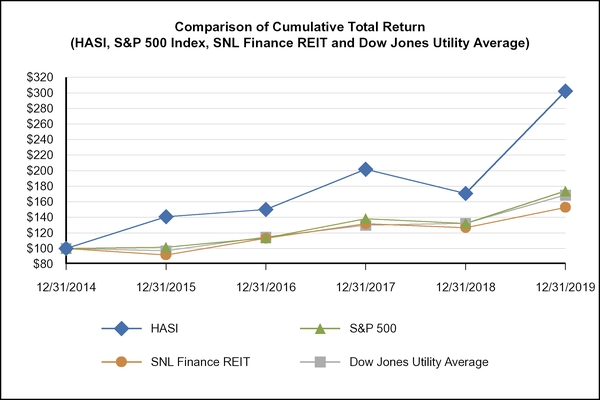
Company or Index |
12/31/2014 |
12/31/2015 |
12/31/2016 |
12/31/2017 |
12/31/2018 |
12/31/2019 |
|||||||||||||||||
Hannon Armstrong Sustainable Infrastructure Capital, Inc. |
$ |
100.00 |
$ |
140.81 |
$ |
150.16 |
$ |
201.70 |
$ |
170.69 |
$ |
302.25 |
|||||||||||
S&P 500 Index |
100.00 |
101.38 |
113.49 |
138.26 |
132.19 |
173.80 |
|||||||||||||||||
SNL Finance REIT Index (1)
|
100.00 |
91.70 |
112.96 |
131.80 |
126.69 |
152.75 |
|||||||||||||||||
Dow Jones Utility Average |
100.00 |
96.94 |
114.56 |
129.85 |
132.43 |
168.57 |
|||||||||||||||||
Source: S&P Global Market Intelligence, a division of S&P Global
(1) |
As of December 31, 2019, the SNL Finance REIT Index comprised of the following companies: AG Mortgage Investment Trust Inc.; AGNC Investment Corp.; American Church Mortgage Company; Annaly Capital Management Inc.; Anworth Mortgage Asset Corporation; Apollo Commercial Real Estate Finance, Inc.; Arbor Realty Trust Inc.; Ares Commercial Real Estate Corporation.; Arlington Asset Investment Corporation.; ARMOUR Residential REIT Inc.; Blackstone Mortgage Trust, Inc.; Broadmark Realty Capital Inc.; Capstead Mortgage Corporation.; Cherry Hill Mortgage Investment Corporation.; Chimera Investment Corporation.; Colony Credit Real Estate; Inc; CV Holdings Inc.; Dynex Capital Inc.; Ellington Financial Inc.; Ellington Residential Mortgage REIT; Exantas Capital Corp.; Granite Point Mortgage Trust; Great Ajax Corp.; Hannon Armstrong Sustainable Infrastructure Capital, Inc.; Hunt Companies Finance Trust; Invesco Mortgage Capital Inc.; Jernigan Capital Inc.; KKR Real Estate Finance Trust, Inc.; Ladder Capital Corp.; MFA Financial Inc.; New Residential Investment Corp.; New York Mortgage Trust Inc.; Orchid Island Capital Inc.; PennyMac Mortgage Investment Trust; RAIT Financial Trust; Ready Capital Corp.; Redwood Trust Inc.; Sachem Capital Corp.; Starwood Property Trust Inc.; TPG RE Finance Trust Inc; Tremont Mortgage Trust; Two Harbors Investment Corporation.; United Development Funding IV; and Western Asset Mortgage Capital Corporation. |
Securities Authorized For Issuance Under Equity Compensation Plans
In 2013, we adopted the 2013 Hannon Armstrong Sustainable Infrastructure Capital, Inc. Equity Incentive Plan (the “2013 Plan”) to provide equity based incentive compensation to members of our senior management team, our independent directors, advisers, consultants and other personnel. The 2013 Plan authorizes our compensation committee to grant stock options, shares of restricted common stock, restricted stock units, phantom shares, dividend equivalent rights, long-term incentive plan units (“LTIP units”) and other restricted limited partnership units issued by our Operating Partnership and other equity-based awards up to an aggregate of 7.5% of the shares of common stock issued and outstanding from time to time on a fully diluted basis (assuming, if applicable, the exercise of all outstanding options and the conversion of all warrants and convertible securities, including OP units and LTIP units, into shares of common stock).
- 45 -
As of December 31, 2019, we have approximately 2.2 million shares of our restricted common stock, LTIP Units, and restricted common stock units outstanding (assuming that the restricted stock units vest at 200%), which are subject to vesting and, in some cases, performance requirements, to our directors, officers and other employees.
The following table presents certain information about our equity compensation plan as of December 31, 2019:
Award |
Number of securities remaining available for future issuance under
equity compensation plans (1)
|
|
Equity compensation plans approved by stockholders |
1,990,996 |
|
Equity compensation plans not approved by stockholders |
— |
|
Total |
1,990,996 |
|
(1) |
The 2013 Plan provides for grants of equity awards up to, in the aggregate, the equivalent of 7.5% of the issued and outstanding shares of our common stock from time to time (on a fully diluted basis (assuming, if applicable, the exercise of all outstanding options and the conversion of all warrants and convertible securities into shares of common stock and assuming performance based LTIP units vest at 200%)) at the time of the award. As of December 31, 2019, we did not have outstanding under our equity compensation plan, any options, warrants or rights to purchase shares of our common stock.
|
Purchases of Equity Securities by the Issuer and Affiliated Purchasers
During the year ended December 31, 2019, certain of our employees surrendered common stock owned by them to satisfy their tax and other compensation related withholdings associated with the vesting of restricted stock and restricted stock units. 3,703 OP units were exchanged for shares of common stock during the year ended December 31, 2019. The price paid per share is based on the price of our common stock as of the date of the exchange and withholding. The table below summarizes all of our repurchases of common stock during 2019.
Period |
Total number
of shares
purchased
|
Average price
per share
|
Total number of
shares purchased
as part of publicly
announced plans
or programs
|
Maximum number
of shares that may
yet be purchased
under the plans or
programs
|
|||||
March 1 - March 31, 2019 |
253,743 |
25.31 |
N/A |
N/A |
|||||
May 1 - May 31, 2019 |
97,343 |
26.36 |
N/A |
N/A |
|||||
July 1 - July 31, 2019 |
885 |
28.06 |
N/A |
N/A |
|||||
August 1 - August 31, 2019 |
91 |
26.83 |
N/A |
N/A |
|||||
November 1 - November 31, 2019 |
5,323 |
28.73 |
N/A |
N/A |
|||||
- 46 -
Item 6. |
Selected Financial Data |
The following table sets forth selected financial and operating data on a historical basis for the Company for the last five calendar years. The following financial information should be read in conjunction with Item 7. Management’s Discussion and Analysis of Financial Condition and Results of Operations and the financial statements and related notes thereto. Certain amounts in the prior years have been reclassified to conform to the current year presentation.
Year Ended December 31, |
|||||||||||||||||||
2019 |
2018 |
2017 |
2016 |
2015 |
|||||||||||||||
(dollars in millions, except share and per share data) |
|||||||||||||||||||
Total revenue |
$ |
142 |
$ |
140 |
$ |
106 |
$ |
81 |
$ |
59 |
|||||||||
Total expenses |
116 |
118 |
96 |
72 |
51 |
||||||||||||||
Income (loss) from equity method investments |
64 |
22 |
22 |
6 |
— |
||||||||||||||
Income tax (expense) benefit |
(8 |
) |
(2 |
) |
(1 |
) |
— |
— |
|||||||||||
Net income (loss) |
$ |
82 |
$ |
42 |
$ |
31 |
$ |
15 |
$ |
8 |
|||||||||
Net income (loss) attributable to controlling stockholders |
$ |
82 |
$ |
42 |
$ |
31 |
$ |
15 |
$ |
8 |
|||||||||
Balance sheet data (at period end): |
|||||||||||||||||||
Equity method investments |
$ |
499 |
$ |
471 |
$ |
523 |
$ |
363 |
$ |
319 |
|||||||||
Government receivables |
263 |
497 |
519 |
526 |
401 |
||||||||||||||
Commercial receivables |
896 |
447 |
473 |
516 |
383 |
||||||||||||||
Receivables held-for-sale |
— |
— |
19 |
— |
60 |
||||||||||||||
Real estate (1)
|
362 |
365 |
341 |
172 |
156 |
||||||||||||||
Investments |
75 |
170 |
151 |
58 |
29 |
||||||||||||||
Securitization assets |
124 |
72 |
46 |
19 |
9 |
||||||||||||||
Total assets |
2,387 |
2,155 |
2,250 |
1,746 |
1,470 |
||||||||||||||
Credit facilities |
31 |
259 |
70 |
283 |
247 |
||||||||||||||
Non-recourse debt |
700 |
835 |
1,211 |
692 |
664 |
||||||||||||||
Senior unsecured notes |
512 |
— |
— |
— |
— |
||||||||||||||
Convertible notes |
149 |
148 |
148 |
— |
— |
||||||||||||||
Total liabilities |
1,447 |
1,350 |
1,607 |
1,172 |
1,038 |
||||||||||||||
Total equity |
940 |
805 |
643 |
574 |
432 |
||||||||||||||
Per share data: |
|||||||||||||||||||
Basic earnings per share |
$ |
1.25 |
$ |
0.75 |
$ |
0.57 |
$ |
0.32 |
$ |
0.21 |
|||||||||
Diluted earnings per share |
$ |
1.24 |
$ |
0.75 |
$ |
0.57 |
$ |
0.32 |
$ |
0.21 |
|||||||||
Dividends declared |
$ |
1.34 |
$ |
1.32 |
$ |
1.32 |
$ |
1.23 |
$ |
1.08 |
|||||||||
Weighted average shares outstanding—basic |
63,916,440 |
52,780,449 |
50,361,672 |
40,290,717 |
30,761,151 |
||||||||||||||
Weighted average shares outstanding—dilutive |
64,771,491 |
52,780,449 |
50,361,672 |
40,290,717 |
30,761,151 |
||||||||||||||
Managed Assets (2)
|
$ |
6,196 |
$ |
5,284 |
$ |
4,736 |
$ |
3,933 |
$ |
3,188 |
|||||||||
(1) |
Includes real estate intangible assets. |
(2) |
See Item 7. Management’s Discussion and Analysis of Financial Condition and Results of Operations—Non-GAAP Financial Measures—Managed Assets for information on Managed Assets. |
- 47 -
Item 7. |
Management’s Discussion and Analysis of Financial Condition and Results of Operations |
The following discussion should be read in conjunction with our financial statements and accompanying notes included in Item 8. Financial Statements and Supplementary Data, of this Form 10-K. Refer to ‘Item 7 -- Management’s Discussion and Analysis of Financial Condition and Results of Operations’ on our Form 10-K for the year ended December 31, 2018 for a discussion of our results for the year ended December 31, 2017 and a comparison of our results of operations for the fiscal years ended December 31, 2018 and December 31, 2017.
Overview
We make investments in climate change solutions by providing capital to leading companies in energy efficiency, renewable energy and other sustainable infrastructure markets. We believe we are one of the first U.S. public companies solely dedicated to such climate change investments. Our goal is to generate attractive returns from a diversified portfolio of projects with long-term, predictable cash flows from proven technologies that reduce carbon emissions or increase resilience to climate change.
We are internally managed, and our management team has extensive relevant industry knowledge and experience, dating back more than 30 years. We have long-standing relationships with the leading energy service companies (“ESCOs”), manufacturers, project developers, utilities, owners and operators. Our origination strategy is to use these relationships to generate recurring, programmatic investment and fee-generating opportunities. Additionally, we have relationships with leading banks, investment banks, and institutional investors from which we are referred additional investment and fee generating opportunities.
We completed approximately $1.3 billion of transactions during 2019, compared to approximately $1.2 billion during 2018. As of December 31, 2019, we held approximately $2.1 billion of transactions on our balance sheet, which we refer to as our “Portfolio.” For those transactions that we choose not to hold on our balance sheet, we transfer all or a portion of the economics of the transaction, typically using securitization trusts, to institutional investors in exchange for cash and/or residual interests in the assets and in some cases, ongoing fees. As of December 31, 2019, we managed approximately $4.1 billion in these trusts or vehicles that are not consolidated on our balance sheet. When combined with our Portfolio, as of December 31, 2019, we manage approximately $6.2 billion of assets, which we refer to as our “Managed Assets”.
Our investments have taken many forms, including equity, joint ventures, land ownership, lending, or other financing transactions. We also generate ongoing fees through gain-on-sale securitization transactions, services, and asset management. We use borrowings as part of our strategy to increase potential returns to our stockholders and have available a broad range of financing sources including non-recourse or recourse debt, equity and off-balance sheet securitization structures.
See Item 1. Business for a further discussion of our business, investing strategy, and financing strategy.
Market Conditions
As a result of increasing global awareness of and aversion to climate change impacts, we believe the sustainable infrastructure markets in which we invest, and investment in climate change solutions more broadly, will continue to grow as the impact of climate change increases. In January 2020, National Oceanic and Atmospheric Administration reported that the global average temperature has risen approximately one degree Celsius as of 2019 compared to twentieth century averages, with all five of the hottest years on record having occurred since 2015.
Further, communities across the globe are increasingly experiencing the destructive economic impacts of climate change, which are only expected to worsen going forward. Given that climate change tends to exacerbate the impact and increase the frequency of natural disaster events, physical assets are at significant risk. According to the U.S. National Oceanic and Atmospheric Administration (“NOAA”), there were 14 natural disaster events in the United States in 2019, with an estimated individual cost of greater than $1 billion and an aggregate cost of approximately $45 billion. NOAA reports, the average annual number of such events over the last five years has more than doubled as compared to the same metric between 1980 and 2019. In addition, the estimated cost of these events over the last five years is estimated at approximately $525 billion. Climate change is also expected to have meaningful productivity impacts. On a global basis, the McKinsey Global Institute projects in its 2019 Climate Risk and Response report that by 2050 between $4 trillion and $6 trillion in productive working hours could be lost.
It is estimated that aggregate annual energy efficiency and renewable energy spending exceeds $500 billion globally and $100 billion in the United States alone. In its Energy Efficiency 2019 report, the International Energy Agency (“IEA”) estimates global spending on energy efficiency at approximately $240 billion with the subset of that in North America at $47 billion. In addition, BloombergNEF (“BNEF”) reported in January 2020, that global renewables investment exceeded $280 billion, with more than $55 billion invested in the United States. Given that many projects are often self-financed (especially energy efficiency), we believe our total addressable market is likely a subset of these overall industry estimates. However, we believe these estimates are reliable indicators of market trends.
- 48 -
These positive industry trends coupled with the increasing environmental and economic imperative to reduce carbon emissions are expected to further broaden our investable universe. Investments in energy efficiency as a service allow organizations to avoid the upfront costs of efficiency investments by paying for efficiency-enabled cost savings as operating rather than capital expenses. In its Annual Energy Outlook 2020, the U.S. Energy Information Administration (“EIA”) estimates that decreasing energy intensity resulting from energy efficiency improvements will keep U.S. energy consumption for residential and commercial buildings growing at a level far below that of the U.S. economy. In addition, Lazard’s 2019 Levelized Cost of Energy Analysis shows that renewables continue to outperform traditional generation sources on a new-built cost basis with certain renewable technologies achieving competitiveness with existing conventional generation technologies on a marginal basis, making renewables even more attractive investment targets. Further, in its New Energy Outlook 2019, BNEF expects wind and solar generation to provide nearly 50% of the world’s electricity by 2050, with renewables attracting $10 trillion of aggregate investment over this time period.
Despite trends supporting further growth, certain actions taken by the federal government could limit the growth of the renewable energy market, such as the phase out of the production and investment tax credits, tariffs on solar imports in the Section 201 solar trade case, the currently planned 2020 withdrawal of the U.S. from the Paris Climate Accords (the “ Paris Accords”) and the Minimum Offer Price Rule issued by the Federal Energy Regulatory Commission, the effect of which is to establish price floors that advantage fossil fuel generation over that from renewables. While these federal policies in isolation may reduce the short-term growth in the U.S. renewable energy markets, we believe growth will continue given the strength of offsetting factors such as continued interest from state and local governments and corporations to address climate change.
State governmental agencies are responding to climate change risks through the implementation of renewable portfolio standards (“RPS”) as well as energy reduction targets such as energy efficiency resource standards. According to the EIA, by the end of 2019, 29 states and the District of Columbia had adopted a RPS while six of these states had passed laws committing to achieve 100 percent zero-carbon electricity by a target date. Similar 100% RPS commitments are expected to be introduced in additional states in 2020. Cities are also introducing policies expected to increase demand for energy efficiency. For example, New York City’s Local Law 97 establishes building emissions requirements while Chicago recently created a C-PACE program to facilitate investment in energy efficiency improvements in commercial buildings. Corporates are also responding to climate change risks - often through renewable energy sourcing commitments. In its 2019 Annual Report, the RE 100, a global corporate leadership initiative bringing together influential businesses committed to 100% renewable electricity, reported that over 200 multinational companies have pledged to achieve 100% renewable energy with an average target date of 2028.
Federal Energy Savings Performance Contracts (“ESPCs”) are an example of a public-private partnership that eliminate the need for a federal agency to find appropriated funds to replace, operate, and maintain energy-intensive equipment while also providing multiple ancillary benefits, including saving taxpayer dollars currently spent on energy consumption, improving conditions for federal workers and service men and women, and creating private sector jobs. In total, according to the DOE, the federal government has identified, as of February 2020, over $8 billion of energy conservation measures that could be implemented at existing U.S. federal buildings. Support for ESPCs remain bipartisan as the 2019 John S. McCain National Defense Authorization Act requires the military to address climate and energy resiliency in its planning, with Congress encouraging the use of ESPCs to this end. DOE announced that fiscal year 2019 was the most successful year in the history of the ESPC program, with over $819 million invested in qualifying projects.
While we believe that the long-term growth prospects for our business remain positive, volatility in financial markets and commodity prices along with interest rate movements could impact the markets we serve. Further, the current interest rate environment of low yields coupled with increasing investor acceptance of our markets has increased competitive pressure. In 2019, the Federal Reserve Board of Governors lowered the rate at which banks lend to one another (known as the federal funds rate) by a cumulative 75 basis points. See “Item 7A. Quantitative and Qualitative Disclosures about Market Risk-Interest Rate and Borrowing Risks” for an analysis of the impact of rates on our business.
According to the Department of Energy, average annual Henry Hub natural gas prices decreased by approximately 40% from 2014 to 2019, and its 2020 outlook forecasts that prices will stay below pre-2010 levels through 2050. As wholesale electricity prices are closely tied to wholesale natural gas prices in many parts of the United States, lower natural gas prices have negatively impacted, and are expected to continue to negatively impact, renewable energy projects that sell wholesale power on a “merchant” basis at spot prices. For more detail on commodity price impacts, see “Item 7A. Quantitative and Qualitative Disclosures about Market Risk-Commodity Price Risk”. We attempt to mitigate our exposure to these low commodity prices and future volatility, as well as any credit risk associated with these prices, by acquiring projects with contracted revenues, negotiating certain structural protections such as preferred returns, and through active asset management and portfolio monitoring. Similarly, we seek to manage credit risk that might arise from commodity price declines through our due diligence and underwriting processes, strong structural protections in our transaction agreements with customers, and active asset management and portfolio monitoring.
- 49 -
Notwithstanding any concerns that current market conditions have raised for our business, we believe significant opportunities exist for us to grow our business. As a long-term participant committed to providing capital for sustainable infrastructure, we plan to continue to fund projects that meet our underwriting standards and look for opportunities to expand our business.
Factors Impacting our Operating Results
We expect that our results of operations will be affected by a number of factors and will primarily depend on the size of our Portfolio, including the mix of transactions which we hold in our Portfolio, the income we receive from securitizations, syndications and other services, our Portfolio’s credit risk profile, changes in market interest rates, commodity prices, federal, state and/or municipal governmental policies, general market conditions in local, regional and national economies and our ability to qualify as a REIT and maintain our exemption from registration as an investment company under the 1940 Act.
Portfolio Size
The size of our Portfolio will be a key revenue driver. Generally, as the size of our Portfolio on our balance sheet grows the amount of our revenue will increase. Our Portfolio may grow at an uneven pace as opportunities to originate new assets may be irregularly timed, and the timing and extent of our success in such originations cannot be predicted. To the extent the size of our Portfolio changes due to equity method investment activity, the income or loss from such investments will not be included in revenue but are reflected as income (loss) from equity method investments in our income statement and will vary over time. In addition, we may decide for any particular asset that we should securitize or otherwise sell a portion, or all, of the asset, which would result in gain on sale of receivables and investments or fee income as described below. The level of portfolio activity will fluctuate from period to period based upon the market demand for the capital we provide, our view of economic fundamentals including interest rates, the present mix of our Portfolio, our ability to identify new opportunities that meet our investment criteria, the volume of projects that have advanced to stages where we believe a transaction is appropriate, seasonality in our activities and in the various projects where we may provide debt or equity and our ability to consummate the identified opportunities, including as a result of our available capital. The level of our new origination activity, the percentage of the originations that we choose to retain on our balance sheet and the related income, will directly impact our interest and rental revenue and income from equity method investments.
Income from Securitization, Syndication and Other Services
We will also earn gain on sale of financial assets or fee income by securitizing or selling all or a portion of certain transactions. For transactions that we securitize to a non-consolidated trust, we recognize a gain on the securitization. The gain may be comprised of both cash received and a retained interest in securitization assets. We may also recognize additional income from servicing fees from these securitization assets over the life of the asset.
In many cases, we arrange the securitization of the loan or other asset prior to originating the transaction and thus have avoided exposure to credit spread and interest rate risks that are typically associated with traditional capital markets conduit transactions. In these cases, we avoid funding risks for these financings or other assets given that our securitization partners contractually agree to fund such assets before the origination transaction is completed.
We also generate fee income for syndications where we arrange financings that are held by other investors or if we sell existing transactions to other investors. In these transactions, unless we decide to hold a portion of the economic interest of the transaction on our balance sheet, we have no exposure to risks related to ownership of those financings. We may charge advisory, retainer or other fees, including through our broker dealer subsidiary.
The gain on sale income and our other sources of fee income will also vary depending on the level of our new origination activity and the portion of our originated assets we decide to transfer to other investors. We view this revenue from such activities as a valuable component of our earnings and an important source of franchise value. The total amount of income from securitizations, syndications, and other services will vary on a quarter to quarter basis depending on various factors, including the level of our originations, the duration, credit quality and types of assets we originate, current and anticipated future interest rates, the impact on our leverage, the potential income from a securitization or syndication, the mix of our Portfolio and our need to tailor our mix of assets in order to allow us to qualify as a REIT for U.S. federal income tax purposes and maintain our exemption from registration under the 1940 Act.
- 50 -
Credit Risks
We source and identify quality opportunities within our broad areas of expertise and apply our rigorous underwriting processes to our transactions, which, we believe, will generally enable us to minimize our credit losses and maintain our current level of financing costs. In the case of various renewable energy and other sustainable infrastructure projects, we will be exposed to the credit risk of the obligor of the project’s PPA or other long-term contractual revenue commitments, as well as to the credit risk of certain suppliers and project operators. While we do not anticipate facing significant credit risk in our assets related to government energy efficiency projects, we are subject to varying degrees of credit risk in these projects in relation to payment guarantees provided by ESCOs that are required in the event that certain energy savings are not realized by the customer. We are also exposed to credit risk in our other projects that do not benefit from governments as the obligor such as on balance sheet financing of projects undertaken by universities, schools and hospitals, as well as privately owned commercial projects. Our level of credit risk has increased, and is expected to continue to increase, as our strategy contemplates new investments in mezzanine debt and equity. We seek to manage credit risk through thorough due diligence and underwriting processes, strong structural protections in our transaction agreements with customers and continual, active asset management and portfolio monitoring. Nevertheless, unanticipated credit losses could occur and during periods of economic downturn in the global economy, our exposure to credit risks from obligors increases, and our efforts to monitor and mitigate the associated risks may not be effective in reducing our credit losses. See Item 7A. Quantitative and Qualitative Disclosures about Credit Risks for further information on our credit risks and see Note 6 of our audited financial statements included in this Form 10-K for additional detail of the credit risks surrounding our Portfolio.
Changes in Market Interest Rates and Liquidity
Interest rate risk is highly sensitive to many factors, including governmental monetary and tax policies, domestic and international economic and political considerations and other factors beyond our control. We are subject to interest rate risk in connection with new asset originations and our borrowings, including our credit facilities, and in the future, any new floating rate assets, credit facilities or other borrowings. See Item 7A. Quantitative and Qualitative Disclosures about Market Risk for further information on interest rates risks and liquidity.
Commodity Prices
When we make investments in a project that act as a substitute for an underlying commodity, we may be exposed to volatility in prices for that commodity. For example, the performance of renewable energy projects that produce electricity can be impacted by volatility in the market prices of various forms of energy, including electricity, coal and natural gas. This is especially true for utility scale projects that sell power on a wholesale basis such as many of our Grid-Connected projects as opposed to Behind-the-Meter projects which compete against the retail or delivered costs of electricity which includes the cost of transmitting and distributing the electricity to the end user. See Item 7A. Quantitative and Qualitative Disclosures about Market Risk for further information on the impact of commodity prices.
Government Policies
We make investments in renewable energy projects that typically depend in part on various federal, state or local governmental policies that support or enhance the project’s economic feasibility. Such policies may include governmental initiatives, laws and regulations designed to reduce energy usage and impact the use of renewable energy or the investment in, and the use of, sustainable infrastructure. Policies and incentives provided by the U.S. federal government may include tax credits (with some of these tax credits that are related to renewable energy scheduled to be reduced or eliminated in the future), tax deductions, bonus depreciation, federal grants and loan guarantees, and energy market regulations. The value of tax credits, deductions and incentives may be impacted by changes in tax laws rates or regulations, including as a result of the TCJA.
Incentives provided by state and local governments may include a RPS or similar clean energy standard, which specify the portion of the power utilized by local utilities that must be derived from renewable or clean energy sources as well as the state or local government sponsored programs where the financing of energy efficiency or renewable energy projects is repaid through an assessment in the property tax bill in a program commonly referred to as PACE. Additionally, certain states have implemented feed-in or net metering tariffs, pursuant to which electricity generated from renewable energy sources is purchased at a higher rate than prevailing wholesale rates. Other incentives include tariffs, tax incentives and other cash and non-cash payments.
Governmental agencies, commercial entities and developers of sustainable infrastructure projects frequently depend on these policies and incentives to help defray the costs associated with, and to finance, various projects. Government regulations also impact the terms of third party financing provided to support these projects. If any of these government policies, incentives or regulations are adversely amended, delayed, eliminated, reduced, retroactively changed or not extended beyond their current expiration dates or there is a negative impact from the recent federal law changes or proposals, the operating results of the projects we finance and the demand for, and the returns available from our investments may decline, which could harm our business.
- 51 -
U.S. Federal Income Tax Legislation
The TCJA made significant changes to the U.S. federal income tax laws applicable to businesses and their owners, including REITs and their stockholders. Certain key provisions of the TCJA could impact us and our stockholders. See Note 10 of our audited financial statements in this Form 10-K for further information on the TCJA. Prospective investors are urged to consult with their tax advisors regarding the effects of the TCJA or other legislative, regulatory or administrative developments on an investment in our common stock.
Impacts of climate change on our future operations
As our business is focused on reducing carbon emissions and increasing resiliency to climate change, we are impacted by the effects of climate change and various related regulatory responses. In managing our business, we consider the potential impacts to our operations that may result in certain climate-related scenarios. In 2018, we began to implement the recommendations of the TCFD. The TCFD provides a framework to consider and disclose our processes for managing the risks and opportunities associated with climate change. We have disclosed the components of the TCFD framework throughout this document. The following tables highlight our evaluation of potential impacts to our business in two climate related scenarios as well as our resilience and strategy to handling the potential impacts.
- 52 -
Transition Risks and Opportunities - We believe our investment portfolio will be impacted by the transition risks and opportunities contemplated by the Paris Accords and the achievement of its objectives.
Scenario 1 - Global action is taken to limit the global temperature increase to 1.5 degrees Celsius above pre-industrial levels
Assumption |
Qualitative impacts |
Quantitative impacts |
Considerations of and impact on our management strategy |
|||
The price of Renewable Energy Credits (“RECs”) or similar structures increase as more aggressive renewable portfolio standards and corporate renewable energy targets are implemented |
Increased expected cash flows and financial returns for certain of our investments to the extent the RECs are sold at higher market prices. |
If the overall price level of RECs increased by 5% we would not expect a material impact to the overall cash flows from our existing investments. The is largely due to the lower value of RECs in comparison to power prices in most of the markets where our investments are located. |
We may identify more investment opportunities resulting from the increased REC value. In addition, to the extent that our investments become more valuable we would consider whether it would be more economical to our stockholders to either monetize the investment given the increase in value or continue to hold in our Portfolio and maximize our returns from adding additional leverage to our financing. |
|||
Increased debt/lease service coverage ratio for the obligors of our renewable energy debt investments and solar real estate leases that sell RECs at higher market pricing. |
||||||
The resulting increase in cash flows may also allow us to apply greater financial leverage to these investments and enhance our profitability. |
||||||
If there was a material increase in value associated with RECs, it is likely that more renewable energy projects would be developed in geographic areas where the RECs were more valuable, leading to more potential investment opportunities for us. |
||||||
- 53 -
Assumption |
Qualitative impacts |
Quantitative impacts |
Considerations of and impact on our management strategy |
|||
A carbon tax or similar carbon pricing mechanism is implemented by governmental authorities which may cause an increase to (i) power prices, (ii) operating costs for certain entities, and (iii) the competitiveness of renewable energy, energy efficiency and storage projects |
Increased cash flows and financial returns from certain investments to the extent power is sold at higher market prices due to the increase in cost imposed on fossil fueled energy projects. |
A portion of our portfolio is exposed to changes in the market price of power. Whether it is due to sales of energy at the then current market price or through a re-contracting of fixed price power purchase agreements.
Under a scenario where a carbon tax drives the price of power up by 10%, our wind equity investments may generate approximately 4% in additional cashflows over their life as compared to the cashflow the investments are expected to generate under the current baseline scenario.
We would not expect a material impact to our solar equity, renewable energy debt, solar real estate or energy efficiency investments.
|
In relation to new business, there is the potential that more competitors enter our markets and put pressure on our asset pricing strategies as renewable energy and energy efficiency projects become more cost competitive with fossil fuel electricity generation assets. We are constantly reviewing our pricing strategies and would continue to do so in this scenario to understand how we can continue to make investments with acceptable risk adjusted returns.
In addition, to the extent that our investments become more valuable we would consider whether it would be more economical to our stockholders to either monetize the investment given the increase in value or continue to hold in our portfolio and maximize our returns from adding additional leverage to our financing.
|
|||
Increases in the debt/lease service coverage ratio for the obligors of our renewable energy debt investments and solar real estate leases that sell power at higher market pricing. |
||||||
The resulting increase in cash flows may also allow us to apply greater financial leverage to these investments and enhance our profitability. |
||||||
Increased energy cost savings from energy efficiency solutions. |
||||||
Increased competitiveness of renewable energy projects with fossil fueled power plants, due to an increase in power prices. |
||||||
An increase in the items mentioned above may increase the volume of assets available in which we can invest. |
||||||
However, the implementation of a carbon tax may also have a negative impact on the financial health of utilities and corporate entities who also happen to purchase power from renewable energy projects in which we have invested. The credit ratings of these entities may be downgraded due to additional operating expenses resulting from a carbon tax. A credit rating downgrade may reduce the amount of financial leverage we are able to utilize. If this were to occur, our overall profitability could decline. |
||||||
- 54 -
Assumption |
Qualitative impacts |
Quantitative impacts |
Considerations of and impact on our management strategy |
|||
A significant increase in research and re-development investment in renewable energy, energy storage, and energy efficiency technologies by public and private entities |
Continued decreases in cost could make renewable energy, energy storage, and energy efficiency technologies more cost competitive. As a result, we may experience an increase in investment opportunities available to us. |
Given the nature of our business activities and focus on structuring transactions to meet the capital needs of our clients, it is difficult to reliably quantify the positive impact on our investment opportunities. However, we would expect to achieve accretive economics from this assumption.
|
In the development of our investment strategies we would consider investment in different technologies that we may not have historically invested based upon the additional development and maturation gained through the prospective increase in research and development. Additionally, the lower cost of projects may influence the amount of investment we would make in each opportunity. |
|||
Significant growth in positive public sentiment for sustainable infrastructure investment |
Increased demand for investment in sustainable infrastructure increase the volume of transactions in which we may invest, reduce our overall cost of capital and increase our profitability. |
Given the nature of our business activities and focus on structuring transactions to meet the capital needs of our clients, it is difficult to reliably quantify the positive impact on our investment opportunities. However, we would expect to achieve accretive economics from this assumption.
|
An increased demand for sustainable infrastructure may increase competition and influence our pricing strategy. We would continue to review our pricing strategies with these opportunities. |
|||
- 55 -
enario 2 - Global temperatures increase more than 2 degrees Celsius above pre-industrial levels
Assumption |
Qualitative impacts |
Quantitative impacts |
Considerations of and impact to our management strategy |
|||
No meaningful government policy to shift the trajectory of global climate change |
Given current trends, even without an increase in government support, we might expect increased demand for climate change solutions due to the improving economics and cost competitiveness of these technologies. |
Given the nature of our business activities and focus on structuring transactions to meet the capital needs of our clients, it is difficult to reliably quantify the impact on our investment opportunities. However, we would expect to achieve accretive economics from this assumption.
|
The increased demand in climate change solutions may increase competition and influence our pricing strategy. |
|||
Such growth in demand may increase the volume of investment opportunities available to us. |
||||||
An increase in demand for climate change resiliency solutions |
Flooding and storm surges may become more frequent, resulting in an increase in demand for storm water management assets. |
Given the nature of our business activities and focus on structuring transactions to meet the capital needs of our clients, it is difficult to reliably quantify the positive impact on our investment opportunities. However, we would expect to achieve accretive economics from this assumption.
|
The increased demand in climate change solutions may increase competition and influence our pricing strategy. |
|||
Greater instability in the power grid may increase the demand for on-site and distributed power generation systems and battery storage. |
||||||
If the above events occur, we may experience an increase in the volume of investment opportunities available to us. |
||||||
Greater variability and instability in the commodity markets |
Potential increases in the price of commodities (e.g., natural gas) due to climate change induced supply chain and transport disruptions, such as a major hurricane striking a series of gulf coast pipelines, may drive power prices higher, thus increasing financial returns from certain of our investments to the extent the power is sold at market prices rather than under fixed price contracts. |
We believe any mentioned impacts that are realized, are short-term in nature and we would not expect a material impact on our investments. |
We currently have risk management processes which include a recurring review of our investments through our portfolio management function to assess any increasing operational costs of our investments. For our existing portfolio, we will actively manage the risk to make appropriate adjustments to budget approvals, operational approvals, and other asset management tasks. For any new investments, we make conservative assumptions to protect our investments from such types of pricing volatility and will continue to do so, including new assumptions around commodity volatility as relevant. |
|||
However, climate change-related impacts to the amount of potable water supplies, such as irregular rainfall and salt water intrusion, may drive increases in the price of water. These increases in cost may increase the demand for assets that increase water use efficiency, resulting in an increase in the volume of investment opportunities available to us. |
||||||
- 56 -
Physical Risks and Opportunities - Given the assessments of the United Nation’s Intergovernmental Panel on Climate Change and other leading climate research organizations regarding the probability of a 1.5 Celsius increase in global temperature and serious climatic impacts even with the most aggressive emissions reduction initiatives, we believe our portfolio will be impacted by physical risks regardless of the actions taken as discussed above. We assume the types of risks to which our portfolio is exposed are similar under either Scenario 1 or 2 (albeit at varying degrees of severity).
Scenario 1 - Global action is taken to limit the global temperature increase to 1.5 degrees Celsius above pre-industrial levels and
Scenario 2 - Global temperatures increase more than 2 degrees Celsius above pre-industrial levels.
Assumption |
Qualitative impacts |
Quantitative impacts |
Considerations of and impact to our management strategy |
|||
Increased (i) flooding events due to heavier rainfalls and increased storm surge due to rising sea levels, (ii) the probability and severity of wildfires and (iii) increased frequency and severity of storms and other weather-related events |
Our existing investments in low lying areas are exposed to potential flooding events and other storm damage and such events may cause construction delays, operational shutdowns, and more significant site damage. |
We would not expect a material risk to the cash flows from our investments as we typically require insurance coverage for these events where the project owner bears this cost. Refer to later discussion on the impacts of the increase in insurance costs.
|
When underwriting our investments we negotiate structural protections to mitigate any loss we may incur from operations or inability of the projects to operate (this includes project insurance). For any new investment opportunities we would evaluate the exposure to rising sea levels and structure our investment terms such that we protect our invested capital. |
|||
A portion of our investments are located in high wildfire risk regions and are exposed to catastrophic damage from wildfire events. |
We would not expect a material risk to the cash flows from our investments. |
When underwriting our investments we negotiate structural protections to mitigate any loss we may incur from operations or inability of the projects to operate (this includes project insurance). For any new investment opportunities we would evaluate the exposure to wildfires and structure our investment terms such that we protect our invested capital.
|
||||
Solar energy assets that are not in the direct path of wildfires but are within the proximity thereof may have reduced power production due to ash soiling on the panels or reduced solar insolation due to ash clouds. |
The potential impact of additional soiling of panels or ash clouds was assessed is not expected to have a material impact on the cashflows and value of our portfolio. |
To the extent this became a material issue we would seek out protections to mitigate any impact of this, such as adding panel washing requirements to contracts. |
||||
If the events above were to occur, we may experience reduced cash flows and financial returns from these investments, which may cause us to reduce the amount of financial leverage we utilize and cause a decline in our overall profitability. |
||||||
- 57 -
Assumption |
Qualitative impacts |
Quantitative impacts |
Considerations of and impact to our management strategy |
|||
Operational performance of the projects in which we invest are impacted by the global temperature increase |
A decrease in performance and power generation of the solar and wind energy assets related to our investments, as the performance of these assets vary based upon the ambient temperatures (in the case of solar) and air density (in the case of wind). Both conditions may be caused by increases in global temperatures. |
Solar portfolio production can be affected by an increase in global temperature depending on the geography. If solar production decreases by 5% we may expect there to be a 14% decrease in expected cash flows from our solar equity investments.
High temperatures have a significant efficiency impact on wind turbines as high temperature faults create more wear and tear on equipment. If wind production decreases by 5% we would not expect a material impact to our wind equity investments. We would not expect a material impact on our renewable energy debt, solar real estate and energy efficiency investments.
|
When underwriting our investment opportunities we make conservative assumptions regarding performance and operational expenses that protect our returns from some level of unexpected performance or operation issues in the future. We will continue to adjust our assumptions as additional risks and severity of climate risk are assessed. We actively manage our existing portfolio to preemptively and proactively address any operational or maintenance issues. |
|||
Increased wind variability and increased wear on wind turbine components, which may increase operating costs. |
An increase in operating expenses would result and if there was 5% higher operating expenses the cash flows from our wind equity investments would be expected to decrease by 2%. |
|||||
Increased operating costs and lower generation from the increase in temperatures may reduce our expected cash flows and financial returns from our investments, which may cause us to reduce the amount of financial leverage we utilize and cause a decline in our overall profitability. |
If there were both a decrease in production of 5% and higher operating expenses of 5% our cash flows from our wind equity and solar equity investments would be expected to decline by 5% and 16%, respectively.
We would not expect a material impact on our renewable energy debt, solar real estate and energy efficiency investments.
|
|||||
- 58 -
Assumption |
Qualitative impacts |
Quantitative impacts |
Considerations of and impact to our management strategy |
|||
An increase in water scarcity potentially resulting in an increase in the price of water |
Water is used to clean the panels on solar energy assets to maintain their efficiency. An increase in water prices may reduce the cash flows and financial returns from our related investments, which may cause us to reduce the amount of financial leverage we utilize and cause a decline in our overall profitability. |
The impact of water scarcity and increased prices to our existing portfolio is not expected to have a material impact on the cash flows of our investments. |
To the extent this becomes a material matter we would seek out protections to mitigate any impact of additional water related costs. |
|||
Climate change related impacts to the amount of potable water supplies, such as irregular rainfall and salt water intrusion, may drive increases in the price of water. These increases in cost may increase the demand for assets that increase water use efficiency resulting in an increase in the volume of investment opportunities available to us. |
The increased demand in these projects may increase competition and influence our pricing strategy. |
|||||
An increase in the cost, or a change in the availability of insurance |
In anticipation of climate change related physical risks, projects related to our investments in particularly vulnerable regions, such as low-lying coastal areas, may face increases in insurance costs. An increase in insurance costs may reduce the cash flows and financial returns from these investments and may cause us to reduce the amount of financial leverage we utilize and cause a decline in our overall profitability. |
Insurance policies are executed on an annual basis and in some regions the price of insurance could increase such that the cashflow and value of our projects in high risk geographic regions are affected. This increase in insurance cost would drive an increase in total operating expenses. We have estimated that an increase in operating expenses of 5% would be expected to reduce our cash flows from wind equity and solar equity projects by 2%.
We would not expect a material impact on our renewable energy debt, solar real estate and energy efficiency investments.
|
We require that the projects in which we invest are insured against casualty events that could impact our cash distributions. We continually evaluate whether there are superior asset or portfolio level policies that are available that optimize our insurance coverage and premium costs. |
|||
Critical Accounting Policies and Use of Estimates
Our financial statements are prepared in accordance with GAAP, which requires the use of estimates and assumptions that involve the exercise of judgment and use of assumptions as to future uncertainties. The following discussion addresses the accounting policies that we use including areas that involve the use of significant estimates. Our most critical accounting policies involve decisions and assessments that could affect our reported assets and liabilities, as well as our reported revenues and expenses. We believe that all of the decisions and assessments upon which our financial statements are based are reasonable at the time made and based upon information available to us at that time. Our critical accounting policies and accounting estimates may be expanded over time. Those material accounting policies and estimates that we expect to be most critical to an investor’s understanding of our financial results and condition and require complex management judgment are discussed below. See Note 2 of the audited financial statements in this Form 10-K for further details on our accounting policies.
- 59 -
We evaluate our critical accounting estimates and judgments on an ongoing basis and update them, as necessary, based on changing conditions. Additionally, there were certain newly issued accounting pronouncements that may be relevant to our business. See Note 2 of the audited financial statements in this Form 10-K for further details on these newly issued accounting pronouncements.
We have identified the following accounting policies as critical because they require significant judgments and assumptions about highly complex and inherently uncertain matters and the use of reasonably different estimates and assumptions could have a material impact on our reported results of operations or financial condition.
Consolidation and Equity Method Investments
We account for our investment in entities that are considered voting or variable interest entities under ASC 810, Consolidation. We perform an ongoing assessment and make judgments to determine the primary beneficiary of each entity as required by ASC 810, which includes an assessment of the type of control we have over the entity. If we would conclude that certain of these entities should be consolidated, we would include the entities assets, liabilities and related activity in our financial statements. Refer to discussion below relating to consolidation considerations for the securitization of receivables. We further discuss our process for evaluating these judgments in Note 2 of the audited financial statements of this Form 10-K.
For those transactions not consolidated, we generally determine our income allocations under the equity method of accounting based on the change in our claim on net assets of the investee entity using a method commonly referred to as the hypothetical liquidation at book value method or (“HLBV”). This method uses a hypothetical liquidation scenario that may require judgment in its application and could have a material impact on our reported financial results. Any changes in this method of application or in certain assumptions could either increase or decrease our net income. We further discuss our process for applying this method of income allocations in Note 2 of the audited financial statements of this Form 10-K.
Impairment of our Portfolio
We evaluate the various assets in our Portfolio on at least a quarterly basis, and more frequently when economic or other conditions warrant such an evaluation, for potential delinquencies or other events that may indicate a potential impairment of the such asset. If an asset is determined to be impaired, any impairment charges would be recorded in the income statement and reduce our net income. We further discuss our process for evaluating these judgments in Note 2 of the audited financial statements in this Form 10-K.
In June 2016, the FASB issued ASU No. 2016-13, Financial Instruments-Credit Losses-Measurement of Credit Losses on Financial Instruments (“Topic 326”). Topic 326 significantly changes how entities will recognize and measure credit losses and impairments for most financial assets and certain other instruments that are not measured at fair value through net income. Topic 326 will replace the “incurred loss” approach under existing guidance with an “expected loss” model for instruments measured at amortized cost and require entities to record allowances for expected losses from available-for-sale debt securities rather than reduce the amortized cost, as currently required. It also simplifies the accounting model for purchased credit-impaired debt securities and loans. Topic 326 is effective for fiscal years beginning after December 15, 2019 and is to be adopted through a cumulative-effect adjustment to retained earnings as of the beginning of the first reporting period in which the guidance is effective. The Company has adopted the new standard as of January 1, 2020. While we are continuing to assess the impact Topic 326 will have on the consolidated financial statements, the measurement of expected credit losses under the current expected credit loss (“CECL”) model will be based on relevant information including historical experience, current conditions, and reasonable and supportable forecasts that affect the collectability of the reported amounts of the financial assets in scope of the model. We have pooled our assets by risk characteristics and determined a methodology for each pool. We expect our reserve to be less than $20 million upon adoption of the standard.
Securitization of Receivables
We have established various special purpose entities or securitization trusts for the purpose of securitizing certain receivables or other debt investments. We make judgments, based in part, on supporting legal opinions, on whether these entities should be consolidated as a variable interest entity, as defined in ASC 810, Consolidation, and whether the transfers to these entities are accounted for as a sale of a financial asset or a secured borrowing under ASC 860, Transfers and Servicing. If we would conclude that certain of these special purpose entities or securitization trusts should be consolidated, we would include the assets and liabilities of the entity and their related activity in our financial statements. If sale accounting is not met in these transactions it would be treated as a secured borrowing rather than a sale in our financial statements. We further discuss our process for evaluating these judgments in Note 2 of the audited financial statements of this Form 10-K.
Results of Operations
For a comparison of our results of operations for the fiscal years ended December 31, 2018 and December 31, 2017, see “Part II, Item 7. Management's Discussion and Analysis of Financial Condition and Results of Operations” of our annual report on Form 10-K for the fiscal year ended December 31, 2018, filed with the SEC on February 22, 2019.
- 60 -
We make investments in climate change solutions by providing capital to the leading companies in the energy efficiency, renewable energy and other sustainable infrastructure markets. We believe that Hannon Armstrong is one of the first U.S. public companies solely dedicated to such climate change investments. Our goal is to generate attractive returns for our shareholders by investing in a diversified portfolio of assets and projects that reduce carbon emissions or increase resilience to climate change and generate long-term, recurring and predictable cash flows or cost savings from proven commercial technologies.
We completed approximately $1.3 billion of transactions during 2019, compared to approximately $1.2 billion during 2018. Our strategy includes holding a large portion of these transactions on our balance sheet. We refer to the transactions we hold on our balance sheet as of a given date as our “Portfolio.” Our Portfolio was approximately $2.1 billion as of December 31, 2019 and $2.0 billion December 31, 2018.
Portfolio
Our Portfolio totaled approximately $2.1 billion as of December 31, 2019, and included approximately $1.3 billion of BTM assets and approximately $0.8 billion of GC assets. Approximately 23% of our Portfolio consisted of unconsolidated equity investments in renewable energy related projects and approximately 18% of our Portfolio was real estate leased to renewable energy projects under operating leases. The remainder consisted of fixed-rate government and commercial receivables and debt securities which we generally refer to as debt investments. Our Portfolio consisted of over 180 transactions with an average size of $11 million and the weighted average remaining life of our Portfolio (excluding match-funded transactions) of approximately 15 years as of December 31, 2019.
Our Portfolio included the following as of December 31, 2019:
• |
Equity investments in either preferred or common structures in unconsolidated entities; |
• |
Government and commercial receivables, such as loans for renewable energy and energy efficiency projects; |
• |
Real estate, such as land or other assets leased for use by sustainable infrastructure projects typically under long-term operating leases; and |
• |
Investments in debt securities of renewable energy or energy efficiency projects. |
The table below provides details on the interest rate and maturity of our debt investments as of December 31, 2019:
Balance |
Maturity |
||||
(in millions) |
|||||
Fixed-rate receivables, interest rates of less than 5.00% per annum |
$ |
255 |
2020 to 2045 |
||
Fixed-rate receivables, interest rates from 5.00% to 6.50% per annum |
107 |
2020 to 2056 |
|||
Fixed-rate receivables, interest rates greater than 6.50% per annum |
805 |
2020 to 2069 |
|||
Receivables |
1,167 |
||||
Less: Allowance for credit losses |
(8 |
) |
|||
Receivables, net of allowance |
1,159 |
||||
Fixed-rate investments, interest rates of less than 5.00% per annum |
64 |
2027 to 2046 |
|||
Fixed-rate investments, interest rates from 5.00% to 6.50% per annum |
11 |
2030 to 2051 |
|||
Total receivables and investments |
$ |
1,234 |
|||
The table below presents, for the loan and real estate related holdings of our Portfolio and the related interest-bearing liabilities, the average outstanding balances, income earned, the interest expense incurred, and average yield or cost. Our earnings from our equity method investments are not included in total revenue and thus we have excluded the income and related interest expense for our equity method investments from these calculations. Our net investment margin represents the difference between the interest and rental income generated by our Portfolio and the interest expense, divided by the average balance of those assets.
- 61 -
Years Ended December 31, |
|||||||||||
2019 |
2018 |
2017 |
|||||||||
(dollars in millions) |
|||||||||||
Interest income, receivables |
$ |
68 |
$ |
68 |
$ |
57 |
|||||
Average monthly balance of receivables |
$ |
930 |
$ |
1,001 |
$ |
1,062 |
|||||
Average interest rate of receivables |
7.3 |
% |
6.8 |
% |
5.3 |
% |
|||||
Interest income, investments |
$ |
6 |
$ |
7 |
$ |
5 |
|||||
Average monthly balance of investments |
$ |
148 |
$ |
163 |
$ |
122 |
|||||
Average interest rate of investments |
4.3 |
% |
4.1 |
% |
4.2 |
% |
|||||
Rental income |
$ |
26 |
$ |
25 |
$ |
20 |
|||||
Average monthly balance of real estate |
$ |
364 |
$ |
350 |
$ |
284 |
|||||
Average yield on real estate |
7.1 |
% |
7.0 |
% |
7.0 |
% |
|||||
Average monthly balance of receivables, investments, and real estate |
$ |
1,442 |
$ |
1,514 |
$ |
1,468 |
|||||
Average yield from receivables, investments, and real estate |
6.9 |
% |
6.5 |
% |
5.6 |
% |
|||||
Interest expense (1)
|
$ |
55 |
$ |
62 |
$ |
49 |
|||||
Average monthly balance of debt (1)
|
$ |
1,135 |
$ |
1,275 |
$ |
1,079 |
|||||
Average interest rate of debt (1)
|
4.9 |
% |
4.9 |
% |
4.6 |
% |
|||||
Average interest spread (1)
|
2.1 |
% |
1.6 |
% |
1.0 |
% |
|||||
Net investment margin (1)
|
3.1 |
% |
2.4 |
% |
2.2 |
% |
|||||
(1) |
Excludes amounts related to the non-recourse debt used to finance the equity method investments in the renewable energy projects because our earnings from these equity investments are not included in total revenue. |
The following table provides a summary of our anticipated principal repayments for our receivables and investments as of December 31, 2019:
Payment due by Period |
|||||||||||||||||||
Total |
Less than
1 year
|
1-5 years |
5-10 years |
More than
10 years
|
|||||||||||||||
(in millions) |
|||||||||||||||||||
Receivables |
$ |
1,159 |
$ |
116 |
$ |
203 |
$ |
149 |
$ |
691 |
|||||||||
Investments |
75 |
1 |
6 |
14 |
54 |
||||||||||||||
See Note 6 of our audited financial statements in this Form 10-K for information on:
• |
the anticipated maturity dates of our receivables and investments and the weighted average yield for each range of maturities as of December 31, 2019,
|
• |
the term of our leases and a schedule of our future minimum rental income under our land lease agreements as of December 31, 2019,
|
• |
the credit quality of our Portfolio, and |
• |
the receivables on non-accrual status. |
For information on our residual assets relating to our securitization trusts, see Note 5 of our audited financial statements in this Form 10-K. The residual assets do not have a contractual maturity date and the underlying securitized assets have contractual maturity dates until 2055.
- 62 -
Comparison of the Year Ended December 31, 2019 to the Year Ended December 31, 2018
|
Years ended
December 31,
|
$ Change |
% Change |
||||||||||||
2019 |
2018 |
|||||||||||||
(dollars in millions) |
||||||||||||||
Revenue |
||||||||||||||
Interest income |
$ |
76 |
$ |
76 |
$ |
— |
— |
% |
||||||
Rental income |
26 |
25 |
1 |
4 |
% |
|||||||||
Gain on sale of receivables and investments |
24 |
33 |
(9 |
) |
(27 |
)% |
||||||||
Fee income |
16 |
6 |
10 |
167 |
% |
|||||||||
Total revenue |
142 |
140 |
2 |
1 |
% |
|||||||||
Expenses |
||||||||||||||
Interest expense |
64 |
77 |
(13 |
) |
(17 |
)% |
||||||||
Provision for loss on receivables |
8 |
— |
8 |
NM |
||||||||||
Compensation and benefits |
29 |
26 |
3 |
12 |
% |
|||||||||
General and administrative |
15 |
15 |
— |
— |
% |
|||||||||
Total expenses |
116 |
118 |
(2 |
) |
(2 |
)% |
||||||||
Income before equity method investments |
26 |
22 |
4 |
18 |
% |
|||||||||
Income (loss) from equity method investments |
64 |
22 |
42 |
191 |
% |
|||||||||
Income (loss) before income taxes |
90 |
44 |
46 |
105 |
% |
|||||||||
Income tax (expense) benefit |
(8 |
) |
(2 |
) |
(6 |
) |
300 |
% |
||||||
Net income (loss) |
$ |
82 |
$ |
42 |
$ |
40 |
95 |
% |
||||||
NM—Percentage change is not meaningful.
• |
Net income increased by approximately $40 million as a result of a $2 million increase in total revenue, a $2 million decrease in total expenses, a $42 million increase in income from equity method investments, and a $6 million increase in income tax expense. These results do not include the Non-GAAP core earnings adjustment related to equity method investments, which is discussed in the Non-GAAP Financial Measures section.
|
• |
Interest and rental income increased by $1 million due to higher yielding assets offset by lower average balances. |
• |
Interest income in the prior year included $13 million in income from asset repayments on a residential solar transaction that did not recur in the current year. Adjusting for this one-time event, interest and rental income would increase by $14 million due to higher yielding assets that were offset by lower total average balances. |
• |
Interest expense for the year decreased by approximately $13 million as a result of lower cost and outstanding balance of debt during the year.
|
• |
Provision for loss on receivables increased by $8 million due to a 2019 court ruling related to receivables that were previously placed on non-accrual status in 2017. |
• |
Compensation and benefits increased by $3 million due to an increase in equity-based compensation expense resulting from the timing of vesting and higher award valuations. |
• |
Income from equity method investments increased by $42 million primarily due to the GAAP gain of $28 million recognized from the sale of a portfolio of wind projects in the fourth quarter of 2019 and additional income resulting from the realization of tax attributes by our co-investors. |
• |
Income tax expense increased by $6 million as a result of higher taxable income largely due to the gain on the sale of the portfolio of wind projects discussed above.
|
Non-GAAP Financial Measures
We consider the following non-GAAP financial measures useful to investors as key supplemental measures of our performance: (1) core earnings and (2) Managed Assets. These non-GAAP financial measures should be considered along with, but not as alternatives to, net income or loss as measures of our operating performance. These non-GAAP financial measures, as calculated by us, may not be comparable to similarly named financial measures as reported by other companies that do not define such terms exactly as we define such terms.
- 63 -
Core Earnings
We calculate core earnings as GAAP net income (loss) excluding non-cash equity compensation expense, certain non-cash provisions for loss on receivables, amortization of intangibles, any one-time acquisition related costs or non-cash tax charges and the earnings attributable to our non-controlling interest of our Operating Partnership. We also make an adjustment to our equity method investments in the renewable energy projects as described below. In the future, core earnings may also exclude one-time events pursuant to changes in GAAP and certain other non-cash charges as approved by a majority of our independent directors.
Certain of our equity method investments in renewable energy and energy efficiency projects are structured using typical partnership “flip” structures where the investors with cash distribution preferences receive a pre-negotiated return consisting of priority distributions from the project cash flows, in many cases, along with tax attributes. Once this preferred return is achieved, the partnership “flips” and the common equity investor, often the operator or sponsor of the project, receives more of the cash flows through its equity interests while the previously preferred investors retain an ongoing residual interest. We have made investments in both the preferred and common equity of these structures. Regardless of the nature of our equity interest, we typically negotiate the purchase prices of our equity investments, which have a finite expected life, based on our assessment of the expected cash flows we will receive from these projects discounted back to the net present value, based on a target investment rate, with the expected cash flows to be received in the future reflecting both a return on the capital (at the investment rate) and a return of the capital we have committed to the project. We use a similar approach in the underwriting of our receivables.
Under GAAP, we account for these equity method investments utilizing the HLBV method. Under this method, we recognize income or loss based on the change in the amount each partner would receive, typically based on the negotiated profit and loss allocation, if the assets were liquidated at book value, after adjusting for any distributions or contributions made during such quarter. The HLBV allocations of income or loss may be impacted by the receipt of tax attributes, as tax equity investors are allocated losses in proportion to the tax benefits received, while the sponsors of the project are allocated gains of a similar amount. In addition, the agreed upon allocations of the project’s cash flows may differ materially from the profit and loss allocation used for the HLBV calculations.
The cash distributions for our equity method investments are segregated into a return on and return of capital on our cash flow statement based on the cumulative income (loss) that has been allocated using the HLBV method. However, as a result of the application of the HLBV method, including the impact of tax allocations, the high levels of depreciation and other non-cash expenses that are common to renewable energy projects and the differences between the agreed upon profit and loss and the cash flow allocations, the distributions and thus the economic returns (i.e. return on capital) achieved from the investment are often significantly different from the income or loss that is allocated to us under the HLBV method. Thus, in calculating core earnings, we further adjust GAAP net income (loss) to take into account our calculation of the return on capital (based upon the investment rate) from our renewable energy equity method investments, as adjusted to reflect the performance of the project and the cash distributed. We believe this core equity method investment adjustment to our GAAP net income (loss) in calculating our core earnings measure is an important supplement to the HLBV income allocations determined under GAAP for an investor to understand the economic performance of these investments.
Our results related to our equity method investments in renewable energy and energy efficiency projects for the last three years are as follows:
For the years ended December 31, |
|||||||||||
2019 |
2018 |
2017 |
|||||||||
(dollars in millions) |
|||||||||||
Income under GAAP |
$ |
64 |
$ |
22 |
$ |
22 |
|||||
Core earnings |
$ |
41 |
$ |
41 |
$ |
43 |
|||||
Return of capital |
$ |
60 |
$ |
74 |
$ |
47 |
|||||
Cash collected |
$ |
101 |
$ |
115 |
$ |
90 |
|||||
We believe that core earnings provides an additional measure of our core operating performance by eliminating the impact of certain non-cash expenses and facilitating a comparison of our financial results to those of other comparable companies with fewer or no non-cash charges and comparison of our own operating results from period to period. Our management uses core earnings in this way. We believe that our investors also use core earnings, or a comparable supplemental performance measure, to evaluate and compare our performance to that of our peers, and as such, we believe that the disclosure of core earnings is useful to our investors.
- 64 -
However, core earnings does not represent cash generated from operating activities in accordance with GAAP and should not be considered as an alternative to net income (determined in accordance with GAAP), or an indication of our cash flow from operating activities (determined in accordance with GAAP), or a measure of our liquidity, or an indication of funds available to fund our cash needs, including our ability to make cash distributions. In addition, our methodology for calculating core earnings may differ from the methodologies employed by other companies to calculate the same or similar supplemental performance measures, and accordingly, our reported core earnings may not be comparable to similar metrics reported by other companies.
We have calculated our core earnings for the years ended December 31, 2019, 2018 and 2017. The table below provides a reconciliation of our GAAP net income to core earnings:
For the Years Ended December 31, |
|||||||||||||||||||||||
2019 |
2018 |
2017 |
|||||||||||||||||||||
$ |
Per Share |
$ |
Per Share |
$ |
Per Share |
||||||||||||||||||
(dollars in thousands, except per share amounts) |
|||||||||||||||||||||||
Net income attributable to controlling stockholders |
$ |
81,564 |
$ |
1.24 |
$ |
41,577 |
$ |
0.75 |
$ |
30,856 |
$ |
0.57 |
|||||||||||
Core earnings adjustments |
|||||||||||||||||||||||
Reverse GAAP income from equity method investments |
(64,174 |
) |
(22,162 |
) |
(22,289 |
) |
|||||||||||||||||
Add back core equity method investments earnings |
41,437 |
40,923 |
42,707 |
||||||||||||||||||||
Non-cash equity-based compensation charges |
14,160 |
10,066 |
11,304 |
||||||||||||||||||||
Non-cash provision for loss on receivables |
8,027 |
— |
— |
||||||||||||||||||||
Amortization of intangibles |
3,285 |
3,207 |
2,622 |
||||||||||||||||||||
Non-cash provision (benefit) for taxes |
8,091 |
1,968 |
756 |
||||||||||||||||||||
Current year earnings attributable to non-controlling interest |
356 |
221 |
179 |
||||||||||||||||||||
Core earnings (1)
|
$ |
92,746 |
$ |
1.40 |
$ |
75,800 |
$ |
1.38 |
$ |
66,135 |
$ |
1.27 |
|||||||||||
(1) |
Core earnings per share is based on 66,046,401 shares, 54,742,869 shares and 52,231,030 shares for the years ended December 31, 2019, 2018 and 2017, respectively, which represents the weighted average number of fully-diluted shares outstanding including our restricted stock awards and restricted stock units and the non-controlling interest in our Operating Partnership. We include any potential common stock issuance in this calculation related to our convertible notes using the treasury stock method and any potential common stock issuances related to share based compensation units in the amount we believe is reasonably certain to vest.
|
Managed Assets
As we both consolidate assets on our balance sheet and securitize assets, certain of our receivables and other assets are not reflected on our balance sheet where we may have a residual interest in the performance of the investment, such as servicing rights or a retained interest in cash flows. Thus, we present our investments on a non-GAAP “managed” basis, which assumes that securitized receivables are not sold. We believe that our Managed Asset information is useful to investors because it portrays the amount of both on- and off-balance sheet receivables that we manage, which enables investors to understand and evaluate the credit performance associated with our portfolio of receivables, investments, and residual assets in securitized receivables. Our non-GAAP Managed Assets measure may not be comparable to similarly titled measures used by other companies.
- 65 -
The following is a reconciliation of our GAAP Portfolio to our Managed Assets as of December 31, 2019, 2018, and 2017:
As of December 31, |
|||||||||||
2019 |
2018 |
2017 |
|||||||||
(dollars in millions) |
|||||||||||
Equity method investments |
$ |
499 |
$ |
471 |
$ |
523 |
|||||
Government receivables (1)
|
263 |
497 |
535 |
||||||||
Commercial receivables (2)
|
896 |
447 |
477 |
||||||||
Real estate |
362 |
365 |
341 |
||||||||
Investments |
75 |
170 |
151 |
||||||||
Assets held in securitization trusts |
4,101 |
3,334 |
2,709 |
||||||||
Managed assets |
$ |
6,196 |
$ |
5,284 |
$ |
4,736 |
|||||
Credit losses as a percentage of assets under management |
0.1 |
% |
0.0 |
% |
0.0 |
% |
|||||
(1) |
Includes receivables held-for-sale of $16 million in 2017. |
(2) |
Includes receivables held-for-sale of $3 million in 2017. |
Other Financial Measures
The following are certain other GAAP-based financial measures for the years ended December 31, 2019, 2018 and 2017.
|
Years Ended
December 31,
|
||||||||
2019 |
2018 |
2017 |
||||||
Return on assets |
3.6 |
% |
1.9 |
% |
1.5 |
% |
||
Return on equity |
9.4 |
% |
5.7 |
% |
5.1 |
% |
||
Average equity to average total assets ratio |
38.4 |
% |
32.9 |
% |
30.5 |
% |
||
Portfolio Yield
We calculate portfolio yield as the weighted average underwritten yield of the investments in our Portfolio as of the end of the period. Underwritten yield is the rate at which we discount the expected cash flows from the assets in our Portfolio to determine our purchase price. In calculating underwritten yield, we make certain assumptions, including the timing and amounts of cash flows generated by our investments, which may differ from actual results, and may update this yield to reflect our most current estimates of project performance. We believe that portfolio yield provides an additional metric to understand certain characteristics of our Portfolio as of a point in time. Our management uses portfolio yield this way and we believe that our investors use it in a similar fashion to evaluate certain characteristics of our Portfolio compared to our peers, and as such, we believe that the disclosure of portfolio yield is useful to our investors.
Our Portfolio totaled approximately $2.1 billion with a portfolio yield of 7.6% and 6.8% as of December 31, 2019 and 2018, respectively. See Note 6 to our financial statements and MD&A - Our Business in this Form 10-K for additional discussion of the characteristics of our portfolio as of December 31, 2019.
Environmental Metrics
As discussed in Item 1. Business, as part of our investment process, we calculate the estimated metric tons of CO2 equivalent emissions, or carbon emissions avoided by our investments. In this calculation which we refer to as CarbonCount®, we apply emissions factor data from the U.S. Government or the International Energy Administration to an estimate of a project’s energy production or savings to compute an estimate of metric tons of carbon emissions avoided. We estimate that our investments originated in 2019 will reduce annual carbon emissions by approximately 385 thousand metric tons.
In assessing our performance and results of operations, we also consider the impact of our operations on the environment. We utilize the carbon emissions categorizations established by the World Resources Institute Greenhouse Gas Protocol Corporate Standards (“Standards”) to set goals and calculate our estimated emissions. The categorizations are as follows:
• |
Scope 1 GHG emissions - Direct emissions - Emissions from operations that are owned or controlled by the reporting company.
|
- 66 -
• |
Scope 2 GHG emissions - Indirect emissions - Emissions from the generation of purchased or acquired energy such as electricity, steam, heating or cooling, consumed by the reporting company.
|
• |
Scope 3 GHG emissions - Indirect emissions - All other indirect emissions that occur in the value chain of the reporting company, including both upstream and downstream emissions.
|
The table below illustrates our goals and performance for 2019 in metric tons (“MT”).
Category |
Goal |
Performance |
||
Scope 1 GHG emissions |
0 MT |
0 MT |
||
Scope 2 GHG emissions |
0 MT |
0 MT1
|
||
Scope 3 GHG emissions |
0 MT2
|
< 600 MT2
|
||
(1) |
Performance stated is market-based which includes the impact of purchasing carbon offsets.
|
(2) |
Our stated actual performance for Scope 3 GHG emissions does not include the carbon emissions reductions as a result of our investments. The first year carbon emissions reductions as a result of our investments originated in 2019 are 385 thousand MT.
|
Liquidity and Capital Resources
Liquidity is a measure of our ability to meet potential short term (within one year) and long term cash requirements, including ongoing commitments to repay borrowings, fund and maintain our current and future assets, make distributions to our stockholders and other general business needs. We will use significant cash to make investments in sustainable infrastructure, repay principal and interest on our borrowings, make distributions to our stockholders and fund our operations. We use borrowings as part of our financing strategy to increase potential returns to our stockholders and have available to us a broad range of financing sources. We finance our investments primarily with non-recourse or recourse debt, equity and off-balance sheet securitization structures.
During 2019, we issued our first senior unsecured notes at a total principal amount of $500 million, for total cash proceeds of $507 million. We believe that this access to the corporate debt markets has provided us an additional funding source when financing our Portfolio. In the fourth quarter of 2019, we issued $96 million of non-recourse debt with a legal maturity of 2047 with several of our land assets as collateral.
We have two senior secured revolving credit facilities (“Rep-Based Facility” and “Approval-Based Facility”) with several lenders with a combined maximum outstanding balance of $450 million. For additional information on our credit facilities, see Note 7 to our audited financial statements on this Form 10-K. As of December 31, 2019, we had approximately $700 million of non-recourse borrowings. We have $150 million of convertible notes outstanding. We also continue to utilize off-balance sheet securitization transactions, where we transfer the loans or other assets we originate to securitization trusts or other bankruptcy remote special purpose funding vehicles that are not consolidated on our balance sheet. As of December 31, 2019, the outstanding principal balance of our assets financed through the use of these off-balance sheet transactions was approximately $4.1 billion.
During the year ended December 31, 2019, we raised approximately $138 million of equity, including $129 million of utilizing our “at-the-market” equity distribution program (our “ATM program”), pursuant to which we can offer to sell, from time to time, up to an aggregate amount of $250 million of our common stock. We also raised $9 million through the exercise of the underwriters’ option to purchase additional shares related to our December 2018 equity offering. For additional information related to our equity raises see Note 11 to our audited financial statements of this Form 10-K.
Large institutional investors have provided the financing for our on and off-balance sheet financings. We have worked to expand our liquidity and access to the debt and bank loan markets and have entered into transactions with a number of new institutional investors in the last year. For further information on the credit facilities, senior unsecured notes, asset backed non-recourse debt, convertible notes, and securitizations, see Notes 5, 7 and 8 to our audited financial statements of this Form 10-K.
We plan to raise additional equity capital and continue to use fixed and floating rate borrowings which may be in the form of additional bank credit facilities (including term loans and revolving facilities), warehouse facilities, repurchase agreements and public and private equity and debt issuances as a means of financing our business. We also expect to use both on-balance sheet and non-consolidated securitizations and also believe we will be able to customize securitized tranches to meet investment preferences of different investors. We may also consider the use of separately funded special purpose entities or funds to allow us to expand our investments or to manage our Portfolio diversification.
The decision on how we finance specific assets or groups of assets is largely driven by cost, availability of financing options, capital requirements and risk and portfolio and financial management considerations, including the potential for gain on sale or fee income, as well as the overall interest rate environment, prevailing credit spreads and the terms of available
- 67 -
financing and market conditions. Over time, as market conditions change, we may use other forms of debt and equity in addition to these financing arrangements.
The amount of leverage we may deploy for particular assets will depend upon the availability of particular types of financing and our assessment of the credit, liquidity, price volatility and other risks of those assets, the interest rate environment and the credit quality of our financing counterparties. As shown in the table below, our debt to equity ratio was approximately 1.5 to 1 as of December 31, 2019, which is below our leverage limit of up to 2.5 to 1. We will continue to evaluate the appropriate level of debt and may, over time, make additional changes to our targeted levels. Our percentage of fixed rate debt was approximately 98% as of December 31, 2019. In February 2020, our board of directors increased our targeted fixed-rate debt range from 60% to 85% to 75% to 100% due to the addition of senior unsecured note issuances and lower use of our floating rate credit facilities.
The calculation of our fixed-rate debt and leverage as of December 31, 2019 and 2018 is shown in the chart below:
December 31, 2019 |
% of Total |
December 31, 2018 |
% of Total |
||||||||||
(dollars in millions) |
(dollars in millions) |
||||||||||||
Floating-rate borrowings |
$ |
33 |
2 |
% |
$ |
317 |
26 |
% |
|||||
Fixed-rate debt |
1,360 |
98 |
% |
925 |
74 |
% |
|||||||
Total debt (1)
|
$ |
1,393 |
100 |
% |
$ |
1,242 |
100 |
% |
|||||
Equity |
$ |
940 |
$ |
805 |
|||||||||
Leverage |
1.5 to 1 |
1.5 to 1 |
|||||||||||
(1) |
Floating-rate borrowings include borrowings under our floating-rate credit facilities and approximately $2 million and approximately $58 million of non-recourse debt with floating rate exposure as of December 31, 2019 and December 31, 2018, respectively. Fixed-rate debt includes the present notional value of non-recourse debt that is hedged using interest rate swaps. Debt excludes securitizations that are not consolidated on our balance sheet.
|
We intend to use leverage for the primary purpose of financing our Portfolio and business activities and not for the purpose of speculating on changes in interest rates. While we may temporarily exceed the leverage limit, if our board of directors approves a material change to this limit, we anticipate advising our stockholders of this change through disclosure in our periodic reports and other filings under the Exchange Act.
While we generally intend to hold our target assets that we do not securitize upon acquisition as long term investments, certain of our investments may be sold in order to manage our interest rate risk and liquidity needs, to meet other operating objectives and to adapt to market conditions. The timing and impact of future sales of receivables and investments, if any, cannot be predicted with any certainty. Since we expect that our assets will generally be financed, we expect that in certain cases a significant portion of the proceeds from sales of our assets (if any), prepayments and scheduled amortization will be used to repay balances under our financing sources.
We believe these identified sources of liquidity in addition to our cash on hand will be adequate for purposes of meeting our short-term and long-term liquidity needs, which include funding future investments, debt service, operating costs and distributions to our stockholders. To qualify as a REIT, we must distribute annually at least 90% of our REIT’s taxable income without regard to the deduction for dividends paid and excluding net capital gains. These dividend requirements limit our ability to retain earnings and thereby replenish or increase capital for growth and our operations.
Sources and Uses of Cash
We had approximately $107 million and $59 million unrestricted cash, cash equivalents, and restricted cash as of December 31, 2019 and 2018, respectively.
Cash Flows Relating to Operating Activities
Net cash provided by operating activities was approximately $29 million for the year ended December 31, 2019, driven primarily by net income of $82 million, less adjustments for non-cash and other items of $53 million. The non-cash and other adjustments consisted of increases of $10 million of depreciation and amortization, $14 million related to equity-based compensation, $5 million related to accounts payable and accrued expenses, $13 million for gain on sale of receivables and investments, and $8 million for provision for loss on receivables. These increases were offset by $56 million related to non-cash gains on securitizations, $34 million related to equity method investments, and $13 million related to other items.
Net cash provided by operating activities was approximately $59 million for the year ended December 31, 2018, driven primarily by net income of $42 million, plus adjustments for non-cash and other items of $17 million. The non-cash and other adjustments consisted of increases of $15 million of depreciation and amortization, $13 million related to receivables held-for-sale, $10 million related to equity-based compensation, $7 million related to accounts payable and accrued expenses, $4 million
- 68 -
related to equity method investments, and $9 million related to cost associated with the repayment of the residential solar related debt. These were offset by $26 million related to gains on securitizations and $15 million related to other items.
Cash Flows Relating to Investing Activities
Net cash used in investing activities was approximately $201 million for the year ended December 31, 2019. We collected payments of $64 million from receivables and fixed rate debt securities and received $274 million from the sale of financial assets. We also collected $71 million from equity method investments which are considered return of capital determined under GAAP, received $81 million from the sale of equity method investments, withdrew $31 million from escrow accounts, and had other cash inflows of $2 million. These were offset by investments in receivables and fixed rate debt securities of $543 million, equity method investments of $152 million, and funding of escrow accounts of $29 million.
Net cash provided by investing activities was approximately $51 million for the year ended December 31, 2018. We collected $351 million from receivables and fixed rate debt securities, which includes the $300 million collected from the repayment of the residential solar assets. We also collected $88 million from equity method investments representing the return of capital determined under GAAP, received $36 million from the sale of equity method investments, and withdrew $33 million from escrow accounts. We made $318 million of investments in receivables and fixed rate debt-securities, made $28 million of investments in real estate, made $76 million of equity method investments, and funded escrow accounts for $35 million.
Cash Flows Relating to Financing Activities
Net cash provided by financing activities was approximately $219 million for the year ended December 31, 2019. We received proceeds from credit facilities of $102 million, proceeds from non-recourse debt of $131 million, proceeds from the issuance of senior unsecured debt of $507 million, and net proceeds from common stock issuances of $138 million. These were partially offset by principal payments on credit facilities of $328 million, principal payments on non-recourse debt of $207 million, payments of deferred funding obligations of $19 million, and payments of dividends, distributions, and other financing activities of $105 million.
Net cash used in financing activities was approximately $168 million for the year ended December 31, 2018. We had non-recourse debt borrowings of $69 million, borrowings from our credit facilities of $172 million, and received $187 million of net proceeds from the issuance of common stock. We made $390 million of principal payments on non-recourse debt, which includes the $250 million debt repayment related to the repayment of the residential solar assets. We also made, $47 million of principal payments on credit facilities, $74 million of payments on deferred funding obligations, paid $71 million of dividends and distributions, and had other cash outflows of $14 million.
Contractual Obligations and Commitments
The following table provides a summary of our contractual obligations as of December 31, 2019:
Payment due by Period |
||||||||||||||||||||
Contractual Obligations |
Total |
Less than
1 year
|
1 - 3 Years |
3 - 5 Years |
More than
5 years
|
|||||||||||||||
(in millions) |
||||||||||||||||||||
Credit facilities |
$ |
31 |
$ |
— |
$ |
8 |
$ |
23 |
$ |
— |
||||||||||
Interest on credit facilities (1)
|
3 |
— |
2 |
1 |
— |
|||||||||||||||
Non-recourse debt (2)
|
716 |
88 |
52 |
91 |
485 |
|||||||||||||||
Interest on non-recourse debt (2)
|
258 |
27 |
51 |
44 |
136 |
|||||||||||||||
Senior unsecured notes (3)
|
500 |
— |
— |
500 |
— |
— |
||||||||||||||
Interest on senior unsecured notes |
133 |
27 |
53 |
53 |
— |
|||||||||||||||
Convertible notes (4)
|
150 |
— |
150 |
— |
— |
|||||||||||||||
Interest on convertible notes |
18 |
6 |
12 |
— |
— |
|||||||||||||||
Operating lease obligations |
4 |
1 |
1 |
1 |
1 |
|||||||||||||||
Total |
$ |
1,813 |
$ |
149 |
$ |
329 |
$ |
713 |
$ |
622 |
||||||||||
(1) |
Interest is calculated based on the interest rate in effect at December 31, 2019, and includes all interest expense incurred and expected to be incurred in the future based on the current principal balance through the contractual maturity of the credit facilities.
|
(2) |
These amounts exclude $16 million of unamortized debt issuance costs. Interest is calculated based on the interest rate in effect at December 31, 2019, including the effect of interest rate hedges as applicable.
|
(3) |
Excludes $8 million of unamortized debt issuance costs and $7 million of unamortized issuance premium. |
(4) |
Excludes $2 million of unamortized debt issuance costs. |
- 69 -
Off-Balance Sheet Arrangements
We have relationships with non-consolidated entities or financial partnerships, such as entities often referred to as structured investment vehicles, or special purpose or variable interest entities, established to facilitate the sale of securitized assets. Other than our securitization assets (including any outstanding servicer advances) of approximately $124 million as of December 31, 2019, that may be at risk in the event of defaults or prepayments in our securitization trusts and as discussed below, we have not guaranteed any obligations of non-consolidated entities or entered into any commitment or intent to provide additional funding to any such entities. A more detailed description of our relations with non-consolidated entities can be found in Note 2 of our audited financial statements included in this Form 10-K.
In connection with some of our transactions, we have provided certain limited guaranties to other transaction participants covering the accuracy of certain limited representations, warranties or covenants and provided an indemnity against certain losses from “bad acts” including fraud, failure to disclose a material fact, theft, misappropriation, voluntary bankruptcy or unauthorized transfers. We have also guaranteed our compliance with certain tax matters, such as negatively impacting the investment tax credit and certain other obligations in the event of a change in ownership or our exercising certain protective rights.
Dividends
U.S. federal income tax law generally requires that a REIT distribute annually at least 90% of its REIT taxable income, without regard to the deduction for dividends paid and excluding net capital gains, and that it pays tax at regular corporate rates to the extent that it annually distributes less than 100% of its REIT taxable income. Our current policy is to pay quarterly distributions, which on an annual basis will equal or exceed substantially all of our REIT taxable income. The taxable income of the REIT can vary from our GAAP earnings due to a number of different factors, including, the book to tax timing differences of income and expense recognition from our transactions as well as the amount of taxable income of our TRSs distributed to the REIT. See Note 10 regarding the amount of our distributions that are taxed as ordinary income to our stockholders.
Any distributions we make will be at the discretion of our board of directors and will depend upon, among other things, our actual results of operations. These results and our ability to pay distributions will be affected by various factors, including the net interest and other income from our portfolio, our operating expenses and any other expenditures. In the event that our board of directors determines to make distributions in excess of the income or cash flow generated from our assets, we may make such distributions from the proceeds of future offerings of equity or debt securities or other forms of debt financing or the sale of assets. To the extent that in respect of any calendar year, cash available for distribution is less than our taxable income, or our declared distribution we could be required to sell assets, borrow funds, or raise additional capital to make cash distributions or make a portion of the required distribution in the form of a taxable stock distribution or distribution of debt securities. We will generally not be required to make distributions with respect to activities conducted through our domestic TRSs.
To the extent that we generate taxable income, distributions to our stockholders generally will be taxable as ordinary income, although all or a portion of such distributions may be designated by us as a qualified dividend or capital gain. Beginning in 2018 (and through taxable years ending in 2025), a deduction is permitted for certain pass-through business income, including “qualified REIT dividends” (generally, dividends received by a REIT shareholder that are not designated as capital gain dividends or qualified dividend income), which will allow U.S. individuals, trusts, and estates to deduct up to 20% of such amounts, subject to certain limitations, resulting in an effective maximum U.S. federal income tax rate of 29.6% on such qualified REIT dividends. In the event we make distributions to our stockholders in excess of our taxable income, the excess will constitute a return of capital. In addition, a portion of such distributions may be taxable stock dividends payable in our shares. We will furnish annually to each of our stockholders a statement setting forth distributions paid during the preceding year and their characterization as ordinary income, return of capital, qualified dividend income or capital gain.
The dividends declared in 2019 and 2018 are described in Note 11 of the audited financial statements in this Form 10-K.
- 70 -
Book Value Considerations
As of December 31, 2019, we carried only our investments, interest rate swaps and residual assets in securitized financial assets at fair value on our balance sheet. As a result, in reviewing our book value, there are a number of important factors and limitations to consider. Other than our investments, interest rate swaps and the residual assets in securitized receivables that are carried on our balance sheet at fair value as of December 31, 2019, the carrying value of our remaining assets and liabilities are calculated as of a particular point in time, which is largely determined at the time such assets and liabilities were added to our balance sheet using a cost basis in accordance with GAAP. As such, our remaining assets and liabilities do not incorporate other factors that may have a significant impact on their value, most notably any impact of business activities, changes in estimates, or changes in general economic conditions, interest rates or commodity prices since the dates the assets or liabilities were initially recorded. Accordingly, our book value does not necessarily represent an estimate of our net realizable value, liquidation value or our market value as a whole.
Inflation
We do not anticipate that inflation will have a significant effect on our results of operations. However, in the event of a significant increase in inflation, interest rates could rise and our projects and investments may be materially adversely affected.
Item 7A. |
Quantitative and Qualitative Disclosures about Market Risk |
We anticipate that our primary market risks will be related to, the credit quality of our counterparties and project companies, market interest rates, the liquidity of our assets, commodity prices, and environmental factors. We will seek to manage these risks while, at the same time, seeking to provide an opportunity to stockholders to realize attractive returns through ownership of our common stock.
Credit Risks
We source and identify quality opportunities within our broad areas of expertise and apply our rigorous underwriting processes to our transactions, which, we believe, will generally enable us to minimize our credit losses and maintain access to attractive financing. In the case of various renewable energy and other sustainable infrastructure projects, we will be exposed to the credit risk of the obligor of the project’s PPA or other long-term contractual revenue commitments, as well as to the credit risk of certain suppliers and project operators. While we do not anticipate facing significant credit risk in our assets related to government energy efficiency projects, we are subject to varying degrees of credit risk in these projects in relation to guarantees provided by ESCOs where payments under energy savings performance contracts are contingent upon achieving pre-determined levels of energy savings. We are exposed to credit risk in our other projects that do not benefit from governments as the obligor such as on balance sheet financing of projects undertaken by universities, schools and hospitals, as well as privately owned commercial projects. Our level of credit risk has increased, and is expected to continue to increase, as our strategy contemplates additional investments in mezzanine debt and equity. We seek to manage credit risk through thorough due diligence and underwriting processes, strong structural protections in our transaction agreements with customers and continual, active asset management and portfolio monitoring. Nevertheless, unanticipated credit losses could occur and during periods of economic downturn in the global economy, our exposure to credit risks from obligors increases, and our efforts to monitor and mitigate the associated risks may not be effective in reducing our credit risks.
We utilize a risk rating system to evaluate projects that we target. We first evaluate the credit rating of the obligors involved in the project using an average of the external credit ratings for an obligor, if available, or an estimated internal rating based on a third-party credit scoring system. We then estimate the probability of default and estimated recovery rate based on the obligors’ credit ratings and the terms of the contract. We also review the performance of each investment, including through, as appropriate, a review of project performance, monthly payment activity and active compliance monitoring, regular communications with project management and, as applicable, its obligors, sponsors and owners, monitoring the financial performance of the collateral, periodic property visits and monitoring cash management and reserve accounts. The results of our reviews are used to update the project’s risk rating as necessary. Additional detail of the credit risks surrounding our Portfolio can be found in Note 6 of our financial statements included in this Form 10-K.
Interest Rate and Borrowing Risks
Interest rate risk is highly sensitive to many factors, including governmental monetary and tax policies, domestic and international economic and political considerations and other factors beyond our control.
We are subject to interest rate risk in connection with new asset originations and our borrowings, including our credit facilities, and in the future, any new floating rate assets, credit facilities or other borrowings. Because short-term borrowings are generally short-term commitments of capital, lenders may respond to market conditions, making it more difficult for us to secure continued financing. If we are not able to renew our then existing borrowings or arrange for new financing on terms acceptable to us, or if we default on our covenants or are otherwise unable to access funds under any of these borrowings, we
- 71 -
may have to curtail our origination of new assets and/or dispose of assets. We face particular risk in this regard given that we expect many of our borrowings will have a shorter duration than the assets they finance. Increasing interest rates may reduce the demand for our investments while declining interest rates may increase the demand. Both our current and future credit facilities and other borrowings may be of limited duration and are periodically refinanced at then current market rates. We attempt to reduce interest rate risks and to minimize exposure to interest rate fluctuations through the use of fixed rate financing structures, when appropriate, whereby we seek to (1) match the maturities of our debt obligations with the maturities of our assets, (2) borrow at fixed rates for a period of time, or (3) match the interest rates on our assets with like-kind debt (i.e., we may finance floating rate assets with floating rate debt and fixed-rate assets with fixed-rate debt), directly or through the use of interest rate swap agreements, interest rate cap agreements or other financial instruments, or through a combination of these strategies. We expect these instruments will allow us to minimize, but not eliminate, the risk that we must refinance our liabilities before the maturities of our assets and to reduce the impact of changing interest rates on our earnings. In addition to the use of traditional derivative instruments, we also seek to mitigate interest rate risk by using securitizations, syndications and other techniques to construct a portfolio with a staggered maturity profile. We monitor the impact of interest rate changes on the market for new originations and often have the flexibility to negotiate the term of our investments to offset interest rate increases.
Typically, our long-term debt is at fixed rates or we have used interest rate hedges that convert most of the floating rate debt to fixed rate. If interest rates rise, and our fixed rate debt balance remains constant, we expect the fair value of our fixed rate debt to decrease and the value of our hedges on floating rate debt to increase. See Note 3 to our financial statements in this Form 10-K for the estimated fair value of our fixed rate long-term debt, which is based on having the same debt service requirements that could have been borrowed at the date presented, at prevailing current market interest rates. We carry our interest rate hedges at fair value in our balance sheet.
Our credit facilities are variable rate lines or credit with approximately $31 million outstanding as of December 31, 2019 and we have approximately $2 million of variable rate exposure under our non-recourse debt. Increases in interest rates would result in higher interest expense while decreases in interest rates would result in lower interest expense. As described above, we may use various financing techniques including interest rate swap agreements, interest rate cap agreements or other financial instruments, or a combination of these strategies to mitigate the variable interest nature of these facilities. A 50 basis point increase in LIBOR would increase the quarterly interest expense related to the $33 million in variable rate borrowings by $41 thousand. Such hypothetical impact of interest rates on our variable rate borrowings does not consider the effect of any change in overall economic activity that could occur in a rising interest rate environment. Further, in the event of such a change in interest rates, we may take actions to further mitigate our exposure to such a change. However, due to the uncertainty of the specific actions that would be taken and their possible effects, the analysis assumes no changes in our financial structure.
We record certain of our assets at fair value in our financial statements and any changes in the discount rate would impact the value of these assets. See Note 3 of the audited financial statements in this Form 10-K.
Liquidity and Concentration Risk
The assets that comprise our asset portfolio are not and are not expected to be publicly traded. A portion of these assets may be subject to legal and other restrictions on resale or will otherwise be less liquid than publicly-traded securities. The illiquidity of our assets may make it difficult for us to sell such assets if the need or desire arises, including in response to changes in economic and other conditions. Certain of the projects in which we invest have one obligor and thus we are subject to concentration risk for these investments and could incur significant losses if any of these projects perform poorly or if we are required to write down the value of any of these projects. Many of our assets, or the collateral supporting those assets, are concentrated in certain geographic areas, which may make those assets or the related collateral more susceptible to natural disasters or other events. See also “Credit Risks” discussed above.
Commodity Price Risk
When we make equity or debt investments for a renewable energy project that acts as a substitute for an underlying commodity, we may be exposed to volatility in prices for that commodity. The performance of renewable energy projects that produce electricity can be impacted by volatility in the market prices of various forms of energy, including electricity, coal and natural gas. This is especially true for utility scale projects that sell power on a wholesale basis such as many of our Grid-Connected projects as opposed to Behind-the-Meter projects which compete against the retail or delivered costs of electricity which includes the cost of transmitting and distributing the electricity to the end user.
Although we generally focus on renewable energy projects that have the majority of their operating cash flow supported by long term PPAs or leases, many of our projects have shorter term contracts (which may have the potential of producing higher current returns) or sell their power in the open market on a merchant basis, the cash flows of such projects, and thus the repayment of, or the returns available for, our assets, are subject to risk if energy prices change. We also attempt to mitigate our exposure through structural protections. These structural protections, which are typically in the form of a preferred return mechanism, are designed to allow recovery of our capital and an acceptable return over time. When structuring and
- 72 -
underwriting these transactions, we evaluate these transactions using a variety of scenarios, including natural gas prices remaining low for an extended period of time. Despite these protections, as low natural gas prices continue or PPAs expire, the cash flows from these projects are exposed to these market conditions and we work with the projects sponsors to minimize any impact as part of our on-going active asset management and portfolio monitoring. In the case of utility scale solar projects, we focus on owning the land under the project where our rent is paid out of project operational costs before the debt or equity in the project receives any payments.
We believe the current low prices in natural gas will increase demand for some types of our projects, such as combined heat and power, but may reduce the demand for other projects such as renewable energy that may be a substitute for natural gas. We seek to structure our energy efficiency investments so that we typically avoid exposure to commodity price risk. However, volatility in energy prices may cause building owners and other parties to be reluctant to commit to projects for which repayment is based upon a fixed monetary value for energy savings that would not decline if the price of energy declines.
Environmental Risks
Our business is impacted by the effects of climate change and various related regulatory responses. We discuss the risks and opportunities associated with the impacts of climate change in Item 7. Management’s Discussion and Analysis of Financial Condition and Results of Operations - Impact of climate change on our future operations. This discussion outlines potential qualitative impacts to our business, quantitative illustrations of sensitivity as well as our strategy and resilience to these risks and opportunities.
Risk Management
Our ongoing active asset management and portfolio monitoring processes provide investment oversight and valuable insight into our origination, underwriting and structuring processes. These processes create value through active monitoring of the state of our markets, enforcement of existing contracts and asset management. As described above, we engage in a variety of interest rate management techniques that seek to mitigate the economic effect of interest rate changes on the values of, and returns on, some of our assets. While there have only been two credit losses, amounting to approximately $19 million (net of recoveries) on the approximately $7 billion of transactions we originated since 2012, which represents an aggregate loss of less than approximately 0.3% on cumulative transactions originated over this time period, there can be no assurance that we will continue to be as successful, particularly as we invest in more credit sensitive assets or more equity investments and engage in increasing numbers of transactions with obligors other than U.S. federal government agencies. We seek to manage credit risk using thorough due diligence and underwriting processes, strong structural protections in our loan agreements with customers and continual, active asset management and portfolio monitoring. Additionally, we have established a Finance and Risk Committee of our board of directors which discusses and reviews policies and guidelines with respect to our risk assessment and risk management for various risks, including, but not limited to, our interest rate, counter party, credit, capital availability, and refinancing risks. As it relates to environmental risks, when we underwrite and structure our investments the environmental risks and opportunities are an integral consideration to our investment parameters. While we cannot fully protect our investments, we seek to mitigate these risks by using third party experts to conduct engineering and weather analysis and insurance reviews as apprporiate. Once a transaction has closed we continue to monitor the environmental risks to the portfolio. We further discuss our strategy to managing these risks in Item 7. Management’s Discussion and Analysis of Financial Condition and Results of Operations - Impact of climate change on our future operations.
- 73 -
Item 8. |
Financial Statements and Supplementary Data |
Hannon Armstrong Sustainable Infrastructure Capital, Inc., Consolidated Financial Statements, For the Years Ended December 31, 2019, 2018 and 2017 | |
- 74 -
Report of Independent Registered Public Accounting Firm
To the Stockholders and the Board of Directors of
Hannon Armstrong Sustainable Infrastructure Capital, Inc.
Opinion on the Financial Statements
We have audited the accompanying consolidated balance sheets of Hannon Armstrong Sustainable Infrastructure Capital, Inc. (the Company) as of December 31, 2019 and 2018, the related consolidated statements of operations, comprehensive income, stockholders’ equity and cash flows for each of the three years in the period ended December 31, 2019, and the related notes (collectively referred to as the “consolidated financial statements”). In our opinion, the consolidated financial statements present fairly, in all material respects, the financial position of the Company at December 31, 2019, and 2018, and the results of its operations and its cash flows for each of the three years in the period ended December 31, 2019, in conformity with U.S. generally accepted accounting principles.
We also have audited, in accordance with the standards of the Public Company Accounting Oversight Board (United States) (PCAOB), the Company’s internal control over financial reporting as of December 31, 2019, based on criteria established in Internal Control-Integrated Framework issued by the Committee of Sponsoring Organizations of the Treadway Commission (2013 framework), and our report dated February 24, 2020 expressed an unqualified opinion thereon.
Basis for Opinion
These financial statements are the responsibility of the Company’s management. Our responsibility is to express an opinion on the Company’s financial statements based on our audits. We are a public accounting firm registered with the PCAOB and are required to be independent with respect to the Company in accordance with the U.S. federal securities laws and the applicable rules and regulations of the Securities and Exchange Commission and the PCAOB.
We conducted our audits in accordance with the standards of the PCAOB. Those standards require that we plan and perform the audit to obtain reasonable assurance about whether the financial statements are free of material misstatement, whether due to error or fraud. Our audits included performing procedures to assess the risks of material misstatement of the financial statements, whether due to error or fraud, and performing procedures that respond to those risks. Such procedures included examining, on a test basis, evidence regarding the amounts and disclosures in the financial statements. Our audits also included evaluating the accounting principles used and significant estimates made by management, as well as evaluating the overall presentation of the financial statements. We believe that our audits provide a reasonable basis for our opinion.
Critical Audit Matter
The critical audit matter communicated below is a matter arising from the current period audit of the financial statements that was communicated or required to be communicated to the audit committee and that: (1) relates to accounts or disclosures that are material to the financial statements and (2) involved our especially challenging, subjective or complex judgments. The communication of the critical audit matter does not alter in any way our opinion on the consolidated financial statements, taken as a whole, and we are not, by communicating the critical audit matter below, providing a separate opinion on the critical audit matter or on the account or disclosure to which it relates.
- 75 -
Accounting for Equity Investments in Renewable Energy and Energy Efficiency Projects | |
Description of the Matter |
As discussed in Note 2 to the consolidated financial statements, the Company makes equity investments in renewable energy and energy efficiency projects that are accounted for under the equity method of accounting. During the year ended December 31, 2019, the Company made new equity investments in renewable energy and energy efficiency projects amounting to $152 million and held $499 million of equity investments in renewable energy and energy efficiency projects as of December 31, 2019. The Company’s determination that it does not have the power to direct the significant activities impacting each of the investees’ economic performance (“power”) is critical to its determination that it is not the primary beneficiary of the investee. Also, as described in Note 2 to the consolidated financial statements, for equity method investments that contain cash flow preferences in their respective limited liability company agreements (“LLC Agreements”), the Company applies the Hypothetical Liquidation at Book Value (“HLBV”) method to record its share of profits and losses on these investments.
Auditing the Company’s determination of whether it has power was complex and required significant judgment to determine both the activities of the investee that most significantly impact the investee’s economics, and the distribution of the power among the members of the investee that ultimately determine the outcome of such activities. In addition, auditing the Company’s application of the HLBV method was challenging and inherently complex, because the application is based on its interpretations of the liquidation provisions outlined within investees’ LLC Agreements.
|
How We Addressed the Matter in our Audit |
We tested controls that address the risks of material misstatement relating to: i) the determination of whether the Company has the power to direct the significant activities of the investees and ii) the recognition of its share of investees’ profits and losses through use of the HLBV method. For example, we tested controls over management’s review of the variable interest model and determination of whether the Company has power. We also tested controls over management’s review of the HLBV method, including the application of the liquidation provisions.
To evaluate whether the Company has power over each investee, our audit procedures included, among others, inspecting LLC Agreements and evaluating management’s analysis of the significant activities of the investee and which parties can direct those significant activities. For example, as part of our evaluation, we considered the purpose and design of the investee and the legal rights of each of the involved parties, including the significance of the decisions that each party makes. We also tested the rights of each party included in management’s analysis by comparing such rights to the LLC Agreements.
We tested the Company’s application of the HLBV method for a sample of both new and existing investments. Our audit procedures included, among others, involving tax professionals to assist in evaluating the Company’s application of the liquidation provisions within the LLC Agreements. Specifically, we assessed the Company’s HLBV calculations by agreeing inputs to the calculations, such as the application of stated preferred returns and allocation of tax attributes, to the terms of the LLC Agreements for each of these investments. We also performed additional procedures on the Company’s HLBV calculations that included recalculating the stated preferred returns, allocations of tax attributes, and the Company’s share of profits and losses of the investee.
|
/s/ Ernst & Young LLP
We have served as the Company’s auditor since 1983.
Tysons, Virginia
February 24, 2020
- 76 -
Report of Independent Registered Public Accounting Firm
To the Stockholders and the Board of Directors of
Hannon Armstrong Sustainable Infrastructure Capital, Inc.
Opinion on Internal Control Over Financial Reporting
We have audited Hannon Armstrong Sustainable Infrastructure Capital, Inc.’s internal control over financial reporting as of December 31, 2019, based on criteria established in Internal Control-Integrated Framework issued by the Committee of Sponsoring Organizations of the Treadway Commission (2013 framework) (the COSO criteria). In our opinion, Hannon Armstrong Sustainable Infrastructure Capital, Inc. (the Company) maintained, in all material respects, effective internal control over financial reporting as of December 31, 2019, based on the COSO criteria.
We also have audited, in accordance with the standards of the Public Company Accounting Oversight Board (United States) (PCAOB), the consolidated balance sheets of the Company as of December 31, 2019 and 2018, the related consolidated statements of operations, comprehensive income, stockholders’ equity and cash flows for each of the three years in the period ended December 31, 2019, and the related notes and our report dated February 24, 2020 expressed an unqualified opinion thereon.
Basis for Opinion
The Company’s management is responsible for maintaining effective internal control over financial reporting and for its assessment of the effectiveness of internal control over financial reporting included in the accompanying Management’s Report on Internal Control Over Financial Reporting. Our responsibility is to express an opinion on the Company’s internal control over financial reporting based on our audit. We are a public accounting firm registered with the PCAOB and are required to be independent with respect to the Company in accordance with the U.S. federal securities laws and the applicable rules and regulations of the Securities and Exchange Commission and the PCAOB.
We conducted our audit in accordance with the standards of the PCAOB. Those standards require that we plan and perform the audit to obtain reasonable assurance about whether effective internal control over financial reporting was maintained in all material respects.
Our audit included obtaining an understanding of internal control over financial reporting, assessing the risk that a material weakness exists, testing and evaluating the design and operating effectiveness of internal control based on the assessed risk, and performing such other procedures as we considered necessary in the circumstances. We believe that our audit provides a reasonable basis for our opinion.
Definition and Limitations of Internal Control Over Financial Reporting
A company’s internal control over financial reporting is a process designed to provide reasonable assurance regarding the reliability of financial reporting and the preparation of financial statements for external purposes in accordance with generally accepted accounting principles. A company’s internal control over financial reporting includes those policies and procedures that (1) pertain to the maintenance of records that, in reasonable detail, accurately and fairly reflect the transactions and dispositions of the assets of the company; (2) provide reasonable assurance that transactions are recorded as necessary to permit preparation of financial statements in accordance with generally accepted accounting principles, and that receipts and expenditures of the company are being made only in accordance with authorizations of management and directors of the company; and (3) provide reasonable assurance regarding prevention or timely detection of unauthorized acquisition, use, or disposition of the company’s assets that could have a material effect on the financial statements.
Because of its inherent limitations, internal control over financial reporting may not prevent or detect misstatements. Also, projections of any evaluation of effectiveness to future periods are subject to the risk that controls may become inadequate because of changes in conditions, or that the degree of compliance with the policies or procedures may deteriorate.
/s/ Ernst & Young LLP
Tysons, Virginia
February 24, 2020
- 77 -
HANNON ARMSTRONG SUSTAINABLE INFRASTRUCTURE CAPITAL, INC.
CONSOLIDATED BALANCE SHEETS
(DOLLARS IN THOUSANDS, EXCEPT PER SHARE DATA)
December 31, 2019 |
December 31, 2018 |
||||||
Assets |
|||||||
Cash and cash equivalents |
$ |
$ |
|||||
Equity method investments |
|||||||
Government receivables |
|||||||
Commercial receivables, net of allowance |
|||||||
Real estate |
|||||||
Investments |
|||||||
Securitization assets |
|||||||
Other assets |
|||||||
Total Assets |
$ |
$ |
|||||
Liabilities and Stockholders’ Equity |
|||||||
Liabilities: |
|||||||
Accounts payable, accrued expenses and other |
$ |
$ |
|||||
Deferred funding obligations |
|||||||
Credit facilities |
|||||||
Non-recourse debt (secured by assets of $921 million and $1,105 million, respectively) |
|||||||
Senior unsecured notes |
|||||||
Convertible notes |
|||||||
Total Liabilities |
|||||||
Stockholders’ Equity: |
|||||||
Preferred stock, par value $0.01 per share, 50,000,000 shares authorized, no shares issued and outstanding |
|||||||
Common stock, par value $0.01 per share, 450,000,000 shares authorized, 66,338,120 and 60,510,086 shares issued and outstanding, respectively |
|||||||
Additional paid in capital |
|||||||
Accumulated deficit |
( |
) |
( |
) |
|||
Accumulated other comprehensive income (loss) |
( |
) |
|||||
Non-controlling interest |
|||||||
Total Stockholders’ Equity |
|||||||
Total Liabilities and Stockholders’ Equity |
$ |
$ |
|||||
See accompanying notes.
- 78 -
HANNON ARMSTRONG SUSTAINABLE INFRASTRUCTURE CAPITAL, INC.
CONSOLIDATED STATEMENTS OF OPERATIONS
(DOLLARS IN THOUSANDS, EXCEPT PER SHARE DATA)
Years Ended December 31, |
|||||||||||
2019 |
2018 |
2017 |
|||||||||
Revenue |
|||||||||||
Interest income |
$ |
$ |
$ |
||||||||
Rental income |
|||||||||||
Gain on sale of receivables and investments |
|||||||||||
Fee income |
|||||||||||
Total revenue |
|||||||||||
Expenses |
|||||||||||
Interest expense |
|||||||||||
Provision for loss on receivables |
|||||||||||
Compensation and benefits |
|||||||||||
General and administrative |
|||||||||||
Total expenses |
|||||||||||
Income before equity method investments |
|||||||||||
Income (loss) from equity method investments |
|||||||||||
Income (loss) before income taxes |
|||||||||||
Income tax (expense) benefit |
( |
) |
( |
) |
( |
) |
|||||
Net income (loss) |
|||||||||||
Net income (loss) attributable to non-controlling interest holders |
|||||||||||
Net income (loss) attributable to controlling stockholders |
$ |
$ |
$ |
||||||||
Basic earnings (loss) per common share |
$ |
$ |
$ |
||||||||
Diluted earnings (loss) per common share |
$ |
$ |
$ |
||||||||
Weighted average common shares outstanding—basic |
|||||||||||
Weighted average common shares outstanding—diluted |
|||||||||||
See accompanying notes.
- 79 -
HANNON ARMSTRONG SUSTAINABLE INFRASTRUCTURE CAPITAL, INC.
CONSOLIDATED STATEMENTS OF COMPREHENSIVE INCOME
(DOLLARS IN THOUSANDS)
Years Ended December 31, |
|||||||||||
2019 |
2018 |
2017 |
|||||||||
Net income (loss) |
$ |
$ |
$ |
||||||||
Unrealized gain (loss) on available-for-sale securities, net of tax (provision) benefit of $(0.6) million, $0.1 million and $0.1 million in 2019, 2018, and 2017 respectively |
( |
) |
|||||||||
Unrealized gain (loss) on interest rate swaps, net of tax (provision) benefit of $1.8 million in 2019 and $0.0 million in 2018 and 2017 |
( |
) |
( |
) |
|||||||
Comprehensive income (loss) |
|||||||||||
Less: Comprehensive income (loss) attributable to non-controlling interest holders |
|||||||||||
Comprehensive income (loss) attributable to controlling stockholders |
$ |
$ |
$ |
||||||||
See accompanying notes.
- 80 -
HANNON ARMSTRONG SUSTAINABLE INFRASTRUCTURE CAPITAL, INC.
CONSOLIDATED STATEMENTS OF STOCKHOLDERS’ EQUITY
(AMOUNTS IN THOUSANDS)
Common Stock |
Additional
Paid-in
Capital
|
Accumulated
Deficit
|
Accumulated
Other
Comprehensive
Income (Loss)
|
Non-controlling
Interest
|
Total |
|||||||||||||||||||||
Shares |
Amount |
|||||||||||||||||||||||||
Balance at December 31, 2016 |
$ |
$ |
$ |
( |
) |
$ |
( |
) |
$ |
$ |
||||||||||||||||
Net income |
||||||||||||||||||||||||||
Unrealized gain (loss) on available-for-sale securities |
||||||||||||||||||||||||||
Unrealized gain (loss) on interest rate swaps |
( |
) |
( |
) |
( |
) |
||||||||||||||||||||
Impact of adoption of ASU 2017-12 |
( |
) |
||||||||||||||||||||||||
Issued shares of common stock |
||||||||||||||||||||||||||
Equity-based compensation |
||||||||||||||||||||||||||
Issuance (repurchase) of vested equity-based compensation shares |
( |
) |
( |
) |
||||||||||||||||||||||
Dividends and distributions |
( |
) |
( |
) |
( |
) |
||||||||||||||||||||
Balance at December 31, 2017 |
$ |
$ |
$ |
( |
) |
$ |
( |
) |
$ |
$ |
||||||||||||||||
Net income |
||||||||||||||||||||||||||
Unrealized gain (loss) on available-for-sale securities |
( |
) |
( |
) |
( |
) |
||||||||||||||||||||
Unrealized gain (loss) on interest rate swaps |
||||||||||||||||||||||||||
Issued shares of common stock |
||||||||||||||||||||||||||
Equity-based compensation |
||||||||||||||||||||||||||
Issuance (repurchase) of vested equity-based compensation shares |
( |
) |
( |
) |
||||||||||||||||||||||
Redemption of OP units |
( |
) |
( |
) |
( |
) |
||||||||||||||||||||
Dividends and distributions |
( |
) |
( |
) |
( |
) |
||||||||||||||||||||
Balance at December 31, 2018 |
$ |
$ |
$ |
( |
) |
$ |
( |
) |
$ |
$ |
||||||||||||||||
Net income |
||||||||||||||||||||||||||
Unrealized gain (loss) on available-for-sale securities |
||||||||||||||||||||||||||
Unrealized gain (loss) on interest rate swaps |
( |
) |
( |
) |
( |
) |
||||||||||||||||||||
Issued shares of common stock |
||||||||||||||||||||||||||
Equity-based compensation |
||||||||||||||||||||||||||
Issuance (repurchase) of vested equity-based compensation shares |
( |
) |
( |
) |
||||||||||||||||||||||
Redemption of OP units |
( |
) |
( |
) |
( |
) |
||||||||||||||||||||
Tax basis difference on contributed asset |
( |
) |
( |
) |
||||||||||||||||||||||
Dividends and distributions |
( |
) |
( |
) |
( |
) |
||||||||||||||||||||
Balance at December 31, 2019 |
$ |
$ |
$ |
( |
) |
$ |
$ |
$ |
||||||||||||||||||
See accompanying notes.
- 81 -
HANNON ARMSTRONG SUSTAINABLE INFRASTRUCTURE CAPITAL, INC.
CONSOLIDATED STATEMENTS OF CASH FLOWS
(DOLLARS IN THOUSANDS)
Years Ended December 31, |
|||||||||||
2019 |
2018 |
2017 |
|||||||||
Cash flows from operating activities |
|||||||||||
Net income (loss) |
$ |
$ |
$ |
||||||||
Adjustments to reconcile net income to net cash provided by operating activities: |
|||||||||||
Provision for loss on receivables |
|||||||||||
Depreciation and amortization |
|||||||||||
Amortization of deferred financing costs |
|||||||||||
Equity-based compensation |
|||||||||||
Equity method investments |
( |
) |
( |
) |
|||||||
Non-cash gain on securitization |
( |
) |
( |
) |
( |
) |
|||||
Gain on sale of receivables and investments |
|||||||||||
Changes in receivables held-for-sale |
( |
) |
|||||||||
Loss on debt extinguishment |
|||||||||||
Changes in accounts payable and accrued expenses |
( |
) |
|||||||||
Other |
( |
) |
( |
) |
( |
) |
|||||
Net cash provided by operating activities |
|||||||||||
Cash flows from investing activities |
|||||||||||
Equity method investments |
( |
) |
( |
) |
( |
) |
|||||
Equity method investment distributions received |
|||||||||||
Proceeds from sales of equity method investments |
|||||||||||
Purchases of and investments in receivables |
( |
) |
( |
) |
( |
) |
|||||
Principal collections from receivables |
|||||||||||
Proceeds from sales of receivables |
|||||||||||
Purchases of real estate |
( |
) |
( |
) |
|||||||
Purchases of investments |
( |
) |
( |
) |
( |
) |
|||||
Principal collections from investments |
|||||||||||
Proceeds from sales of investments and securitization assets |
|||||||||||
Funding of escrow accounts |
( |
) |
( |
) |
( |
) |
|||||
Withdrawal from escrow accounts |
|||||||||||
Other |
( |
) |
( |
) |
|||||||
Net cash provided by (used in) investing activities |
( |
) |
( |
) |
|||||||
- 82 -
Years Ended December 31, |
|||||||||||
2019 |
2018 |
2017 |
|||||||||
Cash flows from financing activities |
|||||||||||
Proceeds from credit facilities |
|||||||||||
Principal payments on credit facilities |
( |
) |
( |
) |
( |
) |
|||||
Proceeds from issuance of non-recourse debt |
|||||||||||
Principal payments on non-recourse debt |
( |
) |
( |
) |
( |
) |
|||||
Proceeds from issuance of senior unsecured notes |
|||||||||||
Proceeds from issuance of convertible notes |
|||||||||||
Payments on deferred funding obligations |
( |
) |
( |
) |
( |
) |
|||||
Net proceeds of common stock issuances |
|||||||||||
Payments of dividends and distributions |
( |
) |
( |
) |
( |
) |
|||||
Other |
( |
) |
( |
) |
( |
) |
|||||
Net cash provided by (used in) financing activities |
( |
) |
|||||||||
Increase (decrease) in cash, cash equivalents, and restricted cash |
( |
) |
|||||||||
Cash, cash equivalents, and restricted cash at beginning of period |
|||||||||||
Cash, cash equivalents, and restricted cash at end of period |
$ |
$ |
$ |
||||||||
Interest paid |
$ |
$ |
$ |
||||||||
Non-cash changes in deferred funding obligations and non-recourse debt (financing activity) |
( |
) |
( |
) |
|||||||
Non-cash changes in receivables and investments (investing activity) |
( |
) |
( |
) |
|||||||
Non-cash changes in residual assets (investing activity) |
( |
) |
( |
) |
( |
) |
|||||
See accompanying notes.
- 83 -
HANNON ARMSTRONG SUSTAINABLE INFRASTRUCTURE CAPITAL, INC.
NOTES TO CONSOLIDATED FINANCIAL STATEMENTS
December 31, 2019
1. The Company
Hannon Armstrong Sustainable Infrastructure Capital, Inc. (the “Company”) focuses on making investments in climate change solutions by providing capital to the leading companies in the energy efficiency, renewable energy and other sustainable infrastructure markets. Our goal is to generate attractive returns from a diversified portfolio of projects with long-term and predictable cash flows from proven technologies that reduce carbon emissions or increase resilience to climate change.
The Company and its subsidiaries are hereafter referred to as “we,” “us,” or “our.” Our investments take various forms, including equity, joint ventures, lending or other financing transactions, as well as real estate ownership and typically benefit from contractually committed high credit quality obligors. We also generate on-going fees through gain-on-sale securitization transactions, advisory services and asset management. We refer to the income producing assets that we hold on our balance sheet as our “Portfolio.” Our Portfolio may include:
• |
Equity in either preferred or common structures in unconsolidated entities; |
• |
Government and commercial receivables, such as loans for renewable energy and energy efficiency projects; |
• |
Real estate, such as land or other assets leased for use by sustainable infrastructure projects typically under long-term leases; and |
• |
Investments in debt securities of renewable energy or energy efficiency projects. |
We finance our business through cash on hand, borrowings under credit facilities and debt transactions, asset-backed securitization transactions and equity issuances. We also generate fee income through securitizations and syndications, by providing broker/dealer services and by managing and servicing assets owned by third parties. Some of our subsidiaries are special purpose entities that are formed for specific operations associated with investing in sustainable infrastructure receivables for specific long-term contracts.
Our common stock is listed on the New York Stock Exchange (“NYSE”) under the symbol “HASI.” We have qualified as a real estate investment trust (“REIT”) and also intend to continue to operate our business in a manner that will maintain our exemption from registration as an investment company under the 1940 Act, as amended. We operate our business through, and serve as the sole general partner of, our operating partnership subsidiary, Hannon Armstrong Sustainable Infrastructure, L.P., (the “Operating Partnership”), which was formed to acquire and directly or indirectly own our assets.
2. Summary of Significant Accounting Policies
Basis of Presentation
The preparation of financial statements in accordance with U.S. generally accepted accounting principles (“GAAP”) requires management to make estimates and assumptions that affect the reported amounts of assets and liabilities and the reported amounts of revenues and expenses during the reporting period. Actual results could differ from these estimates and such differences could be material. Certain amounts in the prior years have been reclassified to conform to the current year presentation. The consolidated financial statements include our accounts and controlled subsidiaries, including the Operating Partnership. All material intercompany transactions and balances have been eliminated in consolidation.
Following the guidance for non-controlling interests in Financial Accounting Standards Board (“FASB”) Accounting Standards Codification (“ASC”) 810, Consolidation (“ASC 810”), references in this report to our earnings per share and our net income and stockholders’ equity attributable to common stockholders do not include amounts attributable to non-controlling interests.
Consolidation and Equity Method Investments
We account for our investments in entities that are considered voting interest entities or variable interest entities (“VIEs”) under ASC 810 and assess whether we should consolidate these entities on an ongoing basis. We have established various special purpose entities or securitization trusts for the purpose of securitizing certain receivables or other debt investments which are not consolidated in our financial statements as described below in Securitization of Receivables.
We have assessed that we have power over and receive the benefits from those special purpose entities that are formed for the purpose of holding our government and commercial receivables and investments on our balance sheet; hence, we are the primary beneficiary and should consolidate these entities under the provisions of ASC 810.
- 84 -
We have made equity investments in various renewable energy and energy efficiency projects. These investments are typically owned in holding companies (using limited liability companies (“LLCs”) taxed as partnerships) where we partner with either the operator of the project or other institutional investors. We share in the cash flows, income, and tax attributes according to a negotiated schedule (which typically does not correspond with our ownership percentages). Investors, if any, in a preferred return position typically receive a stated preferred return consisting of a priority distribution of all or a portion of the project’s cash flows, and in some cases, tax attributes. Once the stated return, if applicable, is achieved, the partnership “flips” and the operator of the project along with any other common equity investors receive a larger portion of the cash flows with the previously preferred investors retaining an on-going residual interest.
These equity investments in renewable energy or energy efficiency projects are accounted for under the equity method of accounting. Certain of our equity method investments were determined to be VIEs in which we are not the primary beneficiary, as we do not direct the significant activities of those entities in which we invest. Our maximum exposure to loss associated with the continued operation of the underlying projects in our equity method investments is limited to our recorded value of our investments. Under the equity method of accounting, the carrying value of these equity method investments is determined based on amounts we invested, adjusted for the equity in earnings or losses of the investee allocated based on the LLC agreement, less distributions received. For the LLC agreements which contain preferences with regard to cash flows from operations, capital events and liquidation, we reflect our share of profits and losses by determining the difference between our claim on the investee’s book value at the beginning and the end of the period, which is adjusted for distributions received and contributions made. This claim is calculated as the amount we would receive (or be obligated to pay) if the investee were to liquidate all of its assets at recorded amounts determined in accordance with GAAP and distribute the resulting cash to creditors and investors in accordance with their respective priorities. This method is commonly referred to as the hypothetical liquidation at book value method or (“HLBV”). Any difference between the amount of our investment and the amount of underlying equity in net assets is generally amortized over the life of the assets and liabilities to which the difference relates. Cash distributions received from these equity method investments are classified as operating activities to the extent of cumulative HLBV earnings in our consolidated statements of cash flows. Our initial investment and additional cash distributions beyond that which are classified as operating activities are classified as investing activities in our consolidated statements of cash flows. We have elected to recognize earnings from these investments one quarter in arrears to allow for the receipt of financial information.
We have also made an investment in a joint venture which holds land under solar projects that we have determined to be a voting interest entity. This investment entitles us to receive an equal percentage of both cash distributions and profit and loss under the terms of the LLC operating agreement. The investment is accounted for under the equity method of accounting with our portion of income being recognized in income (loss) from equity method investments in the period in which the income is earned. Cash distributions received from this equity method investment are classified as operating activities to the extent of cumulative earnings in our consolidated statements of cash flows. Our initial investment and additional cash distributions beyond those which are classified as operating activities are classified as investing activities in our consolidated statements of cash flows.
We evaluate on a quarterly basis whether our investments accounted for using the equity method have an other than temporary impairment (“OTTI”). An OTTI occurs when the estimated fair value of an investment is below the carrying value and the difference is determined to not be recoverable. This evaluation requires significant judgment regarding, but not limited to, the severity and duration of the impairment; the ability and intent to hold the securities until recovery; financial condition, liquidity, and near-term prospects of the issuer; specific events; and other factors.
- 85 -
Government and Commercial Receivables
Government and commercial receivables (“receivables”), include project loans and receivables. These receivables are separately presented in our balance sheet to illustrate the differing nature of the credit risk related to these assets. Unless otherwise noted, we generally have the ability and intent to hold our receivables for the foreseeable future and thus they are classified as held for investment. Our ability and intent to hold certain receivables may change from time to time depending on a number of factors, including economic, liquidity and capital market conditions. At inception of the arrangement, the carrying value of receivables held for investment represents the present value of the note, lease or other payments, net of any unearned fee income, which is recognized as income over the term of the note or lease using the effective interest method. Receivables that are held for investment are carried, unless deemed impaired, at amortized cost, net of any unamortized acquisition premiums or discounts and include origination and acquisition costs, as applicable. Our initial investment and principal repayments of these receivables are classified as investing activities and the interest collected is classified as operating activities in our consolidated statements of cash flows. Receivables that we intend to sell in the short-term are classified as held-for-sale and are carried at the lower of amortized cost or fair value on our balance sheet. The purchases and proceeds from receivables that we intend to sell at origination are classified as operating activities in our consolidated statements of cash flows. Interest collected is classified as an operating activity in our consolidated statements of cash flows. Certain of our receivables may include the ability to defer required interest payments in exchange for increasing the receivable balance at the borrower’s option. We generally accrue this paid-in-kind (“PIK”) interest when collection is expected, and cease accruing PIK interest if there is insufficient value to support the accrual or we expect that any portion of the principal or interest due is not collectible.
We evaluate our receivables for potential delinquency or impairment and for our internally issued credit ratings on at least a quarterly basis and more frequently when economic or other conditions warrant such an evaluation. When a receivable becomes 90 days or more past due, and if we otherwise do not expect the debtor to be able to service all of its debt or other obligations, we will generally consider the receivable delinquent or impaired and place the receivable on non-accrual status and cease recognizing income from that receivable until the borrower has demonstrated the ability and intent to pay contractual amounts due. If a receivable’s status significantly improves regarding the debtor’s ability to service the debt or other obligations, we will remove it from non-accrual status.
A receivable is also considered impaired as of the date when, based on current information and events, it is determined that it is probable that we will be unable to collect all amounts due in accordance with the original contracted terms. Many of our receivables are secured by energy efficiency and renewable energy infrastructure projects. Accordingly, we regularly evaluate the extent and impact of any credit deterioration associated with the performance and value of the underlying project, as well as the financial and operating capability of the borrower, its sponsors or the obligor as well as any guarantors. We consider a number of qualitative and quantitative factors in our assessment, including, as appropriate, a project’s operating results, loan-to-value ratio, any cash reserves, the ability of expected cash from operations to cover the cash flow requirements currently and into the future, key terms of the transaction, the ability of the borrower to refinance the transaction, other credit support from the sponsor or guarantor and the project’s collateral value. In addition, we consider the overall economic environment, the sustainable infrastructure sector, the effect of local, industry, and broader economic factors, the impact of any variation in weather and the historical and anticipated trends in interest rates, defaults and loss severities for similar transactions.
If a receivable is impaired, we will determine if an allowance should be recorded. We will record an allowance if the present value of expected future cash flows discounted at the receivable’s contractual effective rate is less than its carrying value. This estimate of cash flows may include the currently estimated fair market value of the collateral less estimated selling costs if repayment is expected from the collateral. We charge off receivables against the allowance, if any, when we determine the unpaid principal balance is uncollectible, net of recovered amounts.
Real Estate
Real estate consists of land or other real estate and its related lease intangibles, net of any amortization. Our real estate is generally leased to tenants on a triple net lease basis, whereby the tenant is responsible for all operating expenses relating to the property, generally including property taxes, insurance, maintenance, repairs and capital expenditures. Certain real estate transactions may be characterized as “failed sale-leaseback” transactions as defined under ASC Topic 842 (“Topic 842”), Leases, and thus are accounted for similar to our Commercial Receivables as described previously in Government and Commercial Receivables.
For our other real estate lease transactions that are classified as operating leases, the scheduled rental revenue typically varies during the lease term and thus rental income is recognized on a straight-line basis, unless there is considerable risk as to collectability, so as to produce a constant periodic rent over the term of the lease. Accrued rental income is the aggregate difference between the scheduled rents which vary during the lease term and the income recognized on a straight-line basis and is recorded in other assets. Expenses, if any, related to the ongoing operation of leases where we are the lessor are charged to
- 86 -
operations as incurred. Our initial investment is classified as investing activities and income collected for rental income is classified as operating activities in our consolidated statements of cash flows.
When our real estate transactions are treated as an asset acquisition with an operating lease, we typically record our real estate purchases at cost, including acquisition and closing costs, which is allocated to each tangible and intangible asset acquired on a relative fair value basis.
The fair value of the tangible assets of an acquired leased property is determined by valuing the property as if it were vacant, and the “as-if-vacant” value is then allocated to land, building and tenant improvements, if any, based on the determination of the fair values of these assets. The as-if-vacant fair value of a property is typically determined by management based on appraisals by a qualified appraiser. In determining the fair value of the identified intangibles of an acquired property, above-market and below-market in-place lease values are valued based on the present value (using an interest rate which reflects the risks associated with the leases acquired) of the difference between (i) the contractual amounts to be paid pursuant to the in-place leases, and (ii) management’s estimate of fair market lease rates for the corresponding in-place leases, measured over a period equal to the remaining term of the lease, including renewal periods reasonably certain of being exercised by the lessee.
The capitalized above-market lease values are amortized as a reduction of rental income and the capitalized below-market lease values are amortized as an increase to rental income, both of which are amortized over the term used to value the intangible. We also record, as appropriate, an intangible asset for in-place leases. The value of the leases in place at the time of the transaction is equal to the potential income lost if the leases were not in place. The amortization of this intangible occurs over the initial term unless management believes that it is reasonably certain that the tenant would exercise the renewal option, in which case the amortization would extend through the renewal period. If a lease were to be terminated, all unamortized amounts relating to that lease would be written off.
Investments
Investments are debt securities that meet the criteria of ASC 320, Investments—Debt and Equity Securities. We have designated our debt securities as available-for-sale and carry these securities at fair value on our balance sheet. Unrealized gains and losses, to the extent not considered to have an OTTI, on available-for-sale debt securities are recorded as a component of accumulated other comprehensive income (“AOCI”) in equity on our balance sheet. When a security is sold, we reclassify the AOCI to earnings based on specific identification. Our initial investment and principal repayments of these investments are classified as investing activities and the interest collected is classified as operating activities in our consolidated statements of cash flows.
We evaluate our investments for OTTI on at least a quarterly basis, and more frequently when economic or market conditions warrant such an evaluation. Our OTTI assessment is a subjective process requiring the use of judgments and assumptions. Accordingly, we regularly evaluate the extent and impact of any credit deterioration associated with the financial and operating performance and value of the underlying project. We consider several qualitative and quantitative factors in our assessment. We first consider the current fair value of the security and the duration of any unrealized loss. Other factors considered include changes in the credit rating, performance of the underlying project, key terms of the transaction, the value of any collateral and any support provided by the sponsor or guarantor.
To the extent that we have identified an OTTI for a security and intend to hold the investment to maturity and we do not expect that we will be required to sell the security prior to recovery of the amortized cost basis, we recognize only the credit component of the OTTI in earnings. We determine the credit component using the difference between the security’s amortized cost basis and the present value of its expected future cash flows, discounted using the effective interest method or its estimated collateral value. Any remaining unrealized loss due to factors other than credit is recorded in AOCI.
To the extent we hold investments with an OTTI and if we have made the decision to sell the security or it is more likely than not that we will be required to sell the security prior to recovery of its amortized cost basis, we recognize the entire portion of the impairment in earnings.
Premiums or discounts on investment securities are amortized or accreted into interest income using the effective interest method.
Securitization of Financial Assets
We have established various special purpose entities or securitization trusts for the purpose of securitizing certain financial assets. We determined that the trusts used in securitizations are VIEs, as defined in ASC 810. When we conclude that we are not the primary beneficiary of certain trusts because we do not have power over those trusts’ significant activities, we do not consolidate the trust. We typically serve as primary or master servicer of these trusts; however, as the servicer, we do not have the power to make significant decisions impacting the performance of the trusts.
- 87 -
We account for transfers of financial assets to these securitization trusts as sales pursuant to ASC 860, Transfers and Servicing (“ASC 860”), when we have concluded the transferred assets have been isolated from the transferor (i.e., put presumptively beyond the reach of the transferor and its creditors, even in bankruptcy or other receivership) and we have surrendered control over the transferred assets. We treat those trusts where we are unable to conclude that we have been isolated from the securitized financial assets as secured borrowings, retaining the assets on our balance sheet and recording the amounts due to the trust investor as non-recourse debt.
For transfers treated as sales under ASC 860, we have received true-sale-at-law opinions for all of our securitization trust structures and non-consolidation legal opinions for all but one legacy securitization trust structure that support our conclusion regarding the transferred financial assets. When we sell financial assets in securitizations, we generally retain interests in the form of servicing rights and residual assets, which we refer to as securitization assets.
Gain or loss on the sale of financial assets is calculated based on the excess of the proceeds received from the securitization (less any transaction costs) plus any retained interests obtained over the cost basis of the assets sold. For retained interests, we generally estimate fair value based on the present value of future expected cash flows using our best estimates of the key assumptions of anticipated losses, prepayment rates, and current market discount rates commensurate with the risks involved. Cash flows related to our securitizations at origination are classified as operating activities in our consolidated statements of cash flows.
We initially account for all separately recognized servicing assets and servicing liabilities at fair value and subsequently measure such servicing assets and liabilities using the amortization method. Servicing assets and liabilities are amortized in proportion to, and over the period of, estimated net servicing income with servicing income recognized as earned. We assess servicing assets for impairment at each reporting date. If the amortized cost of servicing assets is greater than the estimated fair value, we will recognize an impairment in net income.
Our other retained interest in securitized assets, the residual assets, are accounted for as available-for-sale securities and carried at fair value on the consolidated balance sheets in other assets. Our residual assets are evaluated for impairment on a quarterly basis. Interest income related to the residual assets is recognized using the effective interest rate method. If there is a change in the expected cash flows related to the residual assets, we will assess whether the asset is impaired and will calculate a new yield based on the current amortized cost of the residual assets and the revised expected cash flows. This yield is used prospectively to recognize interest income.
Cash and Cash Equivalents
Cash and cash equivalents include short-term government securities, certificates of deposit and money market funds, all of which had an original maturity of three months or less at the date of purchase. These securities are carried at their purchase price, which approximates fair value.
Restricted Cash
Restricted cash includes cash and cash equivalents set aside with certain lenders primarily to support deferred funding and other obligations outstanding as of the balance sheet dates. Restricted cash is reported as part of other assets in the consolidated balance sheets. Refer to Note 3 for disclosure of the balances of restricted cash included in other assets.
Convertible Notes
We have issued convertible senior notes that are accounted for in accordance with ASC 470-20, Debt with Conversion and Other Options, and ASC 815, Derivatives and Hedging (“ASC 815”). Under ASC 815, issuers of certain convertible debt instruments are generally required to separately account for the conversion option of the convertible debt instrument as either a derivative or equity, unless it meets the scope exemption for contracts indexed to, and settled in, an issuer’s own equity. Since this conversion option is both indexed to our equity and can only be settled in our common stock, we have met the scope exemption, and therefore, we are not separately accounting for the embedded conversion option. The initial issuance and any principal repayments are classified as financing activities and interest payments are classified as operating activities in our consolidated statements of cash flows.
Income Taxes
We elected and qualified to be taxed as a REIT for U.S. federal income tax purposes, commencing with our taxable year ended December 31, 2013. We also have taxable REIT subsidiaries (“TRSs”) which are taxed separately, and which will generally be subject to U.S. federal, state, and local income taxes as well as taxes of foreign jurisdictions, if any. To qualify as a REIT, we must meet on an ongoing basis several organizational and operational requirements, including a requirement that we currently distribute at least 90% of our REIT’s net taxable income before dividends paid, excluding capital gains, to our stockholders. As a REIT, we are not subject to U.S. federal corporate income tax on that portion of net income that is currently distributed to our owners.
- 88 -
We account for income taxes under ASC 740, Income Taxes (“ASC 740”) for our TRSs using the asset and liability method. Deferred tax assets and liabilities are recognized for the estimated future tax consequences attributable to the differences between the consolidated financial statement carrying amounts of existing assets and liabilities and their respective tax bases. Deferred tax assets and liabilities are measured using enacted tax rates in effect for the year in which those temporary differences are expected to be recovered or settled. The effect on deferred tax assets and liabilities from a change in tax rates is recognized in earnings in the period when the new rate is enacted. We evaluate any deferred tax assets for valuation allowances based on an assessment of available evidence including sources of taxable income, prior years taxable income, any existing taxable temporary differences and our future investment and business plans that may give rise to taxable income. We treat any tax credits we receive from our equity investments in renewable energy projects as reductions of federal income taxes of the year in which the credit arises. Any deferred tax impacts resulting from transfers of assets to or from our TRSs are recorded as an adjustment to additional paid-in capital, as it is a transfer amongst entities under common control.
We apply ASC 740 with respect to how uncertain tax positions should be recognized, measured, presented, and disclosed in the financial statements. This guidance requires the accounting and disclosure of tax positions taken or expected to be taken in the course of preparing our tax returns to determine whether the tax positions are “more likely than not” to be sustained by the applicable tax authority. We are required to analyze all open tax years, as defined by the statute of limitations, for all major jurisdictions, which includes U.S. federal and certain states.
Equity-Based Compensation
In 2013, we adopted the 2013 Hannon Armstrong Sustainable Infrastructure Capital, Inc. Equity Incentive Plan (as amended, the “2013 Plan”), which provides for grants of stock options, stock appreciation rights, restricted stock units, shares of restricted common stock, phantom shares, dividend equivalent rights, long-term incentive-plan units (“LTIP units”) and other restricted limited partnership units issued by our Operating Partnership and other equity-based awards. From time to time, we may grant equity or equity based awards as compensation to members of our senior management team, our independent directors, employees, advisors, consultants and other personnel under our 2013 Plan. Certain awards earned under the plan are based on achieving various performance targets, which are generally earned between 0 % and 200 % of the initial target, depending on the extent to which the performance target is met. In addition to performance targets, certain LTIP units issued by our Operating Partnership also require a certain level of appreciation of partnership interests to occur before parity is reached and LTIP units can be converted to limited partnership units.
We record compensation expense for grants made under the 2013 Plan in accordance with ASC 718, Compensation—Stock Compensation. We record compensation expense for unvested grants that vest solely based on service conditions on a straight-line basis over the vesting period of the entire award based upon the fair market value of the grant on the date of grant. Fair market value for restricted common stock is based on our share price on the date of grant. For awards where the vesting is contingent upon achievement of certain performance targets, compensation expense is measured based on the fair market value on the grant date and is recorded over the requisite service period (which includes the performance period). Actual performance results at the end of the performance period determines the number of shares that will ultimately be awarded. We have also issued awards where the vesting is contingent upon service being provided for a defined period and certain market conditions being met. The fair value of these awards, as measured at the grant date, is recognized over the requisite service period, even if the market conditions are not met. The grant date fair value of these awards was developed by an independent appraiser using a Monte Carlo simulation.
Earnings Per Share
We compute earnings per share of common stock in accordance with ASC 260, Earnings Per Share. Basic earnings per share is calculated by dividing net income attributable to controlling stockholders (after consideration of the earnings allocated to unvested grants under the 2013 Plan, if applicable) by the weighted-average number of shares of common stock outstanding during the period excluding the weighted average number of unvested grants under the 2013 Plan, if applicable (“participating securities” as defined in Note 12). Diluted earnings per share is calculated by dividing net income attributable to controlling stockholders (after consideration of the earnings allocated to unvested grants under the 2013 Plan, if applicable) by the weighted-average number of shares of common stock outstanding during the period plus other potential common stock instruments if they are dilutive. Other potentially dilutive common stock instruments include our unvested restricted stock, other equity-based awards, and convertible notes. The restricted stock and other equity-based awards are included if they are dilutive using the treasury stock method. The treasury stock method assumes that theoretical proceeds received for future service provided is used to purchase shares of treasury stock at the average market price per share of common stock, which is deducted from the total shares of potential common stock included in the calculation. When unvested grants are dilutive, the earnings allocated to these dilutive unvested grants are not deducted from the net income attributable to controlling stockholders when calculating diluted earnings per share. The convertible notes are included if they are dilutive using the if-converted method. The if-converted method removes interest expense related to the convertible notes from the net income attributable to controlling stockholders and includes the weighted average shares of potential common stock over the period
- 89 -
issuable upon conversion of the note. No adjustment is made for shares of potential common stock that are anti-dilutive during a period.
Segment Reporting
We make equity and debt investments in the energy efficiency, renewable energy, and other sustainable infrastructure markets. We manage our business as a single portfolio and report all of our activities as one business segment.
Recently Issued Accounting Pronouncements
Leases
In February 2016, the FASB issued guidance codified in Topic 842, which amends the guidance in former ASC Topic 840, Leases. The main principle of Topic 842 requires lessees to recognize the assets and liabilities that arise from nearly all leases on the balance sheet. Lessor accounting remains relatively consistent with some changes to align Topic 842 with ASC Topic 606, Revenue from Contracts with Customers, including changes to the guidance on classification of real estate lease transactions. The standard became effective for interim and annual reporting periods beginning after December 15, 2018, with early adoption permitted. Topic 842 provides companies with a choice of transitioning to the new standard using one of two modified retrospective transition approaches; one that requires companies to adjust comparative periods upon adoption and another where the impact of adoption is reflected in retained earnings and comparative periods are not adjusted.
We adopted Topic 842 effective January 1, 2019 and elected to apply the new leases standard at the adoption date and recognize a cumulative-effect adjustment to the opening balance of retained earnings in the period of adoption. We also elected the package of practical expedients which allowed us to not reassess (1) whether existing contracts contain leases, (2) the lease classification for existing leases, and (3) whether existing initial direct costs meet the new definition. The adoption of Topic 842 did not have a material impact on our financial statements. Subsequent to adoption of Topic 842, due to the changes in the lessor rules for classification of real estate leasing transactions, certain of our real estate leasing transactions may be accounted for as commercial receivables rather than being treated as real estate asset acquisitions with operating leases.
Credit Losses
In June 2016, the FASB issued ASU No. 2016-13, Financial Instruments-Credit Losses-Measurement of Credit Losses on Financial Instruments (“Topic 326”). Topic 326 significantly changes how entities will recognize and measure credit losses for most financial assets and certain other instruments that are not measured at fair value through net income. Topic 326 replaces the “incurred loss” approach under existing guidance with an “expected loss” model for instruments measured at amortized cost and require entities to record allowances for expected losses from available-for-sale debt securities rather than reduce the amortized cost, as currently required. It also simplifies the accounting model for purchased credit-impaired debt securities and loans. Topic 326 is effective for fiscal years beginning after December 15, 2019 and is to be adopted through a cumulative-effect adjustment to retained earnings as of the beginning of the first reporting period in which the guidance is effective. The standard is effective for us on January 1, 2020. While we are continuing to assess the impact Topic 326 will have on the consolidated financial statements, the measurement of expected credit losses under the current expected credit loss model will be based on relevant information including historical experience, current conditions, and reasonable and supportable forecasts that affect the collectability of the reported amounts of the financial assets in scope of the model. We have pooled our assets by risk characteristics and determined a methodology for each pool. We are still evaluating the appropriate internal controls and financial statement disclosures with regards to receivables and related lending commitments.
Other accounting standards updates issued before February 24, 2020 and effective after December 31, 2019, are not expected to have a material effect on our consolidated financial statements and related disclosures.
3. Fair Value Measurements
Fair value is defined as the price that would be received for an asset or paid to transfer a liability in an orderly transaction between market participants on the measurement date. The fair value accounting guidance provides a three-level hierarchy for classifying financial instruments. The levels of inputs used to determine the fair value of our financial assets and liabilities carried on the balance sheet at fair value and for those which only disclosure of fair value is required are characterized in accordance with the fair value hierarchy established by ASC 820, Fair Value Measurements. Where inputs for a financial asset or liability fall in more than one level in the fair value hierarchy, the financial asset or liability is classified in its entirety based on the lowest level input that is significant to the fair value measurement of that financial asset or liability. We use our judgment and consider factors specific to the financial assets and liabilities in determining the significance of an input to the fair value measurements. As of December 31, 2019 and December 31, 2018, only our residual assets related to our securitization trusts, interest rate swaps and investments, if any, were carried at fair value on the consolidated balance sheets on a recurring basis. The three levels of the fair value hierarchy are described below:
- 90 -
• |
Level 1—Quoted prices (unadjusted) in active markets that are accessible at the measurement date. |
• |
Level 2—Observable prices that are based on inputs not quoted on active markets, but corroborated by market data. |
• |
Level 3—Unobservable inputs are used when little or no market data is available. |
The tables below illustrate the estimated fair value of our financial instruments on our balance sheet. Unless otherwise discussed below, fair value for our Level 2 and Level 3 measurements is measured using a discounted cash flow model, contractual terms and inputs which consist of base interest rates and spreads over base rates which are based upon market observation and recent comparable transactions. An increase in these inputs would result in a lower fair value and a decline would result in a higher fair value. Our senior unsecured notes and convertible notes are valued using a market based approach and observable prices. The receivables held-for-sale, if any, are carried at the lower of cost or fair value.
As of December 31, 2019 |
|||||||||
|
Fair
Value
|
Carrying
Value
|
Level |
|||||||
(in millions) |
|||||||||
Assets |
|||||||||
Government receivables |
$ |
$ |
Level 3 |
||||||
Commercial receivables |
Level 3 |
||||||||
Investments (1)
|
Level 3 |
||||||||
Securitization residual assets (2)
|
Level 3 |
||||||||
Liabilities |
|||||||||
Credit facilities (3)
|
$ |
$ |
Level 3 |
||||||
Non-recourse debt (3)
|
Level 3 |
||||||||
Senior unsecured notes (3)
|
Level 2 |
||||||||
Convertible notes (3)
|
Level 2 |
||||||||
(1) |
The amortized cost of our investments as of December 31, 2019, was $ |
(2) |
Included in the securitization assets line of our consolidated balance sheets. This amount excludes securitization servicing assets, which are carried at amortized cost. |
(3) |
Fair value and carrying value exclude unamortized debt issuance costs. |
As of December 31, 2018 |
|||||||||
|
Fair
Value
|
Carrying
Value
|
Level |
|||||||
(in millions) |
|||||||||
Assets |
|||||||||
Government receivables |
$ |
$ |
Level 3 |
||||||
Commercial receivables |
Level 3 |
||||||||
Investments (1)
|
Level 3 |
||||||||
Securitization residual assets (2)
|
Level 3 |
||||||||
Liabilities |
|||||||||
Credit facilities (3)
|
$ |
$ |
Level 3 |
||||||
Non-recourse debt (3)
|
Level 3 |
||||||||
Convertible notes (3)
|
Level 2 |
||||||||
(1) |
The amortized cost of our investments as of December 31, 2018, was $ |
(2) |
Included in the securitization assets line of our consolidated balance sheets. This amount excludes securitization servicing assets which are carried at amortized cost. |
(3) |
Fair value and carrying value exclude unamortized debt issuance costs. |
- 91 -
Investments
The following table reconciles the beginning and ending balances for our Level 3 investments that are carried at fair value on a recurring basis:
|
For the year ended
December 31,
|
|||||||
2019 |
2018 |
||||||
(in millions) |
|||||||
Balance, beginning of period |
$ |
$ |
|||||
Purchases of investments |
|||||||
Payments on investments |
( |
) |
( |
) |
|||
Sale of investments |
( |
) |
|||||
Realized gains on investments recorded in gain on sale of receivables and investments |
|||||||
Unrealized gains (losses) on investments recorded in OCI |
( |
) |
|||||
Balance, end of period |
$ |
$ |
|||||
The following table illustrates our investments in an unrealized loss position:
Estimated Fair Value |
Unrealized Losses (1)
|
||||||||||||||
Securities with a loss shorter than 12 months |
Securities with a loss longer than 12 months |
Securities with a loss shorter than 12 months |
Securities with a loss longer than 12 months |
||||||||||||
(in millions) |
|||||||||||||||
December 31, 2019 |
$ |
$ |
$ |
$ |
|||||||||||
December 31, 2018 |
|||||||||||||||
(1) Loss position is due to interest rates movements. We have the intent and ability to hold these investments until a recovery of fair value.
In determining the fair value of our investments, we used a market-based risk-free rate and a range of interest rate spreads of approximately 1 % to 4 % based upon transactions involving similar assets as of December 31, 2019 and 2018. The weighted average discount rate used to determine the fair value of our investments as of December 31, 2019 was 4.4 %.
Securitization residual assets
The following table reconciles the beginning and ending balances for our Level 3 securitization residual assets that are carried at fair value on a recurring basis:
|
For the year ended
December 31,
|
|||||||
2019 |
2018 |
||||||
(in millions) |
|||||||
Balance, beginning of period |
$ |
$ |
|||||
Accretion of securitization residual assets |
|||||||
Additions to securitization residual assets |
|||||||
Collections of securitization residual assets |
( |
) |
( |
) |
|||
Sales of securitization residual assets |
( |
) |
|||||
Unrealized gains (losses) on securitization residual assets recorded in OCI |
|||||||
Balance, end of period |
$ |
$ |
|||||
In determining the fair value of our securitization residual assets, we used a market-based risk-free rate and a range of interest rate spreads of approximately 1 % to 4 % based upon transactions involving similar assets as of December 31, 2019 and 2018. The weighted average discount rate used to determine the fair value of our securitization residual assets as of December 31, 2019 was 4.4 %.
Non-recurring Fair Value Measurements
Our financial statements may include non-recurring fair value measurements related to acquisitions and non-monetary transactions, if any. Assets acquired in a business combination are recorded at their fair value. We may use third party valuation firms to assist us with developing our estimates of fair value.
- 92 -
Concentration of Credit Risk
Government and commercial receivables, real estate leases, and debt investments consist primarily of U.S. federal government-backed receivables, investment grade state and local government receivables and receivables from various sustainable infrastructure projects and do not, in our view, represent a significant concentration of credit risk. See Note 6 for an analysis by type of obligor and the method of rating. Additionally, our investments are collateralized by projects concentrated in certain geographic regions throughout the United States. We have structural credit protections to mitigate our risk exposure and, in most cases, the projects are insured for estimated physical loss which helps to mitigate the possible risk from these concentrations.
We had cash deposits that are subject to credit risk as shown below:
December 31, |
|||||||
2019 |
2018 |
||||||
(in millions) |
|||||||
Cash deposits |
$ |
$ |
|||||
Restricted cash deposits (included in other assets) |
|||||||
Total cash deposits |
$ |
$ |
|||||
Amount of cash deposits in excess of amounts federally insured |
$ |
$ |
|||||
4. Non-Controlling Interest
Units of limited partnership interests in the Operating Partnership (“OP units”) that are owned by limited partners other than us are included in non-controlling interest on our consolidated balance sheets. The non-controlling interest holders are generally allocated their pro rata share of income, other comprehensive income and equity transactions.
The outstanding OP units held by outside limited partners represent less than 1 % of our outstanding OP units and are redeemable by the limited partners for cash, or at our option, for a like number of shares of our common stock. Non-controlling interest holders exchanged 3,703 OP units for the same number of shares of common stock during the year ended December 31, 2019. OP units of 7,406 were exchanged for the same number of shares of our common stock during the year ended December 31, 2018.
We have also granted to officers and directors LTIP Units pursuant to the 2013 plan. These LTIP Units are held by HASI Management HoldCo LLC. The LTIP Units are designed to qualify as profits interests in the Operating Partnership and initially will have a capital account balance of zero and, therefore, will not have full parity with OP units with respect to liquidating distributions or other rights. However, the amended and restated agreement of limited partnership of the Operating Partnership (the “OP Agreement”) provides that “book gains,” or economic appreciation, in the Operating Partnership will be allocated first to the LTIP Units until the capital account per LTIP Units is equal to the capital account per-unit of the OP units. Under the terms of the OP Agreement, the Operating Partnership will revalue its assets upon the occurrence of certain specified events, and any increase in valuation from the time of grant until such event will be allocated first to the holders of LTIP Units to equalize the capital accounts of such holders with the capital accounts of OP unit holders. Once this has occurred, the LTIP Units will achieve full parity with the OP units for all purposes, including with respect to liquidating distributions and redemption rights. In addition to these attributes, there are vesting and settlement conditions similar to our other equity-based awards as discussed in Notes 2 and 11.
5. Securitization of Financial Assets
The following summarizes certain transactions with our securitization trusts:
As of and for the year ended December 31, |
|||||||||||
2019 |
2018 |
2017 |
|||||||||
(in millions) |
|||||||||||
Gains on securitizations |
$ |
$ |
$ |
||||||||
Cost of financial assets securitized |
|||||||||||
Proceeds from securitizations |
|||||||||||
Residual and servicing assets |
|||||||||||
Cash received from residual and servicing assets |
|||||||||||
- 93 -
In connection with securitization transactions, we typically retain servicing responsibilities and residual assets. We generally receive annual servicing fees of up to typically 0.20 % of the outstanding balance. We may periodically make servicer advances, which are subject to credit risk. Included in securitization assets in our consolidated balance sheets are our servicing assets at amortized cost, our residual assets at fair value, and our servicing advances at cost, if any. Our residual assets are subordinate to investors’ interests, and their values are subject to credit, prepayment and interest rate risks on the transferred financial assets. The investors and the securitization trusts have no recourse to our other assets for failure of debtors to pay when due. In computing gains and losses on securitizations, we use the same discount rates we use for the fair value calculation of residual assets, which are determined based on a review of comparable market transactions including Level 3 unobservable inputs which consist of base interest rates and spreads over base rates. Depending on the nature of the transaction risks, the discount rate ranged from 3 % to 7 % and contemplates our estimate of prepayments.
As of December 31, 2019 and December 31, 2018, our Managed Assets totaled $6.2 billion and $5.3 billion, respectively, of which $4.1 billion and $3.3 billion, respectively, were securitized assets held in unconsolidated securitization trusts. There were no securitization credit losses in the years ended December 31, 2019, 2018, or 2017. As of December 31, 2019, there were no material payments from debtors to the securitization trusts that was greater than 90 days past due. The securitized assets generally consist of receivables from contracts for the installation of energy efficiency and other technologies in facilities owned by, or operated for or by, federal, state or local government entities where the ultimate obligor is the government. The contracts may have guarantees of energy savings from third party service providers, which typically are entities rated investment grade by an independent rating agency. Based on the nature of the assets and experience-to-date, we do not currently expect to incur any credit losses of our residual interests related to the assets sold.
6. Our Portfolio
As of December 31, 2019, our Portfolio included approximately $2.1 billion of equity method investments, receivables, real estate and investments on our balance sheet. The equity method investments represent our non-controlling equity investments in renewable energy and energy efficiency projects and land. The receivables and investments are typically collateralized by contractually committed debt obligations of government entities or private high credit quality obligors and are often supported by additional forms of credit enhancement, including security interests and supplier guaranties. The real estate is typically land and related lease intangibles for long-term leases to wind and solar projects.
The following is an analysis of our Portfolio as of December 31, 2019:
Investment Grade |
Commercial
Non-Investment
Grade (3)
|
Subtotal,
Debt
and Real
Estate
|
Equity
Method
Investments
|
Total |
|||||||||||||||||||
Government (1)
|
Commercial (2)
|
||||||||||||||||||||||
(dollars in millions) |
|||||||||||||||||||||||
Equity investments in renewable energy and energy efficiency projects |
$ |
$ |
$ |
$ |
$ |
$ |
|||||||||||||||||
Receivables (4)
|
|||||||||||||||||||||||
Real estate (5)
|
|||||||||||||||||||||||
Investments |
|||||||||||||||||||||||
Total |
$ |
$ |
$ |
$ |
$ |
$ |
|||||||||||||||||
% of Debt and real estate portfolio |
% |
% |
% |
% |
N/A |
N/A |
|||||||||||||||||
Average remaining balance (6)
|
$ |
$ |
$ |
$ |
$ |
$ |
|||||||||||||||||
(1) |
Transactions where the ultimate obligor is the U.S. federal government or state or local governments where the obligors are rated investment grade (either by an independent rating agency or based upon our internal credit analysis). This amount includes $ |
(2) |
Transactions where the projects or the ultimate obligors are commercial entities that have been rated investment grade (either by an independent rating agency or based on our internal credit analysis). Of this total, $ |
(3) |
Transactions where the projects or the ultimate obligors are commercial entities that either have ratings below investment grade (either by an independent rating agency or using our internal credit analysis) or where the nature of the subordination in the asset causes it to be considered non-investment grade. This category of assets includes $ |
- 94 -
special purpose subsidiaries of residential solar companies where the nature of the subordination causes it to be considered non-investment grade. These loans are secured by residential solar assets and we rely on certain limited indemnities, warranties, and other obligations of the residential solar companies or their other subsidiaries. The remaining $236 million of transactions are projects where the ultimate obligors are commercial entities that have ratings below investment grade using our internal credit analysis. Approximately $357 million of our commercial non-investment grade loans were made to entities in which we also have non-controlling equity investments of approximately $40 million.We have fully reserved $8 million of loans that are on non-accrual status. See Receivables and Investments below for further information.
(4) |
Total reconciles to the total of the government receivables and commercial receivables lines of the consolidated balance sheets. |
(5) |
Includes the real estate and the lease intangible assets (including those held through equity method investments) from which we receive scheduled lease payments, typically under long-term triple net lease agreements. |
(6) |
Excludes approximately |
Equity Method Investments
We have made non-controlling equity investments in a number of renewable energy and energy efficiency projects as well as in a joint venture that owns land with a long-term triple net lease agreement to several solar projects that we account for as equity method investments. As of December 31, 2019, we held the following equity method investments:
Investment Date |
Investee |
Carrying Value |
||||
(in millions) |
||||||
Various |
2007 Vento I, LLC |
$ |
||||
December 2015 |
Buckeye Wind Energy Class B Holdings, LLC |
|||||
Various |
Vivint Solar Asset 1 Class B, LLC |
|||||
December 2019 |
2019 K102 Investor LLC |
|||||
October 2016 |
Invenergy Gunsight Mountain Holdings, LLC |
|||||
December 2018 |
3D Energie, LLC |
|||||
Various |
Vivint Solar Asset 2 Class B, LLC |
|||||
Various |
Helix Fund I, LLC |
|||||
Various |
Other transactions |
|||||
Total equity method investments |
$ |
|||||
In December 2019, we sold our interest in Northern Frontier Wind, LLC for $58 million, resulting in a gain of $28 million recorded in income from equity method investments on our consolidated statement of operations. The gain is primarily the result of cash we received from our investment in excess of our carrying value which includes the income allocated using the HLBV method of accounting. In January 2020, the majority of the proceeds from this sale along with additional cash from the project’s operating distributions received in the fourth quarter were used to pay the remaining balance of the 2017 Credit Agreement in as described below in Note 8.
An underlying solar project associated with one of our equity method investments located in the U.S. Virgin Islands was materially damaged in the 2017 hurricanes. In the first quarter of 2019, we collected insurance proceeds of approximately $8 million. While there can be no assurance in this regard, we continue to believe that the project’s other existing assets will be sufficient to recover our remaining carrying value of approximately $2 million.
As of December 31, 2018, we held a $14 million investment in a wind project that was purchased as part of a portfolio at a significant discount to the project’s book value, in part, due to the lack of a power purchase agreement and some operational issues. In January 2019, the sponsor indicated it was evaluating this project for impairment due to these issues and recorded an impairment of approximately $12 million in their financial statements as of and for the year ended December 31, 2018, which were issued to us in March 2019. Due to the fact that we account for this investment one quarter in arrears to allow for the receipt of financial information, we recognized our share of the operating results of the project, a loss of approximately $8 million, in the quarter ended March 31, 2019.
Based on an evaluation of our equity method investments, inclusive of these projects, we determined that no OTTI had occurred as of December 31, 2019, 2018, or 2017.
Receivables and Investments
The following table provides a summary of our anticipated maturity dates of our receivables and investments and the weighted average yield for each range of maturities as of December 31, 2019:
- 95 -
Total |
Less than 1 year |
1-5 years |
5-10 years |
More than 10
years
|
|||||||||||||||
(dollars in millions) |
|||||||||||||||||||
Receivables |
|||||||||||||||||||
Maturities by period |
$ |
$ |
$ |
$ |
$ |
||||||||||||||
Weighted average yield by period |
% |
% |
% |
% |
% |
||||||||||||||
Investments |
|||||||||||||||||||
Maturities by period |
$ |
$ |
$ |
$ |
$ |
||||||||||||||
Weighted average yield by period |
% |
% |
% |
% |
% |
||||||||||||||
Included in our non-investment grade assets are two commercial receivables with a combined carrying value of approximately $8 million which we consider impaired and have held on non-accrual status since the second quarter of 2017. In the third quarter of 2019, we recorded a provision for loss on these receivables for their full carrying value. These receivables were acquired as part of a larger 2014 portfolio acquisition and represent assignments of land lease payments from two wind projects (the “Projects”) that became past due in the second quarter of 2017. We were informed by the owners of the Projects that the Projects experienced a decline in revenue. The owners of the Projects have terminated the leases. In July 2017, we filed a legal claim against the owners of the Projects in order to protect our interests in these Projects and the amounts due to us under the land lease assignments. In January 2018, we received a $1.6 million payment from the Projects, but have received no payments since that date. In October 2019, we received a court decision indicating that the owners of the projects were within their rights under the contract terms to terminate the lease which impacts the land lease assignments to us. We have appealed the court’s decision and expect to continue to pursue our legal claims.
Other than discussed previously, we had no receivables or investments that were impaired, on non-accrual status, no provision for credit losses, and no troubled debt restructurings as of December 31, 2019 or 2018.
Real Estate
Our real estate is leased to renewable energy projects, typically under long-term triple net leases with expiration dates that range between the years 2033 and 2057 under the initial terms and 2047 and 2080 if all renewals are exercised. The components of our real estate portfolio as of December 31, 2019 and 2018, were as follows:
December 31, |
|||||||
2019 |
2018 |
||||||
(in millions) |
|||||||
Real estate |
|||||||
Land |
$ |
$ |
|||||
Lease intangibles |
|||||||
Accumulated amortization of lease intangibles |
( |
) |
( |
) |
|||
Real estate |
$ |
$ |
|||||
As of December 31, 2019, the future amortization expense of the intangible assets and the future minimum rental income payments under our land lease agreements are as follows:
Year Ending December 31, |
Future
Amortization
Expense
|
Minimum
Rental
Payments
|
||||||
(in millions) |
||||||||
2020 |
$ |
$ |
||||||
2021 |
||||||||
2022 |
||||||||
2023 |
||||||||
2024 |
||||||||
Thereafter |
||||||||
Total |
$ |
$ |
||||||
- 96 -
Deferred Funding Obligations
7. Credit facilities
Senior credit facilities
We have two senior revolving credit facilities, a representation-based loan agreement (the “Rep-Based Facility”) and an approval-based loan agreement (the “Approval-Based Facility”) with various lenders, which mature in July 2023. The Rep-Based Facility is a senior secured revolving limited-recourse credit facility with a maximum outstanding principal amount of $250 million and the Approval-Based Facility is a senior secured revolving recourse credit facility with a maximum outstanding principal amount of $200 million. The proceeds from these credit facilities were used to pay off our existing senior secured revolving credit facility, which was terminated upon repayment.
The following table provides additional detail on our senior credit facilities as of December 31, 2019:
Rep-Based Facility |
Approval-Based Facility |
||||||
(dollars in millions) |
|||||||
Outstanding balance |
$ |
$ |
|||||
Value of collateral pledged to credit facility |
|||||||
Weighted average short-term borrowing rate |
N/A |
% |
|||||
Loans under the Rep-Based Facility bear interest at a rate equal to one-month LIBOR plus 1.40 % or 1.85 % (depending on the type of collateral) or, in certain circumstances, the Federal Funds Rate plus 0.40 % or 0.85 % (depending on the type of collateral) and loans under the Approval-Based Facility bear interest at a rate equal to one-month LIBOR plus 1.50 % or 2.00 % (depending on the type of collateral) or, under certain circumstances, the Federal Funds Rate plus 0.50 % or 1.00 % (depending on the type of collateral).
Inclusion of any financings of the Company in the borrowing base as collateral under the Rep-Based Facility will be subject to the Company making certain agreed upon representations and warranties. We have provided a limited guaranty covering the accuracy of the representations and warranties, and the repayment by the borrowers of certain amounts relating to any such financing is the exclusive remedy with respect to any breach of such representations and warranties under the Rep-Based Facility. Inclusion of any financings of the Company in the borrowing base as collateral under the Approval-Based Facility will be subject to the approval of a super-majority of the lenders, and we have provided a guaranty of the Approval-Based Facility.
The amount eligible to be drawn under the facilities is based on a discount to the value of each included investment based upon the type of collateral or an applicable valuation percentage. The sum of included financings after taking into account the applicable valuation percentages and any changes in the valuation of the financings in accordance with the Loan Agreements determines the borrowing capacity, subject to the overall facility limits described previously. Under the Rep-Based Facility, the applicable valuation percentage is 85 % in the case of a land-lease obligor or a U.S. Federal Government obligor, 80 % in the case of an institutional obligor or state and local obligor, and with respect to other obligors or in certain circumstances, such other percentage as the administrative agent may prescribe. Under the Approval-Based Facility, the applicable valuation percentage is 85 % in the case of certain approved financings and 67 % or such other percentage as the administrative agent may prescribe, including in the case of one asset, an agreed-upon amortization schedule. The stated minimum maturities to be paid under the amortization schedule to meet the required target loan balances as of December 31, 2019 are as follows:
Future Minimum Maturities |
||||
For the year ended December 31, |
(in millions) |
|||
2020 |
$ |
|||
2021 |
||||
2022 |
||||
2023 |
||||
Total |
$ |
|||
- 97 -
We have approximately $7 million of remaining unamortized costs associated with the credit facilities that have been capitalized and included in other assets on our balance sheet and are being amortized on a straight-line basis over the term of the credit facilities. Administrative fees are payable annually to the administrative agent under each of the Loan Agreements and letter agreements with the administrative agent. Under the Rep-Based Facility, we pay to the administrative agent on each monthly payment date, for the benefit of the lenders, certain availability fees for the Rep-Based Facility equal to 0.60 %, divided by 365 or 366, as applicable, multiplied by the excess of the available total commitments under the Rep-Based Loan Agreement over the actual amount borrowed under the Rep-Based Facility.
The credit facilities contain terms, conditions, covenants, and representations and warranties that are customary and typical for a transaction of this nature, including various affirmative and negative covenants, and limitations on the incurrence of liens and indebtedness, investments, fundamental organizational changes, dispositions, changes in the nature of business, transactions with affiliates, use of proceeds and stock repurchases. We were in compliance with our covenants as of December 31, 2019.
The credit facilities also include customary events of default, including the existence of a default in more than 50 % of underlying financings. The occurrence of an event of default may result in termination of the credit facilities, acceleration of amounts due under the credit facilities, and accrual of default interest at a rate of LIBOR plus 2.00 % in the case of both the Rep-Based Facility and the Approval-Based Facility.
8. Long-term Debt
Non-recourse debt
We have outstanding the following asset-backed non-recourse debt and bank loans:
|
Outstanding
Balance as of
December 31,
|
Interest
Rate
|
Maturity Date |
Anticipated
Balance at
Maturity
|
Carrying Value of
Assets Pledged
as of December 31,
|
Description of Assets
Pledged
|
|||||||||||||||||||||
2019 |
2018 |
2019 |
2018 |
|||||||||||||||||||||||
(dollars in millions) |
||||||||||||||||||||||||||
HASI Sustainable Yield Bond 2013-1 (1)
|
$ |
$ |
% |
December 2019 |
$ |
$ |
$ |
Receivables |
||||||||||||||||||
HASI Sustainable Yield Bond 2015-1A |
% |
October 2034 |
Receivables, real estate and real estate intangibles |
|||||||||||||||||||||||
HASI Sustainable Yield Bond 2015-1B Note |
% |
October 2034 |
Class B Bond of HASI Sustainable Yield Bond 2015-1 |
|||||||||||||||||||||||
2017 Credit Agreement |
% |
January 2023 |
(2) |
Equity interests in Strong Upwind Holdings I, II, III, and IV LLC, and Northern Frontier Wind, LLC |
||||||||||||||||||||||
HASI SYB Loan Agreement 2015-2 |
% |
(3) |
December 2023 |
Equity interest in Buckeye Wind Energy Class B Holdings LLC, related interest rate swap |
||||||||||||||||||||||
HASI SYB Trust 2016-2 |
% |
April 2037 |
Receivables |
|||||||||||||||||||||||
2017 Master Repurchase Agreement |
N/A |
January 2021 |
Receivables and investments |
|||||||||||||||||||||||
HASI ECON 101 Trust |
% |
May 2041 |
Receivables and investments |
|||||||||||||||||||||||
HASI SYB Trust 2017-1 |
% |
March 2042 |
Receivables, real estate and real estate intangibles |
|||||||||||||||||||||||
Lannie Mae Series 2019-1 |
% |
January 2047 |
Receivables, real estate and real estate intangibles |
|||||||||||||||||||||||
Other non-recourse debt (4)
|
3.15% - 7.45% |
2022 to 2032 |
Receivables |
|||||||||||||||||||||||
Debt issuance costs |
( |
) |
( |
) |
||||||||||||||||||||||
Non-recourse debt (5)
|
$ |
$ |
||||||||||||||||||||||||
(1) |
This bond was prepaid without penalty in the second quarter of 2019. |
(2) |
This loan was prepaid without penalty in January 2020 using the proceeds from the sale of our interest in Northern Frontier Wind, LLC, as described in Note 6. |
(3) |
Interest rate represents the current period’s LIBOR based rate plus the spread. We have hedged the LIBOR rate exposure using interest rate swaps fixed at |
(4) |
Other non-recourse debt consists of various debt agreements used to finance certain of our receivables for their term. Debt service payment requirements, in a majority of cases, are equal to or less than the cash flows received from the underlying receivables. |
- 98 -
(5) |
The total collateral pledged against our non-recourse debt was $ |
We have pledged the financed assets, and typically our interests in one or more parents or subsidiaries of the borrower that are legally separate bankruptcy remote special purpose entities as security for the non-recourse debt. There is no recourse for repayment of these obligations other than to the applicable borrower and any collateral pledged as security for the obligations. Generally, the assets and credit of these entities are not available to satisfy any of our other debts and obligations. The creditors can only look to the borrower, the cash flows of the pledged assets and any other collateral pledged, to satisfy the debt and we are not otherwise liable for nonpayment of such cash flows. The debt agreements contain terms, conditions, covenants, and representations and warranties that are customary and typical for transactions of this nature, including limitations on the incurrence of liens and indebtedness, investments, fundamental organizational changes, dispositions, changes in the nature of business, transactions with affiliates, use of proceeds and stock repurchases. The agreements also include customary events of default, the occurrence of which may result in termination of the agreements, acceleration of amounts due, and accrual of default interest. We typically act as servicer for the debt transactions. We are in compliance with all covenants as of December 31, 2019 and 2018.
We have guaranteed the accuracy of certain of the representations and warranties and other obligations of certain of our subsidiaries under certain of the debt agreements and provided an indemnity against certain losses from “bad acts” of such subsidiaries including fraud, failure to disclose a material fact, theft, misappropriation, voluntary bankruptcy or unauthorized transfers. In the case of the debt secured by certain of our renewable energy equity interests, we have also guaranteed the compliance of our subsidiaries with certain tax matters and certain obligations if our joint venture partners exercise their right to withdraw from our partnerships.
The stated minimum maturities of non-recourse debt as of December 31, 2019, were as follows:
Year Ending December 31, |
Future minimum
maturities
|
||
(in millions) |
|||
2020 |
$ |
||
2021 |
|||
2022 |
|||
2023 |
|||
2024 |
|||
Thereafter |
|||
Total minimum maturities |
|||
Deferred financing costs, net |
( |
) |
|
Total non-recourse debt |
$ |
||
The stated minimum maturities of non-recourse debt above include only the mandatory minimum principal payments. To the extent there are additional cash flows received from our investments in renewable energy projects serving as collateral for certain of our non-recourse debt facilities, these additional cash flows are required to be used to make additional principal payments against the respective debt. Any additional principal payments made due to these provisions may impact the anticipated balance at maturity of these financings.
Senior Unsecured Notes
In July 2019, we issued $350 million aggregate principal amount ($344 million net of issuance costs) of 5.25 % senior unsecured notes due July 15, 2024 (“2024 Notes”). In September 2019, we issued an additional $150 million aggregate principal amount 2024 Notes for total proceeds of $157 million ($155 million net of issuance costs). The 2024 Notes were issued jointly by certain of our TRSs and are guaranteed by the Company and certain other subsidiaries. The 2024 Notes require interest payments semi-annually in cash in arrears on January 15 and July 15 of each year, commencing on January 15, 2020. The proceeds of the 2024 Notes are intended to be used to acquire or refinance, in whole or in part, eligible green projects, including assets which are neutral to negative on incremental carbon emissions.
The 2024 Notes are unsecured, are subject to covenants may which limit our ability to incur additional indebtedness, and require us to maintain unencumbered assets of not less than 120 % of our unsecured debt. These covenants will terminate on any date at which the 2024 Notes have been rated investment grade by two of the three major credit rating agencies and no event of default has occurred. We are in compliance with all of our covenants as of December 31, 2019. The 2024 Notes impose certain requirements in the event that we merge with or sell substantially all of our assets to another entity.
- 99 -
Prior to July 15, 2021, we may redeem, at our option, some or all of the 2024 Notes for the outstanding principal amount plus the applicable “make-whole” premium as defined in the indenture governing the 2024 Notes and accrued and unpaid interest through the redemption date. In addition, prior to July 15, 2021, we may redeem up to 40 % of the 2024 Notes using the proceeds of certain equity offerings at a price equal to 105.25 % of the principal amount thereof, plus accrued but unpaid interest, if any, to, but excluding, the applicable redemption date. On, or subsequent to, July 15, 2021, we may redeem the senior unsecured notes in whole or in part at redemption prices defined in the indenture governing the senior unsecured notes, plus accrued and unpaid interest though the redemption date.
The following table presents a summary of the components of the 2024 Notes:
As of and for the year ended December 31, 2019 |
|||
(in millions) |
|||
Principal |
$ |
||
Accrued interest |
|||
Unamortized premium |
|||
Less: Unamortized financing costs |
( |
) |
|
Carrying value of 2024 Notes |
$ |
||
Interest expense |
$ |
||
Convertible Senior Notes
We issued $150 million aggregate principal amount ($145 million net of issuance costs) of 4.125 % convertible senior notes due September 1, 2022. Holders may convert any of their convertible notes into shares of our common stock at the applicable conversion rate at any time prior to the close of business on the second scheduled trading day immediately preceding the maturity date, unless the convertible notes have been previously redeemed or repurchased by us. Our board of directors approved a dividend of $0.335 per share payable to stockholders of record on December 26, 2019, which results in a conversion rate after that date of 36.7367 shares for each $1,000 principal amount of convertible notes with a conversion price of $27.22 . The conversion rate is subject to further adjustment for dividends declared above $0.33 per share per quarter and certain other events that may be dilutive to the holder. In February of 2020, our board of directors approved a dividend of $0.34 per share which will change the conversion rate to an amount to be determined on the ex-dividend date of April 1, 2020.
Following the occurrence of a make-whole fundamental change, we will, in certain circumstances, increase the conversion rate for a holder that converts its convertible notes in connection with such make-whole fundamental change. There are no cash settlement provisions in the convertible notes and the conversion option can only be settled through physical delivery of our common stock. Additionally, upon the occurrence of certain fundamental changes involving us, holders of the convertible notes may require us to redeem all or a portion of their convertible notes for cash at a price of 100 % of the principal amount outstanding, plus accrued and unpaid interest.
We have a redemption option to call the convertible notes prior to maturity (i) on or after March 1, 2022 and (ii) at any time if such a redemption is deemed reasonably necessary to preserve our qualification as a REIT. The redemption price will be equal to the principal of the notes being redeemed, plus accrued and unpaid interest. In the event of redemption after March 1, 2022, there will be an additional make-whole premium paid to the holder of the redeemed notes unless the redemption is deemed reasonably necessary to preserve our qualification as a REIT.
The following table presents a summary of the components of the convertible notes:
As of and for the year ended December 31, |
|||||||
2019 |
2018 |
||||||
(in millions) |
|||||||
Principal |
$ |
$ |
|||||
Accrued interest |
|||||||
Less: |
|||||||
Unamortized financing costs |
( |
) |
( |
) |
|||
Carrying value of convertible notes |
$ |
$ |
|||||
Interest expense |
$ |
$ |
|||||
- 100 -
9. Commitments and Contingencies
Leases
We lease office space at our headquarters in Annapolis, Maryland under an operating lease entered into in 2011 and amended in 2013 and 2017 to add additional space. The lease provides for operating expense reimbursements and annual escalations that are amortized over the respective lease terms on a straight-line basis. Lease payments under this lease commenced in 2012 and incremental payments related to the amendments commenced in 2014 and 2017. The lease expires in 2027.
Rent expense was less than $1 million for each of the years ended December 31, 2019, 2018, and 2017, respectively. Future gross minimum lease payments are less than $1 million per year during the remaining term of the lease.
Litigation
The nature of our operations exposes us to the risk of claims and litigation in the normal course of our business. We are not currently subject to any legal proceedings that are probable of having a material adverse effect on our financial position, results of operations or cash flows.
Guarantees to other transaction participants
In connection with some of our transactions, we have provided certain limited representations, warranties, covenants and/or provided an indemnity against certain losses resulting from our own actions, including related to certain investment tax credits. As of December 31, 2019, there have been no such actions resulting in claims against the Company.
10. Income Tax
We recorded an income tax expense of approximately $8 million, for the year ended December 31, 2019, $2 million for the year ended December 31, 2018 and $0.8 million for the year ended 2017, related to the activities of our TRS. The federal income tax expense and benefits recorded were determined using a rate of 21% in 2019 and 2018 and 35% in 2017. Our deferred tax assets and liabilities were measured using a federal rate of 21% in 2019. Below is a reconciliation between the statutory rates of our TRS entities as of December 31, 2019 and our effective tax rates for the years ended December 31:
2019 |
2018 |
2017 |
||||||
Federal statutory income tax rate |
% |
% |
% |
|||||
Changes in rate resulting from: |
||||||||
Share-based compensation |
% |
( |
)% |
( |
)% |
|||
Equity method investments |
( |
)% |
( |
)% |
( |
)% |
||
Other |
( |
)% |
% |
% |
||||
Valuation allowance |
( |
)% |
% |
% |
||||
TCJA rate revaluation adjustment |
% |
% |
% |
|||||
Effective tax rate |
% |
% |
% |
|||||
- 101 -
2019 |
2018 |
||||||
(in millions) |
|||||||
Net operating loss (NOL) carryforwards |
|||||||
Tax credit carryforwards |
|||||||
Share-based compensation |
|||||||
Other |
|||||||
Valuation allowance |
( |
) |
|||||
Gross deferred tax assets |
|||||||
Receivables basis difference |
$ |
( |
) |
$ |
( |
) |
|
Equity method investments |
( |
) |
( |
) |
|||
Gross deferred tax liabilities |
( |
) |
( |
) |
|||
Net deferred tax liabilities |
$ |
( |
) |
$ |
( |
) |
|
We have unused NOLs of $121 million and tax credits of approximately $13 million. Approximately, $105 million of our NOLs will begin to expire in 2035. If our TRS entities were to experience a change in control as defined in Section 382 of the Internal Revenue Code, the TRS’s ability to utilize NOL in the years after the change in control would be limited. Similar rules and limitation may apply for state tax purposes as well. Of our NOLs, $16 million were added in 2018 and 2019, which are not subject to expiration but are limited to 80% of taxable income. We have $13 million of tax credits related to our renewable energy investments which begin to expire in 2034.
We have no examinations in progress, none are expected at this time, and years 2016 through 2019 are open. As of December 2019 and 2018, we had no uncertain tax positions. Our policy is to recognize interest expense and penalties related to income tax matters as a component of general and administrative expense. There were no accrued interest and penalties as of December 31, 2019 and 2018, and no interest and penalties were recognized during the years ended December 31, 2019, 2018, or 2017.
For federal income tax purposes, the cash dividends paid for the years ended December 31, 2019 and 2018 are characterized as follows:
2019 |
2018 |
||||
Common distributions |
|||||
Ordinary income |
% |
% |
|||
Return of capital |
% |
% |
|||
% |
% |
||||
U.S. Federal Income Tax Legislation
The TCJA, which was signed into law on December 22, 2017, made significant changes to the U.S. federal income tax laws applicable to businesses and their owners, including REITs and their stockholders. Certain key provisions of the TCJA impact us and could impact us in the future , include the following:
• |
Reduced tax rates - the highest individual U.S. federal income tax rate on ordinary income is reduced from 39.6% to 37% (through taxable years ending in 2025), and the maximum corporate income tax rate is reduced from 35% to 21%. In addition, individuals, trust, and estates that own our stock are permitted to deduct up to 20% of dividends received from us (other than dividends that are designated as capital gain dividends or qualified dividend income), generally resulting in an effective maximum U.S. federal income tax rate of 29.6% on such dividends (through taxable years ending in 2025). Further, the amount that we are required to withhold on distributions to non-U.S. stockholders that are treated as attributable to gains from our sale or exchange of U.S. real property interests is reduced from 35% to 21%.
|
• |
Net operating losses - we and our TRSs may not use NOLs generated beginning in 2018 to offset more than 80% of our or our TRSs’ taxable income (prior to the application of the dividends paid deduction). NOLs generated beginning in 2018 can be carried forward indefinitely but can no longer be carried back.
|
- 102 -
• |
Limitation on interest deductions - the amount of net interest expense that certain taxpayers, including us and our TRSs, may deduct for a taxable year is limited to the sum of (i) the taxpayer’s business interest income for the taxable year, and (ii) 30% of the taxpayer’s “adjusted taxable income” for the taxable year. For taxable years beginning before January 1, 2022, adjusted taxable income means earnings before interest, taxes, depreciation, and amortization; for taxable years beginning on or after January 1, 2022, adjusted taxable income is limited to earnings before interest and taxes.
|
• |
Alternative Minimum Tax - the corporate alternative minimum tax is eliminated.
|
• |
Income accrual - we and our TRSs are required to recognize certain items of income for U.S. federal income tax purposes no later than we would report such items on our financial statements. Earlier recognition of income for U.S. federal income tax purposes could impact our ability to satisfy the REIT distribution requirements. However, recently released proposed Treasury Regulations generally would exclude, among other items, original issue discount (whether or not de minimis) and market discount from the applicability of this rule. Although the proposed Treasury Regulations generally will not be effective until taxable years beginning after the date on which they are issued in final form, we generally are permitted to elect to rely on the proposed Treasury Regulations currently.
|
• |
Tax credits - the TCJA modifies the availability and the use by certain taxpayers of certain tax credits for investments in certain wind, solar, and other renewable energy assets.
|
11. Equity
Dividends and Distributions
Our board of directors declared the following dividends in 2018 and 2019:
Announced Date |
Record Date |
Pay Date |
Amount per share |
|||||
2/21/2018 |
4/4/2018 |
4/12/2018 |
$ |
|||||
5/31/2018 |
7/5/2018 |
7/12/2018 |
||||||
9/12/2018 |
10/3/2018 |
10/11/2018 |
||||||
12/12/2018 |
12/26/2018 |
(1) |
1/10/2019 |
|||||
2/21/2019 |
4/3/2019 |
4/11/2019 |
||||||
6/6/2019 |
7/5/2019 |
7/12/2019 |
||||||
9/12/2019 |
10/3/2019 |
10/10/2019 |
||||||
12/13/2019 |
12/26/2019 |
(1) |
1/10/2020 |
|||||
(1) |
These dividends are treated as distributions in the following year for tax purposes. |
Equity Offerings
We have an effective universal shelf registration statement registering the potential offer and sale, from time to time and in one or more offerings, of any combination of our common stock, preferred stock, depositary shares, debt securities, warrants and rights (collectively referred to as the “securities”). We may offer the securities directly, through agents, or to or through underwriters by means of ordinary brokers’ transactions on the NYSE or otherwise at market prices prevailing at the time of sale or at negotiated prices and may include “at the market” (“ATM”) offerings or sales, to or through a market maker or into an existing trading market on an exchange or otherwise. We completed the following public offerings (including ATM issuances) of our common stock in 2018 and 2019:
Closing Date |
Common Stock
Offerings
|
Shares
Issued (1)
|
Price
Per Share
|
Net
Proceeds (2)
|
|||||||
(amounts in millions, except per share amounts) |
|||||||||||
5/18/2018 to 6/25/2018 |
ATM |
(3) |
|||||||||
11/15/2018 to 12/11/2018 |
ATM |
(3) |
|||||||||
12/17/2018 and 1/3/2019 |
Public Offering |
(4) |
|||||||||
1/23/2019 to 3/21/2019 |
ATM |
(3) |
|||||||||
5/7/2019 to 6/7/2019 |
ATM |
(3) |
|||||||||
12/12/2019 |
ATM |
(3) |
|||||||||
(1) |
Includes shares issued in connection with the exercise of the underwriters’ option to purchase additional shares. |
(2) |
Net proceeds from the offerings are shown after deducting underwriting discounts, commissions and other offering costs. |
- 103 -
(3) |
Represents the average price per share at which investors in our ATM offerings purchased our shares. |
(4) |
Represents the price per share at which the underwriters in our public offerings purchased our shares. |
We have 5,559,819 awards authorized for issuance under our 2013 Plan. As of December 31, 2019, we have issued awards with service, performance and market conditions and have 1,990,996 awards remaining available for issuance. During the year ended December 31, 2019, our board of directors awarded employees and directors 586,909 shares of restricted stock, restricted stock units, and LTIP Units that vest from 2020 to 2023. As of December 31, 2019, as it relates to previously issued restricted stock awards with performance conditions, we have concluded that it is probable that the performance conditions will be met. Refer to Note 4 for background on the LTIP Units.
A summary of equity-based compensation expense and the fair value of shares vested on the vesting date for the years ended December 31, 2019, 2018, and 2017 is as follows:
2019 |
2018 |
2017 |
|||||||||
(in millions) |
|||||||||||
Equity-based compensation expense |
$ |
$ |
$ |
||||||||
Fair value of awards vested on vesting date |
|||||||||||
The total unrecognized compensation expense related to awards of shares of restricted stock and restricted stock units was approximately $14 million as of December 31, 2019. We expect to recognize compensation expense related to these awards over a weighted-average term of approximately two years . A summary of the unvested shares of restricted common stock that have been issued is as follows:
|
Restricted Shares of
Common Stock
|
Weighted Average Grant Date Fair Value |
Value |
||||||||
(per share) |
(in millions) |
|||||||||
Ending Balance—December 31, 2017 |
$ |
$ |
||||||||
Granted |
||||||||||
Vested |
( |
) |
( |
) |
||||||
Forfeited |
( |
) |
( |
) |
||||||
Ending Balance—December 31, 2018 |
$ |
$ |
||||||||
Granted |
||||||||||
Vested |
( |
) |
( |
) |
||||||
Forfeited |
( |
) |
( |
) |
||||||
Ending Balance—December 31, 2019 |
||||||||||
A summary of the unvested shares of restricted stock units that have market based vesting conditions that have been issued is as follows:
|
Restricted Stock
Units (1)
|
Weighted Average Grant Date Fair Value |
Value |
||||||||
(per share) |
(in millions) |
|||||||||
Ending Balance—December 31, 2017 |
$ |
$ |
||||||||
Granted |
||||||||||
Vested |
( |
) |
( |
) |
||||||
Forfeited |
( |
) |
( |
) |
||||||
Ending Balance—December 31, 2018 |
$ |
$ |
||||||||
Granted |
||||||||||
Vested |
( |
) |
||||||||
Forfeited |
( |
) |
( |
) |
||||||
Ending Balance—December 31, 2019 |
$ |
$ |
||||||||
- 104 -
(1) |
As discussed in Note 2, restricted stock units with market-based vesting conditions can vest between |
A summary of the unvested LTIP Units that have time-based vesting conditions that have been issued is as follows:
LTIP Units (1)
|
Weighted Average Grant Date Fair Value |
Value |
||||||||
(per share) |
(in millions) |
|||||||||
Ending Balance—December 31, 2018 |
$ |
$ |
||||||||
Granted |
||||||||||
Vested |
( |
) |
( |
) |
||||||
Forfeited |
||||||||||
Ending Balance—December 31, 2019 |
$ |
$ |
||||||||
(1) See Note 4 for information on the vesting of LTIP Units.
A summary of the unvested LTIP Units that have market-based vesting conditions that have been issued is as follows:
LTIP Units (1)
|
Weighted Average Grant Date Fair Value |
Value |
||||||||
(per share) |
(in millions) |
|||||||||
Ending Balance—December 31, 2018 |
$ |
$ |
||||||||
Granted |
||||||||||
Vested |
||||||||||
Forfeited |
||||||||||
Ending Balance—December 31, 2019 |
$ |
$ |
||||||||
(1) See Note 4 for information on the vesting of LTIP Units. LTIP Units with market-based vesting conditions can vest between 0 % and 200 % subject to both the absolute performance of the Company’s common stock as well as relative performance compared to a group of peers.
12. Earnings per Share of Common Stock
Both the net income or loss attributable to the non-controlling OP units and the non-controlling limited partners’ outstanding OP units have been excluded from the basic earnings per share and the diluted earnings per share calculations attributable to common stockholders. Unvested share-based payment awards that contain non-forfeitable rights to dividends or dividend equivalents (whether paid or unpaid) are participating securities and are included in the computation of earnings per share pursuant to the two-class method. Our convertible notes and certain share based awards are included in the dilutive share count to the extent they are dilutive as discussed in Note 2.
- 105 -
The computation of basic and diluted earnings per common share of common stock is as follows:
Year ended December 31, |
|||||||||||
Numerator: |
2019 |
2018 |
2017 |
||||||||
(dollars in millions, except share and per share data) |
|||||||||||
Net income (loss) attributable to controlling stockholders and participating securities |
$ |
$ |
$ |
||||||||
Less: Dividends on participating securities |
( |
) |
( |
) |
( |
) |
|||||
Undistributed earnings attributable to participating securities |
|||||||||||
Net income (loss) attributable to controlling stockholders |
$ |
$ |
$ |
||||||||
Denominator: |
|||||||||||
Weighted-average number of common shares—basic |
|||||||||||
Weighted-average number of common shares—diluted |
|||||||||||
Basic earnings per common share |
$ |
$ |
$ |
||||||||
Diluted earnings per common share |
$ |
$ |
$ |
||||||||
Securities being allocated a portion of earnings: |
|||||||||||
Weighted-average number of OP units |
|||||||||||
Participating securities: |
|||||||||||
Unvested restricted common stock and unvested LTIP Units with time-based vesting conditions outstanding at period end |
|||||||||||
Potentially dilutive securities as of period end: |
|||||||||||
Unvested restricted common stock and unvested LTIP Units with time-based vesting conditions |
|||||||||||
Restricted stock units |
|||||||||||
LTIP Units with market-based vesting conditions |
|||||||||||
Potential shares of common stock related to convertible notes |
|||||||||||
13. Equity Method Investments
We have non-controlling unconsolidated equity investments in renewable energy and energy efficiency projects. During the years ended December 31, 2019, 2018, and 2017 we recognized income (loss) of $64.2 million, $22.2 million, and $22.3 million respectively, from our equity method investments. We describe our accounting for the non-controlling equity investments in Note 2.
The following is a summary of the consolidated financial position and results of operations of the significant entities accounted for using the equity method.
- 106 -
Balance Sheet |
||||
As of September 30, 2019 |
||||
Current assets |
$ |
|||
Total assets |
||||
Current liabilities |
||||
Total liabilities |
||||
Members’ equity |
||||
As of December 31, 2018 |
||||
Current assets |
||||
Total assets |
||||
Current liabilities |
||||
Total liabilities |
||||
Members’ equity |
||||
Income Statement |
||||
For the nine months ended September 30, 2019 |
||||
Revenue |
||||
Income from continuing operations |
( |
) |
||
Net income |
( |
) |
||
For the year ended December 31, 2018 |
||||
Revenue |
||||
Income from continuing operations |
( |
) |
||
Net income |
( |
) |
||
For the year ended December 31, 2017 |
||||
Revenue |
||||
Income from continuing operations |
( |
) |
||
Net income |
( |
) |
||
14. Defined Contribution Plan
We administer a 401(k) savings plan, a defined contribution plan covering substantially all of our employees. Employees in the plan may contribute up to the maximum annual IRS limit before taxes via payroll deduction. Under the plan, we provide a dollar for dollar match for the first 4% of the employee's contributions and a $0.50 per dollar match for the next 2% of employee contributions. We contributed less than $1 million under the plan for the years ended December 31, 2019, 2018, and 2017, respectively.
- 107 -
15. Selected Quarterly Financial Data (Unaudited)
The following table summarizes our quarterly financial data which, in the opinion of management, reflects all adjustments, consisting only of normal recurring adjustments, necessary for a fair presentation of our results of operations (Amounts for the individual quarters when aggregated may not agree to the full year due to rounding):
For the Three-Months Ended |
|||||||||||||||
(in millions, except for per share data) |
|||||||||||||||
March 31, 2019 |
June 30, 2019 |
Sept. 30, 2019 |
Dec. 31, 2019 |
||||||||||||
Total revenue |
$ |
$ |
$ |
$ |
|||||||||||
Total expenses |
|||||||||||||||
Income before equity method investments |
|||||||||||||||
Income (loss) from equity method investments |
|||||||||||||||
Income (loss) before income taxes |
|||||||||||||||
Income tax (expense) benefit |
( |
) |
( |
) |
( |
) |
|||||||||
Net income (loss) |
|||||||||||||||
Net income (loss) attributable to controlling stockholders |
$ |
$ |
$ |
$ |
|||||||||||
Basic earnings (loss) per common share |
$ |
$ |
$ |
$ |
|||||||||||
Diluted earnings (loss) per common share |
|||||||||||||||
For the Three-Months Ended |
|||||||||||||||
(in millions, except for per share data) |
|||||||||||||||
March 31, 2018 |
June 30, 2018 |
Sept. 30, 2018 |
Dec. 31, 2018 |
||||||||||||
Total revenue |
$ |
$ |
$ |
$ |
|||||||||||
Total expenses |
|||||||||||||||
Income before equity method investments |
|||||||||||||||
Income (loss) from equity method investments |
( |
) |
|||||||||||||
Income (loss) before income taxes |
( |
) |
|||||||||||||
Income tax (expense) benefit |
( |
) |
( |
) |
( |
) |
( |
) |
|||||||
Net income (loss) |
( |
) |
|||||||||||||
Net income (loss) attributable to controlling stockholders |
$ |
( |
) |
$ |
$ |
$ |
|||||||||
Basic earnings (loss) per common share |
$ |
( |
) |
$ |
$ |
$ |
|||||||||
Diluted earnings (loss) per common share |
( |
) |
|||||||||||||
- 108 -
Item 9. |
Changes in and Disagreements with Accountants on Accounting and Financial Disclosure |
None.
Item 9A. |
Controls and Procedures |
A review and evaluation was performed by our management, including our chief executive officer and chief financial officer, of the effectiveness of the design and operation of our disclosure controls and procedures (as such term is defined in Rules 13a-15(e) and 15d-15(e) under the Exchange Act), as of the end of the period covered by this Form 10-K. Based on that review and evaluation, the chief executive officer and chief financial officer have concluded that our current disclosure controls and procedures, as designed and implemented, were effective. Notwithstanding the foregoing, a control system, no matter how well designed and operated, can provide only reasonable, not absolute, assurance that it will detect or uncover failures within our company to disclose material information otherwise required to be set forth in our periodic reports.
Management’s Report on Internal Control Over Financial Reporting
Our management is responsible for establishing and maintaining adequate internal control over financial reporting. Internal control over financial reporting is defined in Rules 13a-15(f) and 15d-15(f) promulgated under the Exchange Act as a process designed by, or under the supervision of, our principal executive and principal financial officers and effected by our board of directors, management and other personnel to provide reasonable assurance regarding the reliability of financial reporting and the preparation of financial statements for external purposes in accordance with U.S. GAAP and includes those policies and procedures that:
• |
pertain to the maintenance of records that in reasonable detail accurately and fairly reflect the transactions and dispositions of the assets of our company; |
• |
provide reasonable assurance that transactions are recorded as necessary to permit preparation of financial statements in accordance with U.S. GAAP, and that our receipts and expenditures are being made only in accordance with authorizations of our management and directors; and |
• |
provide reasonable assurance regarding prevention or timely detection of unauthorized acquisition, use or disposition of our assets that could have a material effect on the financial statements. |
Because of its inherent limitations, internal control over financial reporting may not prevent or detect misstatements. Projections of any evaluation of effectiveness to future periods are subject to the risks that controls may become inadequate because of changes in conditions or that the degree of compliance with the policies or procedures may deteriorate.
Our management assessed the effectiveness of our internal control over financial reporting as of December 31, 2019. In making this assessment, our management used criteria set forth by the Committee of Sponsoring Organizations of the Treadway Commission in Internal Control-Integrated Framework (2013 Framework).
Based on this assessment, our management believes that, as of December 31, 2019, our internal control over financial reporting was effective based on those criteria.
Changes in Internal Control Over Financial Reporting
There have been no changes in our internal control over financial reporting that occurred during the quarter ended December 31, 2019 that have materially affected, or are reasonably likely to materially affect, our internal control over financial reporting.
Our company’s independent registered public accounting firm, Ernst & Young LLP, has issued an attestation report on the effectiveness of our company’s internal control over financial reporting. This report appears on page 79 of this annual report on Form 10-K.
Item 9B. |
Other Information |
None.
- 109 -
PART III
Item 10. |
Directors, Executive Officers and Corporate Governance |
The information regarding our directors, executive officers and certain other matters required by Item 401 of Regulation S-K is incorporated herein by reference to our definitive proxy statement relating to our annual meeting of stockholders (the “Proxy Statement”), to be filed with the SEC within 120 days after December 31, 2019.
The information regarding compliance with Section 16(a) of the Exchange Act required by Item 405 of Regulation S-K is incorporated herein by reference to the Proxy Statement to be filed with the SEC within 120 days after December 31, 2019.
The information regarding our Code of Business Conduct and Ethics required by Item 406 of Regulation S-K is incorporated herein by reference to the Proxy Statement to be filed with the SEC within 120 days after December 31, 2019.
The information regarding certain matters pertaining to our corporate governance required by Item 407(c)(3), (d)(4) and (d)(5) of Regulation S-K is incorporated by reference to the Proxy Statement to be filed with the SEC within 120 days after December 31, 2019.
Item 11. |
Executive Compensation |
The information regarding executive compensation and other compensation related matters required by Items 402 and 407(e)(4) and (e)(5) of Regulation S-K is incorporated herein by reference to the Proxy Statement to be filed with the SEC within 120 days after December 31, 2019.
Item 12. |
Security Ownership of Certain Beneficial Owners and Management and Related Stockholder Matters |
The tables on equity compensation plan information and beneficial ownership of our Company required by Items 201(d) and 403 of Regulation S-K are incorporated herein by reference to the Proxy Statement to be filed with the SEC within 120 days after December 31, 2019.
Item 13. |
Certain Relationships and Related Transactions and Director Independence |
The information regarding transactions with related persons, promoters and certain control persons and director independence required by Items 404 and 407(a) of Regulation S-K is incorporated herein by reference to the Proxy Statement to be filed with the SEC within 120 days after December 31, 2019.
Item 14. |
Principal Accountant Fees and Services |
The information concerning principal accounting fees and services and the Audit Committee’s pre-approval policies and procedures required by Item 14 is incorporated herein by reference to the Proxy Statement to be filed with the SEC within 120 days after December 31, 2019.
- 110 -
PART IV
Item 15. |
Exhibits and Financial Statement Schedules |
Documents filed as part of the report
The following documents are filed as part of this Form 10-K in Part II, Item 8 and are incorporated by reference:
(a)(1) Financial Statements:
See index in Item 8—“Financial Statements and Supplementary Data,” filed herewith for a list of financial statements.
(3) |
Exhibits Files: |
|
Exhibit
number
|
Exhibit description |
3.1 |
|
3.2 |
|
3.3 |
|
4.1 |
|
4.2* |
|
4.3 |
|
4.4 |
|
4.5 |
|
10.1 |
|
10.2 |
|
10.3 |
|
10.4 |
|
10.5 |
|
- 111 -
10.6 |
|
10.7 |
|
10.8 |
|
10.9 |
|
10.10 |
|
10.11 |
|
10.12 |
|
10.13 |
|
10.14 |
|
10.15 |
|
10.16 |
|
10.17 |
|
10.18 |
|
10.19 |
|
10.20 |
|
10.21 |
|
- 112 -
10.22 |
|
10.23 |
|
10.24 |
|
10.25 |
|
10.26 |
|
21.1* |
|
23.1* |
|
24.1* |
Power of Attorney (included on signature page) |
31.1* |
|
31.2* |
|
32.1** |
|
32.2** |
|
101.SCH* |
Inline XBRL Taxonomy Extension Schema |
101.CAL* |
Inline XBRL Taxonomy Extension Calculation Linkbase |
101.DEF* |
Inline XBRL Taxonomy Extension Definition Linkbase |
101.LAB* |
Inline XBRL Taxonomy Extension Label Linkbase |
101 PRE* |
Inline XBRL Taxonomy Extension Presentation Linkbase |
104 |
Cover Page Interactive Data File Included as Exhibit 101 (embedded within the Inline XBRL document) |
* Filed herewith. | |
** Furnished with this report. | |
Item 16. |
Form 10-K Summary |
None.
- 113 -
SIGNATURES
Pursuant to the requirements of Section 13 or 15(d) of the Securities Exchange Act of 1934, the registrant has duly caused this report to be signed on its behalf by the undersigned, thereunto duly authorized.
HANNON ARMSTRONG SUSTAINABLE |
|
INFRASTRUCTURE CAPITAL, INC. |
|
(Registrant) |
|
Date: February 24, 2020 |
/s/ Jeffrey W. Eckel |
Jeffrey W. Eckel |
|
Chairman, Chief Executive Officer and President |
|
/s/ Charles W. Melko |
|
Charles W. Melko |
|
Chief Accounting Officer and Senior Vice President |
|
- 114 -
POWER OF ATTORNEY
KNOW ALL PERSONS BY THESE PRESENTS, that each person whose signature appears below constitutes and appoints Jeffrey W. Eckel and Charles W. Melko, and each of them, with full power to act without the other, such person’s true and lawful attorneys-in-fact and agents, with full power of substitution and resubstitution, for him or her and in his or her name, place and stead, in any and all capacities, to sign this Form 10-K and any and all amendments thereto, and to file the same, with exhibits and schedules thereto, and other documents in connection therewith, with the Securities and Exchange Commission, granting unto said attorneys-in-fact and agents, and each of them, full power and authority to do and perform each and every act and thing necessary or desirable to be done in and about the premises, as fully to all intents and purposes as he or she might or could do in person, hereby ratifying and confirming all that said attorneys-in-fact and agents, or any of them, or their or his or her substitute or substitutes, may lawfully do or cause to be done by virtue hereof.
Pursuant to the requirements of the Securities Exchange Act of 1934, as amended, this report has been signed below by the following persons on behalf of the Registrant and in the capacities and on the dates indicated.
Signatures |
Title |
||
By: |
/s/ Jeffrey W. Eckel |
Chairman of the Board, President |
February 24, 2020 |
Jeffrey W. Eckel |
and Chief Executive Officer |
||
(Principal Executive Officer) |
|||
By: |
/s/ Jeffrey A. Lipson |
Chief Financial Officer and |
February 24, 2020 |
Jeffrey A. Lipson |
Executive Vice President |
||
(Principal Financial Officer) |
|||
By: |
/s/ Charles W. Melko |
Chief Accounting Officer and |
February 24, 2020 |
Charles W. Melko |
Senior Vice President |
||
(Principal Accounting Officer) |
|||
By: |
/s/ Teresa M. Brenner |
February 24, 2020 |
|
Teresa M. Brenner |
|||
By: |
/s/ Michael T. Eckhart |
February 24, 2020 |
|
Michael T. Eckhart |
|||
By: |
/s/ Simone F. Lagomarsino |
February 24, 2020 |
|
Simone F. Lagomarsino |
|||
By: |
/s/ Charles M. O’Neil |
February 24, 2020 |
|
Charles M. O’Neil |
|||
By: |
/s/ Richard J. Osborne |
February 24, 2020 |
|
Richard J. Osborne |
|||
By: |
/s/ Steven G. Osgood |
February 24, 2020 |
|
Steven G. Osgood |
|||
- 115 -