10-K: Annual report pursuant to Section 13 and 15(d)
Published on March 1, 2016
Table of Contents
UNITED STATES
SECURITIES AND EXCHANGE COMMISSION
WASHINGTON, D.C. 20549
FORM 10-K
| x | ANNUAL REPORT PURSUANT TO SECTION 13 OR 15(d) OF THE SECURITIES EXCHANGE ACT OF 1934 |
For the fiscal year ended December 31, 2015
OR
| ¨ | TRANSITION REPORT PURSUANT TO SECTION 13 OR 15(d) OF THE SECURITIES EXCHANGE ACT OF 1934 |
For the transition period from to
Commission File Number: 001-35877
HANNON ARMSTRONG SUSTAINABLE
INFRASTRUCTURE CAPITAL, INC.
(Exact name of registrant as specified in its charter)
| Maryland | 46-1347456 | |
| (State or other jurisdiction of incorporation or organization) |
(I.R.S. Employer Identification No.) |
| 1906 Towne Centre Blvd Suite 370 Annapolis, MD |
21401 | |
| (Address of principal executive offices) | (Zip Code) |
(410) 571-9860
(Registrants telephone number, including area code)
Securities registered pursuant to Section 12(b) of the Act:
| Title of Each Class |
Name of Each Exchange on Which Registered |
|
| Common Stock, $0.01 par value | New York Stock Exchange |
Securities registered pursuant to Section 12(g) of the Act:
None
Indicate by check mark if the registrant is a well-known seasoned issuer, as defined in Rule 405 of the Securities Act. Yes ¨ No x
Indicate by check mark if the registrant is not required to file reports pursuant to Section 13 or Section 15(d) of the Exchange Act. Yes ¨ No x
Indicate by check mark whether the registrant (1) has filed all reports required to be filed by Section 13 or 15(d) of the Securities Exchange Act of 1934 during the preceding 12 months (or for such shorter period that the registrant was required to file such reports), and (2) has been subject to such filing requirements for the past 90 days. Yes x No ¨
Indicate by check mark whether the registrant has submitted electronically and posted on its corporate Web site, if any, every Interactive Data File required to be submitted and posted pursuant to Rule 405 of Regulation S-T (§ 232.405 of this chapter) during the preceding 12 months (or for such shorter period that the registrant was required to submit and post such files). Yes x No ¨
Indicate by check mark if disclosure of delinquent filers pursuant to Item 405 of Regulation S-K (§ 229.405 of this chapter) is not contained herein, and will not be contained, to the best of registrants knowledge, in definitive proxy or information statements incorporated by reference in Part III of this Form 10-K or any amendment to this Form 10-K. x
Indicate by check mark whether the registrant is a large accelerated filer, an accelerated filer, a non-accelerated filer or a smaller reporting company. See the definitions of large accelerated filer, accelerated filer and smaller reporting company in Rule 12b-2 of the Exchange Act.
| Large accelerated filer | ¨ | Accelerated filer | x | |||
| Non-accelerated filer | ¨ (Do not check if a smaller reporting company) | Smaller reporting company | ¨ | |||
Indicate by check mark whether the registrant is a shell company (as defined in Rule 12b-2 of the Exchange Act). Yes ¨ No x
As of June 30, 2015, the aggregate market value of the registrants common stock (includes unvested restricted stock) held by non-affiliates of the registrant was $609 million based on the closing sales price of the registrants common stock on June 30, 2015 as reported on the New York Stock Exchange.
On February 26, 2016 the registrant had a total of 38,332,988 shares of common stock, $0.01 par value, outstanding (which includes 1,321,516 shares of unvested restricted common stock).
DOCUMENTS INCORPORATED BY REFERENCE
Portions of the registrants proxy statement for the 2016 annual meeting of stockholders are incorporated by reference into Part III of this Annual Report on Form 10-K.
Table of Contents
| Page | ||||||
| PART I | 5 | |||||
| Item 1. |
Business. | 5 | ||||
| Item 1A. |
Risk Factors. | 13 | ||||
| Item 1B. |
Unresolved Staff Comments. | 50 | ||||
| Item 2. |
Properties. | 50 | ||||
| Item 3. |
Legal Proceedings. | 50 | ||||
| Item 4. |
Mine Safety Disclosures. | 50 | ||||
| PART II | 51 | |||||
| Item 5. |
Market for Registrants Common Equity, Related Stockholder Matters and Issuer Purchases of Equity Securities. | 51 | ||||
| Item 6. |
Selected Financial Data. | 54 | ||||
| Item 7. |
Managements Discussion and Analysis of Financial Condition and Results of Operations. | 56 | ||||
| Item 7A. |
Quantitative and Qualitative Disclosures About Market Risk. | 87 | ||||
- 2 -
Table of Contents
FORWARD-LOOKING STATEMENTS
We make forward-looking statements in this Annual Report on Form 10-K (Form 10-K) within the meaning of Section 27A of the Securities Act of 1933, as amended (the Securities Act), and Section 21E of the Securities Exchange Act of 1934, as amended (the Exchange Act) that are subject to risks and uncertainties. For these statements, we claim the protections of the safe harbor for forward-looking statements contained in such Sections. These forward-looking statements include information about possible or assumed future results of our business, financial condition, liquidity, results of operations, plans and objectives. When we use the words believe, expect, anticipate, estimate, plan, continue, intend, should, may or similar expressions, we intend to identify forward-looking statements.
Forward-looking statements are subject to significant risks and uncertainties. Investors are cautioned against placing undue reliance on such statements. Actual results may differ materially from those set forth in the forward-looking statements. Statements regarding the following subjects, among others, may be forward-looking:
| | our expected returns and performance of our investments; |
| | the state of government legislation, regulation and policies that support energy efficiency, renewable energy and sustainable infrastructure projects and that enhance the economic feasibility of energy efficiency, renewable energy and sustainable infrastructure projects and the general market demands for such projects; |
| | market trends in our industry, energy markets, commodity prices, interest rates, the debt and lending markets or the general economy; |
| | our business and investment strategy; |
| | availability of opportunities to finance energy efficiency, renewable energy and sustainable infrastructure projects and our ability to complete potential new opportunities in our pipeline; |
| | our relationships with originators, investors, market intermediaries and professional advisers; |
| | competition from other providers of financing; |
| | our or any other companies projected operating results; |
| | actions and initiatives of the U.S. federal, state and local governments and changes to U.S. federal, state and local government policies, regulations, tax laws and rates and the execution and impact of these actions, initiatives and policies; |
| | the state of the U.S. economy generally or in specific geographic regions, states or municipalities; economic trends and economic recoveries; |
| | our ability to obtain and maintain financing arrangements on favorable terms, including securitizations; |
| | general volatility of the securities markets in which we participate; |
| | changes in the value of our assets, our portfolio of assets and our investment and underwriting process; |
| | interest rate and maturity mismatches between our assets and any borrowings used to fund such assets; |
| | changes in interest rates and the market value of our assets and target assets; |
| | changes in commodity prices; |
| | effects of hedging instruments on our assets; |
| | rates of default or decreased recovery rates on our assets; |
| | the degree to which our hedging strategies may or may not protect us from interest rate volatility; |
| | impact of and changes in accounting guidance and similar matters; |
- 3 -
Table of Contents
| | our ability to maintain our qualification, as a real estate investment trust for U.S. federal income tax purposes (a REIT); |
| | our ability to maintain our exception from registration under the Investment Company Act of 1940, as amended (the 1940 Act); |
| | availability of qualified personnel; |
| | estimates relating to our ability to make distributions to our stockholders in the future; and |
| | our understanding of our competition. |
Forward-looking statements are based on beliefs, assumptions and expectations as of the date of this Form 10-K. Any forward-looking statement speaks only as of the date on which it is made. New risks and uncertainties arise over time, and it is not possible for us to predict those events or how they may affect us. Except as required by law, we are not obligated to, and do not intend to, update or revise any forward-looking statements after the date of this Form 10-K, whether as a result of new information, future events or otherwise.
The risks included here are not exhaustive. Other sections of this Form 10-K may include additional factors that could adversely affect our business and financial performance. Moreover, we operate in a very competitive and rapidly changing environment. New risk factors emerge from time to time and it is not possible for management to predict all such risk factors, nor can it assess the impact of all such risk factors on our business or the extent to which any factor, or combination of factors, may cause actual results to differ materially from those contained in any forward-looking statements. Given these risks and uncertainties, investors should not place undue reliance on forward-looking statements as a prediction of actual results.
- 4 -
Table of Contents
In this Form 10-K, unless specifically stated otherwise or the context otherwise indicates, references to we, our, us and our company refer to Hannon Armstrong Sustainable Infrastructure Capital, Inc., a Maryland corporation, Hannon Armstrong Sustainable Infrastructure, L.P., and any of our other subsidiaries. Hannon Armstrong Sustainable Infrastructure, L.P. is a Delaware limited partnership of which we are the sole general partner and to which we refer in this Form 10-K as our Operating Partnership.
Hannon Armstrong Capital, LLC, a Maryland limited liability company, the entity that operated our historical business prior to the consummation of our initial public offering on April 23, 2013 (our IPO) and which we refer to as the Predecessor, became our subsidiary upon consummation of our IPO. To the extent any of the financial data included in this Form 10-K is as of a date or from a period prior to the consummation of our IPO, such financial data is that of the Predecessor. The financial data for the Predecessor for such periods do not reflect the material changes to the business as a result of the capital raised in the IPO including the broadened types of projects undertaken, the enhanced financial structuring flexibility and the ability to retain a larger share of the economics from the origination activities. Accordingly, the financial data for the Predecessor is not necessarily indicative of our companys results of operations, cash flows or financial position following the completion of the IPO.
| Item 1. | Business. |
GENERAL
We provide debt and equity financing to the energy efficiency and renewable energy markets. We focus on providing preferred or senior level capital to established sponsors and high credit quality obligors for assets that generate long-term, recurring and predictable cash flows.
We are internally managed and our management team has extensive industry knowledge and experience having completed its first renewable energy financing over 25 years ago and its first energy efficiency financing over 15 years ago. We have deep and long-standing relationships in the markets we target with leading energy service providers, manufacturers, project developers and owners. We originate many of our transactions through programmatic finance relationships with global energy service companies (ESCOs), such as Honeywell International, Ingersoll Rand, Johnson Controls, Schneider Electric, Siemens and United Technologies. We also originate transactions with renewable energy manufacturers, developers and operators such as EDF Renewable Energy, EDP Renewables, E.ON, First Solar, Invenergy, SunPower and other companies who own and operate renewable energy projects, including a number of U.S. utility companies. Additionally, we rely on relationships with a variety of key financial participants, including institutional investors, private equity funds, senior lenders, and investment and commercial banks, as well as leading intermediaries, to complement our origination and financing activities. We believe we are the leading provider of financing for energy efficiency projects for the U.S. federal government, the largest property owner and energy user in the United States.
We focus our investment activities primarily on:
| | Energy Efficiency Projects: projects, typically undertaken by ESCOs, which reduce a buildings or facilitys energy usage or cost by improving or installing various building components, including heating, ventilation and air conditioning systems (HVAC systems), lighting, energy controls, roofs, windows, building shells, and/or combined heat and power systems; and |
| | Renewable Energy Projects: projects that deploy cleaner energy sources, such as solar and wind to generate power production. |
We may also provide financing solutions for other projects, such as water or communications infrastructure, that improve water or energy efficiency, increase energy system resiliency, positively impact the environment or more efficiently use natural resources.
- 5 -
Table of Contents
Our goal is to deliver attractive risk-adjusted returns to our stockholders by investing in projects that generate long-term, recurring and predictable cash flows or cost savings. The cash flows or cost savings are generally generated from proven technologies that minimize performance uncertainty, enabling us to more accurately predict project cash flow over the term of the financing or investment. We provide capital through debt financings and a variety of preferred and common equity structures with a preference for structures in which we hold a senior or preferred position in the capital structure.
We completed approximately $935 million of transactions during 2015, compared to approximately $875 million during 2014. Our strategy includes holding a large portion of these transactions on our balance sheet. As of December 31, 2015, we held approximately $1.3 billion of our assets on our balance sheet, including approximately 75% of our 2015 transactions. We refer to the transactions we hold on our balance sheet as of a given date as our Portfolio.
We also originate transactions for securitization trusts or similar vehicles that we manage or service in which institutional investors purchase all or a portion of the economics of the transaction and where we receive upfront revenues and in some cases, ongoing fees for managing the assets. As of December 31, 2015, we managed approximately $1.8 billion in these trusts or vehicles that are not consolidated on our balance sheet. When combined with our Portfolio, as of December 31, 2015, we manage approximately $3.2 billion of assets which we refer to as our managed assets.
We have raised net proceeds of approximately $470 million including $181 million in two follow on public offerings completed in 2015. Since April 2013, we have also completed approximately $610 million of nonrecourse borrowings and have a credit facility with maximum capacity of $500 million. In 2015, we completed approximately $395 million of nonrecourse borrowings and had a $50 million increase in available capacity under our credit facility.
As of December 31, 2015, approximately 64% of our Portfolio consisted of loans, financing receivables, direct financing leases or debt securities with 59% structured with fixed rates and 5% structured with floating rates. Approximately 12% of our Portfolio was real estate with long-term leases and approximately 24% represented equity ownership of wind projects. Excluding our equity investments, approximately 45% of our Portfolio consisted of U.S. federal government or state or local government obligors, approximately 54% consisted of investment grade commercial obligations and 1% consisted of non-investment grade rated commercial obligations, in all cases rated either by an independent third party rating service or our internal credit rating system. Our Portfolio consisted of over 105 transactions and the weighted average remaining life of our Portfolio as of December 31, 2015 (excluding match-funded transactions) was approximately ten years.
We have a large and active pipeline of potential new opportunities that are in various stages of our underwriting process. We refer to potential opportunities as being part of our pipeline if we have determined that the project fits within our investment strategy and exhibits the appropriate risk/reward characteristics through an initial credit analysis, including a quantitative and qualitative assessment of the opportunity, as well as research on the market and sponsor. Our pipeline of transactions that could potentially close in the next 12 months
- 6 -
Table of Contents
consists of opportunities in which we will be the lead originator, as well as projects in which we may participate with other institutional investors. As of December 31, 2015, our pipeline consisted of more than $2.5 billion in new debt and equity opportunities. There can, however, be no assurance that any or all of the transactions in our pipeline will be completed.
We elected to be, and intend to continue to operate our business so as to qualify to be taxed as a REIT for U.S. federal income tax purposes, commencing with our taxable year ended December 31, 2013. We also intend to continue to operate our business in a manner that will permit us to maintain our exception from registration as an investment company under the 1940 Act.
INVESTMENT STRATEGY
We provide a range of equity and financing solutions to the energy efficiency and renewable energy market. Our goal is to invest in assets that generate long-term, recurring and predictable cash flows or cost savings that will be more than adequate to deliver attractive risk-adjusted returns to our stockholders.
We utilize a variety of investment structures, which may include:
| | Financing Receivables, such as project loans, receivables and direct financing leases, |
| | Debt and equity securities, |
| | Real Estate, such as land or other physical assets and related intangible assets used in sustainable infrastructure projects, and |
| | Equity Investments in unconsolidated affiliates, such as projects where we hold a non-consolidated equity interest in a project. |
Our financings typically benefit from contractually committed obligations of government entities or private, high credit quality obligors. The cash flows or cost savings are generally produced from proven technologies that minimize performance uncertainty, enabling us to more accurately predict project cash flows over the term of the financing or investment.
We provide debt and equity financing for energy efficiency projects, which reduce the amount or cost of energy usage. We often work with ESCOs who achieve these savings by improving or installing various building components, including HVAC systems, lighting, energy controls, roofs, windows, building shells, and/or combined heat and power systems. We are assigned the payment stream and other contractual rights, often using our pre-existing master purchase agreements with the ESCOs. Our financings are generally also secured by the installed improvements.
We also provide debt and equity financing, or own the land used, for projects that deploy renewable energy sources such as solar or wind. We focus on financing renewable energy projects that use proven technology and that often have contractually committed agreements, such as power purchase agreements (PPAs), with high credit quality utilities or large electricity users under which the utility or user purchases the power produced by the project at a minimum price with potential price escalators for a portion of the projects estimated life. These projects are building or facility specific and may be combined with other energy efficiency projects or are standalone projects designed to sell power to electric utilities or large users.
We began leasing real property to renewable projects in May 2014, when we acquired all of the outstanding member interests in American Wind Capital Company, LLC (AWCC) for approximately $107 million. Through this acquisition and a series of follow on transactions, we own more than 14,000 acres of land that are under long-term lease agreements with over 25 solar projects, which we have recorded in our financial statements as real estate, and rights to payments from land leases for a diversified portfolio of over 50 wind projects, which we have recorded in our financial statements as financing receivables. For further information on our real estate transactions, see Note 1 of the audited financial statements in this Form 10-K.
- 7 -
Table of Contents
We have made several investments in wind projects through limited liability entities to purchase and hold interests in wind projects operated by various wind energy companies. These transactions enable us to participate in the priority cash flows associated with these wind projects. For further information on these transactions, see Notes 1 and 13 of the audited financial statements in this Form 10-K.
We may also provide financing for other sustainable infrastructure projects, such as water or communications infrastructure, that improve water or energy efficiency, increase energy system resiliency, positively impact the environment or more efficiently use natural resources.
We seek to manage the diversity of our Portfolio by, among other factors, project type, project operator, type of investment, type of technology, transaction size, geography, obligor and maturity. Our target mix of our Portfolio is expected over time to range from approximately 25% to 45% energy efficiency projects, 45% to 70% renewable energy projects such as wind and solar projects and 5% to 10% other sustainable infrastructure projects. As of December 31, 2015, approximately 31% of our Portfolio was invested in energy efficiency projects; approximately 37% was invested in wind projects; approximately 30% was invested in solar projects and the remaining 2% was invested in other sustainable infrastructure projects.
Our target mix of our Portfolio is expected over time to range from 55% to 75% debt financings and 25% to 45% land and equity financings. We will not invest more than 15% of our assets in any individual project without the consent of a majority of our independent directors. We will adjust the mix and duration of our assets over time in order to allow us to manage various aspects of our portfolio, including expected risk-adjusted returns, macroeconomic conditions, liquidity, availability of adequate financing for our assets, and to maintain our REIT qualification and our exception from registration as an investment company under the 1940 Act.
We believe that our long history of energy efficiency and renewable energy investing, the experience, expertise and relationships of our management team, the anticipated credit strength of the obligors of our financings and the size and growth potential of our market, position us well to capitalize on our strategy and provide attractive risk-adjusted returns to our stockholders over the long term, through both distributions and capital appreciation.
FINANCING STRATEGY
We use borrowings as part of our financing strategy to increase potential returns to our stockholders and have available to us a broad range of financing sources. In July 2013, we entered into a $350 million senior secured revolving credit facility with maximum total advances of $700 million. Since that time, we have entered into a number of amendments intended to increase the flexibility and borrowing capability under the credit facility and to extend the maturity date. As of December 31, 2015, the facility had been increased to $500 million with maximum total advances of $1.5 billion and the facility had been extended an additional year maturing in July 2019.
In addition, we have completed approximately $610 million of nonrecourse borrowings since April 2013, including approximately $395 million in 2015. We believe that our 2013 financing was one of the first asset-backed securitizations that provided details on the greenhouse gas (GHG) emissions saved by the technologies that secured the financing. We refer to the bonds issued as part of these financing transactions as HASI Sustainable Yield Bonds or (HASI SYBs). We believe that investors will increasingly be interested in debt investments that have a measurable GHG savings.
Prior to our IPO, we financed our business primarily through fixed rate nonrecourse debt where the debt was match-funded with corresponding fixed rate yielding assets and through the use of non-consolidated securitizations. In our securitization transactions, we transfer the loans or other assets we originate to securitization trusts or other bankruptcy remote special purpose funding vehicles. Large institutional investors, primarily insurance companies and commercial banks, have provided the financing needed for these assets by purchasing the notes issued by the funding vehicle.
- 8 -
Table of Contents
We continue to use these funding sources and, as of December 31, 2015, had outstanding approximately $101 million of this match funded debt, all of which was consolidated on our balance sheet. As of December 31, 2015, the outstanding principal balance of our assets financed through the use of securitizations which are not consolidated on our balance sheet was approximately $1.8 billion. For further information on the credit facility, asset backed nonrecourse notes, and our nonrecourse match funded debt, see Note 7 and Note 8 of our audited financial statements included in this Form 10-K.
We plan to use other fixed and floating rate borrowings in the form of additional bank credit facilities (including term loans and revolving facilities), warehouse facilities, repurchase agreements and public and private equity and debt issuances, including match funded arrangements, as a means of financing our business. We also expect to use both on-balance sheet and non-consolidated securitizations and also believe we will be able to customize securitized tranches to meet investment preferences of different investors. We may also consider the use of separately funded special purpose entities or funds to allow us to expand the investments that we make.
The decision on how we finance specific assets or groups of assets is largely driven by capital allocations and risk and portfolio management considerations, as well as the overall interest rate environment, prevailing credit spreads and the terms of available financing and market conditions. Over time, as market conditions change, we may use other forms of leverage in addition to these financings arrangements.
Although we are not restricted by any regulatory requirements to maintain our leverage ratio at or below any particular level, the amount of leverage we may deploy for particular assets will depend upon the availability of particular types of financing and our assessment of the credit, liquidity, price volatility and other risks of those assets, the interest rate environment and the credit quality of our financing counterparties. In March 2015, we increased our leverage target to 2.5 to 1 from less than 2.0 to 1. Our debt to equity ratio was approximately 2.1 to 1 as of December 31, 2015. We also have increased the percentage of fixed rate debt from zero at the IPO to approximately 71% as of December 31, 2015, or slightly above our targeted fixed rate debt percentage range of approximately 50% to 70%. In order to simplify these calculations, we have begun to use, in February 2016, the total debt on our balance sheet, including our credit facility, nonrecourse securitization debt and other nonrecourse match funded debt. Historically, we excluded the other nonrecourse match funded debt, which as of December 31, 2015, was $101 million, and if such debt would have been excluded, the debt to equity ratio would have been 1.9 to 1 and the fixed rate debt percentage was 68%. We continue to calculate both of these ratios exclusive of securitizations that are not consolidated on our balance sheet (where the collateral is typically borrowings with U.S. government obligors) and for the purposes of the fixed rate debt target, we include as fixed rate debt, the present notional value hedged by interest rate swaps.
We intend to use leverage for the primary purpose of financing our portfolio and business activities and not for the purpose of speculating on changes in interest rates. While we may temporarily exceed the leverage target, if our board of directors approves a material change to our leverage target, we anticipate advising our stockholders of this change through disclosure in our periodic reports and other filings under the Exchange Act.
CORPORATE GOVERNANCE
We have structured our corporate governance in a manner we believe closely aligns our interests with those of our stockholders. Notable features of our corporate governance structure include the following:
| | our board of directors is not staggered, with each of our directors subject to re-election annually; |
| | our board of directors has determined that five of our six directors are independent for purposes of the New York Stock Exchange (NYSE) corporate governance listing standards and Rule 10A-3 under the Exchange Act; |
- 9 -
Table of Contents
| | two of our directors qualify as an audit committee financial expert as defined by the Securities and Exchange Commission (the SEC); |
| | we have opted out of the control share acquisition statute in the Maryland General Corporations Law (the MGCL) and have exempted from the business combinations statute in the MGCL transactions that are approved by our board of directors; and |
| | we do not have a stockholder rights plan. |
In order to foster the highest standards of ethics and conduct in all business relationships, we have adopted a Code of Business Conduct and Ethics policy. This policy, which covers a wide range of business practices and procedures, applies to our officers, directors, employees and independent contractors. In addition, we have implemented Whistleblowing Procedures for Accounting and Auditing Matters (the Whistleblower Policy) that sets forth procedures by which any Covered Persons (as defined in the Whistleblower Policy) may raise, on a confidential basis, concerns regarding, among other things, any questionable or unethical accounting, internal accounting controls or auditing matters and any potential violations of the Code of Business Conduct and Ethics with our Audit Committee or our General Counsel.
We have adopted a Statement of Corporate Policy Regarding Equity Transactions that governs the process to be followed in the purchase or sale of our securities by any of our directors, officers, employees and consultants and prohibits any such persons from buying or selling our securities on the basis of material nonpublic information.
Our business is managed by our senior management team, subject to the supervision and oversight of our board of directors. Our directors stay informed about our business by attending meetings of our board of directors and its committees and through supplemental reports and communications. Our independent directors, led by the lead independent director, meet regularly in executive sessions without the presence of our officers.
COMPETITION
We compete against a number of parties, including other specialty finance companies, banks, private equity, hedge or infrastructure investment funds, insurance companies, mutual funds, institutional investors, investment banking firms, financial institutions, utilities, independent power producers, project developers, pension funds, governmental bodies, public entities established to own infrastructure assets and other entities. We compete primarily on the basis of service, price, structure and flexibility as well as the breadth and depth of our expertise. We may at times compete, and at other times partner or work as a participant, with alternative financing sources.
We also encounter competition in the form of potential customers or our origination partners electing to use their own capital rather than engaging an outside financing provider. In addition, we may also face competition based on technological developments that reduce demand for electricity, increase power supplies through existing infrastructure or that otherwise compete with our sustainable infrastructure projects.
Some of our competitors are significantly larger, have greater access to capital and other resources or enjoy other advantages in comparison to us. In addition, some of our competitors may have higher risk tolerances or different risk assessments, which could allow them to consider a wider variety of opportunities and establish more relationships than we can. These competitors may not be subject to the same regulatory constraints (such as REIT compliance or the need to maintain an exemption from registration as an investment company under the 1940 Act) that we face.
We believe that a significant part of our competitive advantage is our management teams experience and industry expertise, and that the markets for investment opportunities in the areas that we focus on are underserved by traditional commercial banks and other financial sources. However, we may not be able to
- 10 -
Table of Contents
achieve our business goals or expectations due to the competitive risks that we face. An increase in competition among competing providers of financing could adversely affect the availability and cost of financing, and thereby adversely affect the market price of our common stock. For additional information concerning these competitive risks, see Risk FactorsWe operate in a competitive market and future competition may impact the terms of the financing we offer.
EMPLOYEES; STAFFING
As of December 31, 2015, we employed 32 people. We intend to hire additional business professionals as needed to assist in the implementation of our business strategy.
OUR EXECUTIVE OFFICERS
Our executive officers and other significant employees and their ages are as follows:
Jeffrey W. Eckel, 57, is one of our directors and was with the Predecessor as president and chief executive officer since 2000 and prior to that from 1985 to 1989 as a senior vice president. He serves as our president, chief executive officer, and chairman of our board of directors. He previously held senior executive positions such as chief executive officer of EnergyWorks, LLC and Wärtsilä Power Development. Mr. Eckel is a member of the board of directors of HA EnergySource Holdings LLC (HA EnergySource). In 2014, he was elected to the board of directors of the Alliance To Save Energy. He also was appointed by the governor of Maryland to the board of the Maryland Clean Energy Center in 2011 and served as its chairman from 2012 to 2014. He has served as a member of the Johns Hopkins Environmental, Energy, Sustainability and Health Institutes advisory council since 2013. Mr. Eckel has over 30 years of experience in financing, owning and operating infrastructure and energy assets. Mr. Eckel received a Bachelor of Arts degree from Miami University in 1980 and a Master of Public Administration degree from Syracuse University, Maxwell School of Citizenship and Public Affairs, in 1981. He holds Series 24, 63 and 79 securities licenses. We believe Mr. Eckels extensive experience in managing companies operating in the energy sector and expertise in financing energy assets make him qualified to serve as our president and chief executive officer and as chairman of our board of directors.
J. Brendan Herron, 55, has served in a variety of roles at the Predecessor and its affiliates from 1994 to 2005, has been a senior vice president from 2011 to 2013 and serves as an executive vice president and our chief financial officer. Mr. Herron has over 20 years of experience in structuring, executing and operating infrastructure and technology investments. From 2006 to 2011, Mr. Herron was the vice president of Corporate Development & Strategy for Current Group, LLC, a provider of smart grid technology to electric utilities. He formerly served on the U.S. Commerce Secretarys Renewable Energy and Energy Efficiency Advisory Committee and is presently a member of the Board of Trustees of Calvert Hall College High School (Baltimore, MD). Mr. Herron received a Bachelor of Science degree in accounting and computer science from Loyola University Maryland in 1982 and a Master of Business Administration degree from Loyola University Maryland in 1987 and has passed the CPA and CMA examinations. We believe Mr. Herrons financial background, extensive experience in infrastructure and technology investments and expertise in energy infrastructure make him qualified to serve as our chief financial officer.
Steven L. Chuslo, 58, has been with the Predecessor as general counsel since 2008 and serves in that role and as an executive vice president. Mr. Chuslo is responsible for all internal governance matters and is actively involved in structuring, developing, negotiating and closing transactions. He has more than 25 years of experience in the fields of securities, commercial finance and energy development, U.S. federal regulation and project finance. From 2006 to 2008, Mr. Chuslo was the senior legal and finance advisor to the Assistant Secretary of the U.S. Department of Energy Office of Energy Efficiency and Renewable Energy. Prior to this, he worked as a legal consultant to the office of the general counsel for AOL, Inc. from 2004 to 2006. He was
- 11 -
Table of Contents
General Counsel to EnergyWorks, LLC, from 1996 to 2001. Mr. Chuslo was an associate attorney for Chadbourne & Parke, LLP from 1994 to 1995, practicing in the power project finance group and earlier with Davis Polk & Wardwell LLP from 1990 to 1994, practicing in the corporate finance group. Mr. Chuslo received a Bachelor of Arts degree in History from the University of Massachusetts/Amherst in 1982 and a Juris Doctorate from the Georgetown University Law Center in 1990.
Nathaniel J. Rose, CFA, 38, has been with the Predecessor since 2000, in a variety of roles, most recently as a senior vice president since 2007, and has served us as an executive vice president and chief operating officer since 2015. He has been involved with a vast majority of our transactions since 2000. He earned a joint Bachelor of Science and Bachelor of Arts degree from the University of Richmond in 2000, a Master of Business Administration degree from the Darden School of Business Administration at the University of Virginia in 2009, is a Chartered Financial Analyst, or CFA, charter holder and has passed the CPA examination. He holds a Series 63 and 79 securities licenses.
Daniel K. McMahon, CFA, 44, has been with the Predecessor since 2000 in a variety of roles, most recently as a senior vice president since 2007 and has served us as an executive vice president since 2015. Mr. McMahon responsibilities include originating and executing transactions with our government and institutional customers and sourcing capital markets transactions. He has played a role in analyzing, negotiating and structuring several billion dollars of transactions. Mr. McMahon previously worked with T. Rowe Price from 1997 to 2000. Mr. McMahon received his Bachelor of Arts degree from the University of California, San Diego in 1993, and is a CFA charter holder. He holds Series 24, 63 and 79 securities licenses.
M. Rhem Wooten Jr., 56, has been with the Predecessor as a managing director since October 2010 and serves as an executive vice president. Mr. Wooten has worked in the energy industry for more than 30 years, and has extensive experience in project development, commodity trading/risk management and project finance. Mr. Wooten previously held a number of senior management positions, including serving as President of Duke Energy Corporations domestic and international independent power production affiliates from 1988 to 1996, as Managing Director, origination and operations of Duke/Louis Dreyfus from 1996-1997, chief executive officer of Merchant Energy Group of the Americas (MEGA) from 1997 to 2000, as president and chief executive officer of Pradium, Inc. from 2000 to 2001 and as president of Allied Syngas Corporation from 2004 to 2010. Mr. Wooten received a Bachelor of Science degree in Business Administration from the University of North Carolina-Chapel Hill in 1981. He holds Series 63 and 79 securities licenses.
AVAILABLE INFORMATION
We maintain a website at www.hannonarmstrong.com. Information on our website is not incorporated by reference in this Form 10-K. We will make available, free of charge, on our website (a) our Form 10-K, quarterly reports on Form 10-Q and current reports on Form 8-K (including any amendments thereto), proxy statements and other information (collectively, Company Documents) filed with, or furnished to, the Securities and Exchange Commission (the SEC), as soon as reasonably practicable after such documents are so filed or furnished, (b) Corporate Governance Guidelines, (c) director independence standards, (d) Code of Business Conduct and Ethics policy and (e) written charters of the Audit Committee, Compensation Committee and Nominating and Corporate Governance Committee of our board of directors. Company Documents filed with, or furnished to, the SEC are also available for review and copying by the public at the SECs Public Reference Room at 100 F Street, NE., Washington, DC 20549 and at the SECs website at www.sec.gov. Information regarding the operation of the Public Reference Room may be obtained by calling the SEC at 1-800-SEC-0330. We provide copies of our Corporate Governance Guidelines and Code of Business Conduct and Ethics policy, free of charge, to stockholders who request such documents. Requests should be directed to Investor Relations, 1906 Towne Centre Blvd, Suite 370, Annapolis, Maryland 21401, (410) 571-9860.
- 12 -
Table of Contents
| Item 1A. | Risk Factors. |
Our business and operations are subject to a number of risks and uncertainties, the occurrence of which could adversely affect our business, financial condition, consolidated results of operations and ability to make distributions to stockholders and could cause the value of our capital stock to decline. We may refer to the energy efficiency, renewable energy and the other sustainable infrastructure projects or market collectively as the sustainable infrastructure projects or industry. Please also refer to the section entitled Forward-Looking Statements.
Risks Related to Our Business and Our Industry
Our business depends in part on U.S. federal, state and local government policies and a decline in the level of government support could harm our business.
The projects in which we invest typically depend in part on various U.S. federal, state or local governmental policies and incentives that support or enhance project economic feasibility. Such policies may include governmental initiatives, laws and regulations designed to reduce energy usage, encourage the use of renewable energy or encourage the investment in and the use of sustainable infrastructure. Incentives provided by the U.S. federal government may include tax credits (with some of these tax credits that are related to renewable energy scheduled to be reduced in the future), tax deductions, bonus depreciation as well as federal grants and loan guarantees. Incentives provided by state and local governments may include renewable portfolio standards, which specify the portion of the power utilized by local utilities that must be derived from renewable energy sources such as renewable energy as well as the state or local government sponsored programs where the financing of energy efficiency or renewable energy projects is repaid through an assessment in the property tax bill in a program commonly referred to as property assessed clean energy (PACE). Additionally, certain states have implemented feed-in tariffs, pursuant to which electricity generated from renewable energy sources is purchased at a higher rate than prevailing wholesale rates. Other incentives include tariffs, tax incentives and other cash and non-cash payments. In addition, U.S. federal, state and local governments provide regulatory, tax and other incentives to encourage the development and growth of sustainable infrastructure.
Governmental agencies, commercial entities and developers of sustainable infrastructure projects frequently depend on these policies and incentives to help defray the costs associated with, and to finance, various projects. Government regulations also impact the terms of third party financing provided to support these projects. If any of these government policies, incentives or regulations are adversely amended, delayed, eliminated, reduced or not extended beyond their current expiration dates, the demand for, and the returns available from, the financing we provide may decline, which could harm our business. Changes in government policies, support and incentives, including retroactive changes, could also negatively impact the operating results of the projects we finance and the returns on our assets.
U.S. federal, state and local government entities are major participants in the sustainable infrastructure industry and their actions could be adverse to our projects or our company.
The projects where we invest are, and will continue to be, subject to substantial regulation by U.S. federal, state and local governmental agencies. For example, many projects require government permits, licenses, concessions, leases or contracts. Government entities, due to the wide-ranging scope of their authority, have significant leverage in setting their contractual and regulatory relationships with third parties. In addition, government permits, licenses, concessions, leases and contracts are generally very complex, which may result in periods of non-compliance, or disputes over interpretation or enforceability. If the projects where we invest fail to obtain or comply with applicable regulations, permits or contractual obligations, they could be prevented from being constructed or subjected to monetary penalties or loss of operational rights, which could negatively impact project operating results and the returns on our assets.
Contracts with government counterparties that support the projects where we invest may be more favorable to the government counterparties compared to commercial contracts with private parties. For example, a lease,
- 13 -
Table of Contents
concession or general service contract may enable the government to modify or terminate the contract without requiring the payment of adequate compensation. Typically, our contracts with government counterparties contain termination provisions including prepayment amounts. In most cases, the prepayment amounts provide us with amounts sufficient to repay the financing we have provided, but may be less than amounts that would be payable under make whole provisions customarily found in commercial lending arrangements.
In addition, government counterparties also may have the discretion to change or increase regulation of project operations, or implement laws or regulations affecting project operations, separate from any contractual rights they may have. These actions could adversely impact the efficient and profitable operation of the projects in which we invest.
Government entities may also suspend or debar contractors from doing business with the government or pursue various criminal or civil remedies under various government contract regulations. They may also issue new government contracts or fail to extend existing government contracts. Our ability to originate new assets could be adversely affected if one or more of the ESCOs with whom we have relationships with are so suspended or debarred or fail to win new, or renew existing, contracts.
Changes in the terms of energy savings performance contracts could have a material and adverse impact on our business.
We derive a significant amount of our income from the assignment to us of payment streams under energy savings performance contracts with property owners, including government customers, in which the scope and cost of improvements and services are specified. While U.S. federal, state and local government rules governing such contracts vary, such rules may, for example, permit the funding of such contracts through long-term financing arrangements, permit long-term payback periods from the savings realized through such contracts, allow units of government to exclude debt related to such contracts from the calculation of their statutory debt limitation, allow for award of contracts on a best value instead of lowest cost basis and allow for the use of sole source providers. To the extent these rules become more restrictive in the future, our ability to provide financing to support these projects could be adversely impacted, which could harm our business. Changes in these rules, including retroactive changes, could also negatively impact the operating results of the projects we finance and the returns on our assets.
A change in the fiscal health, level of appropriations or budgets of U.S. federal, state and local governments could reduce demand for our financing solutions.
Although our energy efficiency assets do not normally require direct governmental appropriations and instead the resulting cash flow is generally paid for out of general operating and maintenance appropriations based on the energy and operating savings derived from the improved facility, a significant decline in the fiscal health, level of appropriations or budgets of government customers may make it difficult or undesirable for them to make existing payments or to enter into new energy efficiency improvement projects. This could have a material and adverse effect on the repayment of our financings or the return on our asset for existing projects and on our ability to originate new assets. Moreover, other changes in resources available to governments may also impact their willingness to undertake energy efficiency projects. For example, an increase in money set aside for government expenditures for energy efficiency projects may reduce demand for our financing.
In addition, to the extent we provide financing solutions that involve direct appropriations funding, we will depend on approval of the necessary spending for the projects. The repayment of the financing, or the return on our asset, could be adversely affected if appropriations for any such projects are delayed or terminated.
- 14 -
Table of Contents
Because our business depends to a significant extent upon relationships with key industry players, our inability to maintain or develop these relationships, or the failure of these relationships to generate business opportunities, could adversely affect our business.
We will rely to a significant extent on our relationships with key industry players in the markets we target. We originate transactions through programmatic finance relationships with various parties, including global ESCOs. We also originate transactions with renewable energy manufacturers, developers and operators such as EDF Renewable Energy, EDP Renewables, E.ON, First Solar, Invenergy, SunPower and other companies who own and operate renewable energy projects, including a number of U.S. utility companies. In addition to the net proceeds from past and future offerings, we have traditionally financed our business by accessing the securitization or syndication market, primarily utilizing our relationships with insurance companies and commercial banks. We also rely on relationships with a variety of key financial participants, including institutional investors, private equity funds, senior lenders, and investment and commercial banks, as well as leading intermediaries, to complement our origination and financing activities. Our inability to maintain or develop these relationships, or the failure of these relationships to generate business opportunities, could adversely affect our business. In addition, individuals and entities with whom we have relationships are not obligated to provide us with business opportunities, and, therefore, there is no assurance that such relationships will generate business opportunities for us.
If the cost of energy generated by traditional sources of energy continues to stay at present levels or declines, demand for the projects in which we invest may decline.
Many traditional sources of energy such as coal, petroleum based fuels and natural gas are highly influenced by the price of underlying or substitute commodities. While we believe the potential for rising or increasingly volatile commodity prices and inflation will spur investment in our industry, there have been, and may continue to be, decreases in such prices which may reduce the demand for energy efficiency projects or other projects, including renewable energy facilities, that do not rely on traditional energy sources. For example, we believe the current low prices in natural gas may reduce the demand for other projects like renewable energy that are a substitute for natural gas. Additionally, low natural gas prices can adversely affect both the price available to renewable energy projects under future power sale agreements and the price of the electricity the projects sell on either a forward or a spot-market basis. Technological progress in electricity generation, storage or in the production of traditional fuels or the discovery of large new deposits of traditional fuels could reduce the cost of energy generated from those sources and consequently reduce the demand for the types of projects in which we invest, which could harm our new business origination prospects. In addition, volatility in commodity prices, including energy prices, may cause building owners and other parties to be reluctant to commit to projects for which repayment is based upon a fixed monetary value for energy savings that would not decline if the price of energy declines. Any resulting decline in demand for our financing solutions or the price that industry participants receive for the sale of their products could adversely impact our operating results.
If the market for various types of sustainable infrastructure projects or the investment techniques related to such projects do not develop as we anticipate, new business generation in this target area would be adversely impacted.
The market for various types of sustainable infrastructure projects such as renewable energy projects and commercial office building energy efficiency projects are emerging and rapidly evolving, leaving their future success uncertain. Similarly, various investing techniques, such as leasing land for renewable energy projects, purchasing interest in existing renewable energy projects, the use of PACE financing and the use of taxable debt for state and local energy efficiency financings are emerging and the future success of these investing techniques is also uncertain. If some or all of these market segments or investing techniques prove unsuitable for widespread commercial deployment or if demand for such projects or techniques fail to grow sufficiently, the demand for our capital and financing solutions may decline or develop more slowly than we anticipate. Many factors will influence the widespread adoption and demand for such projects and investing techniques, including general and
- 15 -
Table of Contents
local economic conditions, commodity prices of traditional energy sources, the availability of cost-effective energy storage, the cost-effectiveness of such projects and techniques, performance and reliability of such technologies compared to conventional power sources and technologies, the extent of government subsidies to support sustainable infrastructure and regulatory developments in the power and natural resource industries. In addition, renewable energy projects rely on electric and other types of transmission lines, pipelines and facilities owned and operated by third parties to obtain their inputs or distribute their output. Any substantial access barriers to these lines and facilities could make projects that depend on them more expensive, which could adversely impact the demand or financial performance for such projects and our financing solutions.
Existing electric utility industry regulations, and changes to regulations, may present technical, regulatory and economic barriers to the purchase and use of renewable energy and energy efficiency systems that may significantly reduce demand for systems in which we can invest.
Federal, state and local government regulations and policies concerning the electric utility industry, and internal policies and regulations promulgated by electric utilities, heavily influence the market for electricity products and services. These regulations and policies often relate to electricity pricing and the interconnection of customer-owned electricity generation. In the United States, governments and utilities continuously modify these regulations and policies. These regulations and policies could deter customers from purchasing energy efficiency and renewable energy systems. This could result in a significant reduction in the potential demand for such systems. For example, utilities commonly charge fees to larger, industrial customers for disconnecting from the electric grid or for having the capacity to use power from the electric grid for back-up purposes. In addition, there is an increasing trend towards initiating or increasing fixed fees for users to have electricity service from a utility. These fees could increase our customers cost to use renewable energy and energy efficiency systems not supplied by the utility and make them less desirable, thereby harming our business, prospects, financial condition and results of operations. In addition, any changes to government or internal utility regulations and policies that favor electric utilities could reduce competitiveness and cause a significant reduction in demand for systems in which we invest.
Some projects in which we invest rely on net metering and related policies to improve project economics which if reduced could impact repayment of our financings or the return on our assets.
Many states have a regulatory policy known as net energy metering, or net metering. Net metering typically allows some project customers to interconnect their on-site solar or other renewable energy systems to the utility grid and offset their utility electricity purchases by receiving a bill credit at the utilitys retail rate for the amount of energy in excess of their electric usage that is generated by their renewable energy system and is exported to the grid. At the end of the billing period, the customer simply pays for the net energy used or receives a credit at the retail rate if more energy is produced than consumed. Net metering policies are under review in a number of states and have been recently reduced in Nevada. The ability and willingness of customers to pay for renewable energy systems which benefit from net metering rules may be reduced if net metering rules are eliminated or their benefits reduced, which may also impact our returns on such systems.
Sustainable infrastructure projects that involve the generation, transmission or sale of electricity such as renewable energy projects may be subject to regulation by the Federal Energy Regulatory Commission under the Federal Power Act or other regulations that regulate the sale of electricity, which may adversely affect the profitability of such projects.
Sustainable infrastructure projects that involve the generation, transmission or sale of electricity such as renewable energy projects may be qualifying facilities that are exempt from regulation as public utilities by the Federal Energy Regulatory Commission, (the FERC) under the Federal Power Act, (the FPA) while certain other such projects may be subject to rate regulation by the FERC under the FPA. FERC regulations under the FPA confer upon these qualifying facilities key rights to interconnection with local utilities, and can entitle such facilities to enter into PPAs with local utilities, from which the qualifying facilities benefit. Changes to these U.S.
- 16 -
Table of Contents
federal laws and regulations could increase the regulatory burdens and costs, and could reduce the revenue of the project. In addition, modifications to the pricing policies of utilities could require sustainable infrastructure projects to achieve lower prices in order to compete with the price of electricity from the electric grid and may reduce the economic attractiveness of certain energy efficiency measures. To the extent that the projects in which we invest are subject to rate regulation, the project owners will be required to obtain FERC acceptance of their rate schedules for wholesale sales of energy, capacity and ancillary services. Any changes in the rates project owners are permitted to charge could impact the repayment of our financings, or the return on our assets.
In addition, the operation of, and electrical interconnection for, our sustainable infrastructure projects may be subject to U.S. federal, state or local interconnection and federal reliability standards, some of which are set forth in utility tariffs. These standards and tariffs specify rules, business practices and economic terms to which the projects where we invest are subject and which may impact on a projects ability to deliver the electricity it produces or transports to its end customer. The tariffs are drafted by the utilities and approved by the utilities state and U.S. federal regulatory commissions. These standards and tariffs change frequently and it is possible that future changes will increase our administrative burden or adversely affect the terms and conditions under which the projects render services to their customers.
In addition, under certain circumstances, we may also be subject to the reliability standards of the North American Electric Reliability Corporation. If project owners fail to comply with the mandatory reliability standards, they could be subject to sanctions, including substantial monetary penalties, which could also raise credit risks for, or lower the returns available from, the projects in which we invest.
These various regulations may also limit the transferability or sale of renewable energy projects and any such limits could negatively impact our returns from such projects.
Unfavorable publicity or public perception of the industries in which we operate could adversely impact our operating results and our reputation.
The sustainable infrastructure industry, including various forms of renewable energy receives significant media coverage that, whether or not directly related to our business or our projects, can adversely impact our reputation and the demand for our financing solutions. Similarly, negative publicity or public perception of the broader energy-related industries in which we operate, including through media coverage of environmental contamination and climate change concerns, could reduce demand for our financing solutions and our projects services. Any reduction in demand for sustainable infrastructure projects or for our financing solutions could damage our reputation or could have a material adverse effect on our results of operations and business prospects.
Future litigation or administrative proceedings could have a material and adverse effect on our business, financial condition and results of operations.
We may become involved in legal proceedings, administrative proceedings, claims and other litigation that arise in the ordinary course of business. In addition, we may be subject to legal proceedings or claims arising out of the projects in which we invest. Adverse outcomes or developments relating to these proceedings, such as judgments for monetary damages, injunctions or denial or revocation of permits, could have a material adverse effect on the projects in which we invest, which could adversely impact the repayment of or the returns available for our assets.
We operate in a competitive market and future competition may impact the terms of our financing solutions.
We compete against a number of parties who may provide alternatives to our investments including specialty finance companies, savings and loan associations, banks, private equity, hedge or infrastructure
- 17 -
Table of Contents
investment funds, insurance companies, mutual funds, institutional investors, investment banking firms, financial institutions, utilities, independent power producers, project developers, pension funds, governmental bodies, public entities established to own infrastructure assets and other entities. We also encounter competition in the form of potential customers or our origination partners electing to use their own capital rather than engaging an outside provider such as us. In addition, we may also face competition based on technological developments that reduce demand for electricity, increase power supplies through existing infrastructure or that otherwise compete with our sustainable infrastructure projects. Some of our competitors are significantly larger than we are, have access to greater capital and other resources than we do and may have other advantages over us. In addition, some of our competitors may have higher risk tolerances or different risk assessments, which could allow them to consider a wider variety of investments and establish more relationships than we can. In addition, many of our competitors are not subject to the operating constraints associated with REIT tax compliance or maintenance of an exception from the 1940 Act. These characteristics could allow our competitors to consider a wider variety of opportunities, establish more relationships and offer better pricing and more flexible structuring than we can offer. We may lose business opportunities if we do not match our competitors pricing, terms and structure. If we are forced to match our competitors pricing, terms and structure, we may not be able to achieve acceptable risk-adjusted returns on our assets or we may be forced to bear greater risks of loss. A portion of our competitive advantage stems from the fact that certain segments of the market opportunities in sustainable infrastructure projects are underserved by traditional commercial banks and other sources. A significant increase in the number and/or the size of our competitors in this market could force us to accept less attractive terms on our investments. As a result, competitive pressures we face could have a material adverse effect on our business, financial condition and results of operations.
Our business is affected by seasonal trends and construction cycles, and these trends and cycles could have an adverse effect on our operating results.
The volume and timing of our originations are subject to seasonal fluctuations and construction cycles, particularly in climates that experience colder weather during the winter months, such as the northern United States, or at educational institutions, where large projects are typically carried out during summer months when their facilities are unoccupied. In addition, government customers, many of which have fiscal years that do not coincide with ours, typically follow annual procurement cycles and appropriate funds on a fiscal-year basis even though contract performance may take more than one year. Further, government contracting cycles can be affected by the timing of, and delays in, the legislative process related to government programs and incentives that help drive demand for sustainable infrastructure projects. As a result of such fluctuations, we may occasionally experience fluctuations in the timing of new asset opportunities or declines in revenue or earnings as compared to the immediately preceding quarter, and comparisons of our operating results on a period-to-period basis may not be meaningful.
Risks Related to Our Assets and Projects In Which We Invest
Interest rate fluctuations and increases in interest rates could adversely affect the value of our assets which could result in reduced earnings or losses and negatively affect our profitability.
Interest rates are highly sensitive to many factors, including governmental monetary and tax policies, domestic and international economic and political considerations and other factors beyond our control. Many of our assets pay a fixed rate of interest or provide a fixed preferential return.
With respect to our business operations, increases in interest rates, in general, may over time cause: (1) project owners to be less interested in borrowing or raising equity and thus reduce the demand for our assets; (2) the interest expense associated with our borrowings to increase; (3) the value of our fixed rate or fixed return assets to decline; and (4) the value of our interest rate swap agreements to increase, to the extent we enter into such agreements as part of our hedging strategy. Conversely, decreases in interest rates, in general, may over time cause: (1) project owners to be more interested in borrowing or raising equity and thus increase the demand
- 18 -
Table of Contents
for our assets; (2) prepayments on our assets, to the extent allowed, to increase; (3) the interest expense associated with our borrowings to decrease; (4) the value of our fixed rate or fixed return assets to increase; and (5) the value of our interest rate swap agreements to decrease, to the extent we enter into such agreements as part of our hedging strategy. Adverse developments resulting from changes in interest rates could have a material adverse effect on our business, financial condition and results of operations.
The lack of liquidity of our assets may adversely affect our business, including our ability to value and sell our assets.
Volatile market conditions could significantly and negatively impact the liquidity of our assets. Illiquid assets typically experience greater price volatility, as a ready market does not exist, and can be more difficult to value. In addition, validating third-party pricing for illiquid assets may be more subjective than more liquid assets. The illiquidity of our assets may make it difficult for us to sell such assets if the need or desire arises. In addition, if we are required to liquidate all or a portion of our Portfolio quickly, we may realize significantly less than the value at which we have previously recorded our assets. To the extent that we utilize leverage to finance our purchase of assets that are or become illiquid, the negative impact on us related to trying to sell assets in a short period of time for cash could be greatly exacerbated. As a result, our ability to vary our portfolio in response to changes in economic and other conditions may be relatively limited, which could adversely affect our results of operations and financial condition.
We may experience a decline in the fair value of our assets.
A decline in the fair market value of available for sale securities, our financing receivables held for sale, our interest rate hedges, if any, or any other assets which we may carry at fair value in the future, may require us to reduce the value of such assets under generally accepted accounting principles in the United States (U.S. GAAP). In addition, all of our other financial assets are subject to an impairment assessment that could result in adjustments to their carrying values. Upon the subsequent disposition or sale of such assets, we could incur future losses or gains based on the difference between the sale price received and adjusted value of such assets as reflected on our balance sheet at the time of sale. See Note 2 and Note 3 of the audited financial statements in this Form 10-K for additional details related to our determination of fair value.
Some of the assets in our portfolio may be recorded at fair value (as determined in accordance with our pricing policy as approved by our board of directors) and, as a result, there could be uncertainty as to the value of these assets.
The financings we provide and the other assets we hold are not publicly traded. The fair value of assets that are not publicly traded may not be readily determinable. As required under and in accordance with U.S. GAAP, we record certain of our assets at fair value, which may include unobservable inputs. Because such valuations are subjective, the fair value of these assets may fluctuate over short periods of time and our determinations of fair value may differ materially from the values that would have been used if a ready market for these assets existed. The value of our common stock could be adversely affected if our determinations regarding the fair value of these assets were materially higher than the values that we ultimately realize upon their disposal. Additionally, our results of operations for a given period could be adversely affected if our determinations regarding the fair value of these assets were materially higher than the values that we ultimately realize upon their disposal. The valuation process has been particularly challenging in recent periods as market events have made valuations of certain assets more difficult, unpredictable and volatile.
We may not realize income or gains from our assets, which could cause the value of our common stock to decline.
We seek to provide attractive risk-adjusted returns to our stockholders. However, our assets may not appreciate in value and, in fact, may decline in value, and the assets we originate or acquire may default or not
- 19 -
Table of Contents
perform in accordance with our expectations. Accordingly, we may not be able to realize gains or income from our assets. Any gains that we do realize may not be sufficient to offset any other losses we experience. Any income that we realize may not be sufficient to offset our expenses.
Many of our assets are not rated by a rating agency, which may result in an amount of risk, volatility or potential loss of principal that is greater than that of alternative asset opportunities.
Many of our assets are not rated by any rating agency and we expect that many of the assets we originate and acquire in the future will not be rated by any rating agency. Although we focus on sustainable infrastructure projects with high credit quality obligors, we believe that some of the projects or obligors in which we invest, if rated, would be rated below investment grade, due to speculative characteristics of the project or the obligors capacity to pay interest and repay principal or pay dividends. Some of our assets may result in an amount of risk, volatility or potential loss of principal that is greater than that of alternative asset opportunities.
Any credit ratings assigned to our assets or obligors are subject to ongoing evaluations and revisions and we cannot assure you that those ratings will not be downgraded.
To the extent the assets we hold or their underlying obligors are rated by credit rating agencies or by our internal rating process, such assets will be subject to ongoing evaluation by credit rating agencies and our internal rating process, and we cannot assure you that any ratings will not be changed or withdrawn in the future. If rating agencies assign a lower-than-expected rating or if a rating is reduced or withdrawn by a rating agency or us, or if there are indications of a potential reduction or withdrawal of the ratings of our assets or the underlying obligors in the future, the value of these assets could significantly decline and could result in losses upon disposition or the failure of obligors to satisfy their obligations to us.
Our assets are subject to delinquency, foreclosure and loss, any or all of which could result in losses to us.
Our assets are subject to risks of delinquency, foreclosure and loss. In many cases, the ability of a borrower to repay our financing or the ability of an investment to return our capital and our expected return is dependent primarily upon the successful development, construction and operation of the underlying project. If the cash flow of the project is reduced, the borrowers ability to repay the debt financing we provide or the ability of an investment to return our capital and our expected return may be impaired. We make certain estimates regarding project cash flows or savings during the underwriting of our investment. These estimates may not prove accurate, as actual results may vary from estimates. The cash flows or cost savings of a project can be affected by, among other things: the terms of the power purchase or other use agreements used in such project; the creditworthiness of the power off-taker or project user; power prices now and in the future; the technology deployed; unanticipated expenses in the development or operation of the project and changes in national, regional or local economic conditions; and environmental legislation, acts of God, terrorism, social unrest and civil disturbances.
In the event of any default or shortfall of an investment, we will bear a risk of loss of principal or equity to the extent of any deficiency between the value of the collateral, if any, and the amount of our investment, which could have a material adverse effect on our cash flow from operations. In the event of the bankruptcy of a project owner or other borrower, our investment will be deemed to be subject to the avoidance powers of the bankruptcy trustee or debtor-in-possession and our contractual rights may be unenforceable under state law. Foreclosure proceedings against a project can be an expensive and lengthy process, which could have a substantial negative effect on our anticipated return on the foreclosed investment.
Our sustainable infrastructure projects may incur liabilities that rank equally with, or senior to, our investments in such projects.
We provide a range of investment structures, including various types of debt and equity securities, senior and subordinated loans, real property leases, mezzanine debt, preferred equity and common equity. Our projects
- 20 -
Table of Contents
may have, or may be permitted to incur, other liabilities or equity preferences that rank equally with, or senior to, our positions or investments in such projects or businesses, as the case may be, including with respect to grants of collateral. By their terms, such instruments may entitle the holders to receive payment of interest, principal payments or equity distributions on or before the dates on which we are entitled to receive payments with respect to the instruments in which we invest. Also, in the event of insolvency, liquidation, dissolution, reorganization or bankruptcy of an entity in which we have invested, holders of instruments ranking senior to our investment in that project or business would typically be entitled to receive payment in full before we receive any distribution. After repaying such senior stakeholders, such project may not have any remaining assets to use for repaying its obligation to us. In the case of securities ranking equally with instruments we hold, we would have to share on an equal basis any distributions with other stakeholders holding such instruments in the event of an insolvency, liquidation, dissolution, reorganization or bankruptcy of the relevant project.
Our mezzanine or subordinated loans are less protected against losses than senior debt.
We make or acquire mezzanine or subordinated loans, which are loans made to project owners for sustainable infrastructure projects that are subordinate to other more senior interest or are secured by pledges of the borrowers ownership interests in the project and/or the project owner. These mezzanine or subordinated loans may be subordinate to senior secured loans on the project or to the returns required by the tax equity investor in the project but senior to the project owners equity in the project. In the event a borrower defaults on a loan and lacks sufficient assets to satisfy our mezzanine or subordinated financing, we may suffer a loss of principal or interest. In the event a borrower declares bankruptcy, we may not have full recourse to the assets of the borrower, or the assets of the borrower may not be sufficient to satisfy our mezzanine or subordinated loan. In addition, mezzanine or subordinated loans are by their nature structurally subordinated to more senior project level financings, and in some cases, to tax equity investors. If a borrower defaults on our mezzanine or subordinated loan, on its obligations to the tax equity investor or on debt or other obligations senior to our loan, or if a borrower declares bankruptcy, our mezzanine or subordinated loan will be satisfied only after the project level debt or other obligations or tax equity and other senior debt is paid in full. Significant losses related to our mezzanine or subordinated loans would result in operating losses for us and may limit our ability to make distributions to our stockholders.
Our subordinated and mezzanine debt and equity investments, many of which are illiquid with no readily available market, involve a substantial degree of risk.
We make subordinated and mezzanine debt and equity investments which may fail to be repaid or appreciate and may decline in value or become worthless and our ability to recover our investment will depend on the success of the project in which we make such investments. Subordinated and mezzanine debt and equity investments involve a number of significant risks, including:
| | subordinated and mezzanine debt and any equity investment we make in a project could be subject to further dilution as a result of the issuance of additional debt or equity interests and to serious risks because subordinated and mezzanine debt are subordinate to other indebtedness and in some cases, project tax equity, and equity interests are subordinate to all indebtedness (including trade creditors) and any senior securities in the event that the issuer is unable to meet its obligations or becomes subject to a bankruptcy process; |
| | to the extent that a project in which we invest requires additional capital and is unable to obtain it, we may not recover our investment; and |
| | in some cases, subordinated and mezzanine debt will not pay current interest or principal or equity investments will not pay current dividends, and our ability to realize a return on our investment, as well as to recover our investment, will be dependent on the success of the project in which we invest. The project may face unanticipated costs or delays or may not generate projected cash flows which could lead to the project generating lower rates of return than we expected when we decided to fund the |
- 21 -
Table of Contents
| project. Further, many projects in which we make subordinated and mezzanine debt or equity investments will be subject to competitive risks and to volatility in commodity prices including the price of energy. Even if the project is successful, our ability to realize the value of our investment may be dependent on our ability to renew commercial contracts for a project or on the occurrence of a liquidity or other event. |
We generally do not control the projects in which we invest.
Although the covenants in our financing or investment documentation generally restrict certain actions that may be taken by project owners, we generally do not control the projects in which we invest. As a result, we are subject to the risk that the project owner may make business decisions with which we disagree or take risks or otherwise act in ways that do not serve our interests.
We invest in joint ventures or other similar arrangements that subject us to additional risks.
Some of our projects are structured as joint ventures, partnerships and securitization, syndication and consortium arrangements. Part of our strategy is to participate with other institutional investors in consortiums and in partnerships on various sustainable infrastructure transactions. These arrangements are driven by the magnitude of capital required to complete acquisitions and the development of sustainable infrastructure projects and other industry-wide trends that we believe will continue. Such arrangements involve risks not present where a third party is not involved, including the possibility that partners or co-venturers might become bankrupt or otherwise fail to fund their share of required capital contributions. Additionally, partners or co-venturers might at any time have economic or other business interests or goals different from us.
Joint ventures, partnerships and securitization, syndication and consortium investments generally provide for a reduced level of control over an acquired project because governance rights are shared with others. Accordingly, decisions relating to the underlying operations, including decisions relating to the management, operation and the timing and nature of any exit, are often made by a majority vote of the investors or by separate agreements that are reached with respect to individual decisions. In addition, such operations may be subject to the risk that the project owners may make business, financial or management decisions with which we do not agree or the management of the project may take risks or otherwise act in a manner that does not serve our interests. Because we may not have the ability to exercise control over such operations, we may not be able to realize some or all of the benefits that we believe will be created from our involvement. If any of the foregoing were to occur, our business, financial condition and results of operations could suffer as a result.
In addition, some of our joint ventures, partnerships, securitization or syndication or consortium arrangements, including our wind equity investments, subject the sale or transfer of our interests in these projects to rights of first refusal or first offer, tag along rights or drag along rights and buy-sell, call-put or other similar arrangements. Such rights may be triggered at a time when we may not want them to be exercised and such rights may inhibit our ability to sell our interest in an entity within our desired time frame or on any other desired basis.
Energy efficiency, renewable energy and other sustainable infrastructure projects are subject to performance risks that could impact the repayment of and the return on our assets.
Energy efficiency, renewable energy and other sustainable infrastructure projects are subject to various construction and operating delays and risks that may cause them to incur higher than expected costs or generate less than expected amounts of output such as electricity in the case of a renewable energy project. These risks include construction delays, a failure or degradation of our, our customers or the utilities equipment; an inability to find suitable equipment or parts; labor shortages; less than expected supply of a projects source of renewable energy, such as solar insolation, wind, geothermal brine or biomass; or a faster than expected diminishment of such supply. Further, many projects in which we invest will be subject to competitive risks and to volatility in commodity prices including the price of energy. Any extended interruption in the projects construction or operation, any cost overrun or failure of the project for any reason to generate the expected amount of output or cash flow, could have a material adverse effect on the repayment of and the return on our assets.
- 22 -
Table of Contents
Many of our assets depend on revenues from third-party contractual arrangements.
Many of the projects in which we invest rely on revenue or repayment from contractual commitments of end-customers such as the federal government for our energy efficiency projects or utilities under power purchase agreements. There is a risk that these customers will default under their contracts. Furthermore, the bankruptcy, insolvency or other liquidity constraints of one or more customers may reduce the likelihood of collecting defaulted obligations. Some projects rely on one customer for their revenue and thus the project could be materially and adversely affected by any material change in the financial condition of that customer. While there may be alternative customers for such a project, there can be no assurance that a new contract on the same terms will be able to be negotiated for the project.
Certain of our projects with contractually-committed revenues or other sources of repayment under a small number of long term contracts will be subject to re-contracting risk in the future. We cannot provide assurance that these contracts can be re-negotiated once their terms expire on equally favorable terms or at all. If it is not possible to renegotiate these contracts on favorable terms, our business, financial condition, results of operation and prospects could be materially and adversely affected.
Revenues at some of the projects in which we invest depend on reliable and efficient metering, or other revenue collection systems, which are often specified in the contract. There is a risk that, if one or more of such projects are not able to operate and maintain the metering or other revenue collection systems in the manner expected, if the operation and maintenance costs, are greater than expected, or if the customer disputes the output of the revenue collection system, the ability of the project to repay our financing or provide a return to us on our asset could be materially and adversely affected.
We are exposed to the credit risk of ESCOs and others.
While we do not anticipate facing significant credit risk in our assets related to U.S. federal government energy efficiency projects, we are subject to varying degrees of credit risk in these projects in relation to guarantees provided by ESCOs where payments under energy savings performance contracts are contingent upon energy savings. We are also exposed to credit risk in projects in which we invest that do not depend on funding from the U.S. federal government. We increasingly target such projects as part of our strategy. We seek to mitigate this credit risk by employing a comprehensive review and asset selection process and careful ongoing monitoring of acquired assets. Nevertheless, unanticipated credit losses could occur which could adversely impact our operating results. During periods of economic downturn in the global economy, our exposure to credit risks from obligors increases, and our efforts to monitor and mitigate the associated risks may not be effective in reducing our credit risks. Certain participants in the sustainable energy industry have experienced significant declines in the value of their equity and may face difficulty in raising or refinancing debt, both of which increases the credit risk to these companies and there can be no assurance they will be able to fulfill their obligations which could adversely impact our operating results.
Some of the projects in which we invest have sold their output under power purchase agreements which expose the projects to various risks.
Some of our projects enter into PPAs when they contract to sell all or a fixed proportion of the electricity generated by the project, sometimes bundled with renewable energy credits and capacity or other environmental attributes, to a power purchaser, often a utility. PPAs are used to stabilize our revenues from that project. We are exposed to the risk that the power purchaser, who we consider an obligor, will fail to perform under a PPA, which will lead to that project needing to sell its electricity at the market price, which could be substantially lower than the price provided in the applicable PPA. In most instances, the project also commits to sell minimum levels of generation. If the project generates less than the committed volumes, it may be required to buy the shortfall of electricity on the open market or make payments of liquidated damages or be in default under a PPA, which could result in its termination. In the event that any of these events were to occur, our business, financial condition and results of operations could suffer as a result.
- 23 -
Table of Contents
Certain of the electricity our assets generate is sold on the open market at spot-market prices. A prolonged environment of low prices for natural gas, or other conventional fuel sources, could have a material adverse effect on our long-term business prospects, financial condition and results of operations.
Historically low prices for traditional fossil fuels, particularly natural gas, could cause demand for renewable energy to decrease or adversely affect both the price available to our projects under PPAs that the projects may enter into in the future and the price of the electricity the projects generate for sale on a spot-market basis. Low spot market power prices, if combined with other factors, could have a material adverse effect on the projects and our results of operations and cash available for distribution. Additionally, cheaper conventional fuel sources could also have a negative impact on the power prices the projects are able to negotiate upon the expiration of current PPAs. As a result, the price our projects realize in the open market could be materially and adversely affected, which could, in turn, have a material adverse effect on the projects results of operations and cash available for distribution. In the event that any of these events were to occur, our business, financial condition and results of operations could suffer as a result.
The ability of our assets to generate revenue from certain utility renewable energy projects depends on having interconnection arrangements and services.
The future success of our renewable energy assets will depend, in part, on their ability to maintain satisfactory interconnection agreements. If the interconnection or transmission agreement of a renewable energy project is terminated for any reason, they may not be able to replace it with an interconnection and transmission arrangement on terms as favorable as the existing arrangement, or at all, or they may experience significant delays or costs in connection with securing a replacement. If a network to which one or more of the renewable energy projects is connected experiences equipment or operational problems or other forms of down time, the affected project may lose revenue and be exposed to non-performance penalties and claims from its customers. These may include claims for damages incurred by customers, such as the additional cost of acquiring alternative electricity supply at then-current spot market rates. The owners of the network will not usually compensate electricity generators for lost income due to down time. These factors could materially affect the ability to forecast operations on these projects, which could negatively affect our business, results of operations, financial condition and cash flow.
The generation of electric energy from renewable energy sources depends heavily on suitable meteorological conditions. If renewable conditions are unfavorable, the electricity generation, and therefore revenue from our renewable generation assets, may be substantially below our expectations.
The electricity produced and revenues generated by a renewable electric generation facility are highly dependent on suitable weather conditions, which are beyond our control. Furthermore, components of renewable energy systems, such as turbines, solar panels and inverters, could be damaged by natural disasters or severe weather, including hailstorms or tornadoes. The projects in which we invest will be obligated to bear the expense of repairing the damaged renewable energy systems, and replacing spare parts for key components and insurance may not cover the costs or the lost revenue. Natural disasters or unfavorable weather and atmospheric conditions could impair the effectiveness of the renewable energy assets, reduce their output beneath their rated capacity, require shutdown of key equipment or impede operation of the renewable energy assets which could adversely affect our business, financial condition and results of operations and cash flows. Sustained unfavorable weather could also unexpectedly delay the installation of renewable energy systems, which could result in a delay in our investing in new projects or increase the cost of such projects.
We typically base our investment decisions with respect to each renewable energy facility on the findings of studies conducted on-site prior to construction or based on historical conditions at existing facilities. However, actual climatic conditions at a facility site may not conform to the findings of these studies. Even if an operating projects historical renewable energy resources are consistent with the long-term estimates, the unpredictable nature of weather conditions often results in daily, monthly and yearly material deviations from the average
- 24 -
Table of Contents
renewable resources anticipated during a particular period. Therefore, renewable energy facilities in which we invest may not meet anticipated production levels or the rated capacity of the generation assets, which could adversely affect our business, financial condition and results of operations and cash flows.
The amount of electricity renewable energy generation assets produce is also dependent in part on the time of year. For example, because shorter daylight hours in winter months results in less solar irradiation, the generation of particular assets will vary depending on the season. Further, time-of-day pricing factors vary seasonally which contributes to variability of revenues. As a result, we expect the revenue and cash flow from certain of our assets to vary based on the time of year.
Operation of electric generation facilities involves significant risks and hazards customary to the power industry that could have a material adverse effect on our business, financial condition, results of operations and cash flows.
The ongoing operation of the projects in which we invest involves risks that include the breakdown or failure of equipment or processes or performance below expected levels of output or efficiency due to wear and tear, latent defect, design error or operator error or force majeure events, among other things. In addition to natural risks such as earthquake, flood, drought, lightning, hurricane and wind, other hazards, such as fire, explosion, structural collapse and machinery failure, acts of terrorism or related acts of war, hostile cyber intrusions or other catastrophic events are inherent risks in the operation of a project. These and other hazards can cause significant personal injury or loss of life, severe damage to and destruction of property, plant and equipment and contamination of, or damage to, the environment and suspension of operations. Operation of a project also involves risks that the operator will be unable to transport its product to its customers in an efficient manner due to a lack of transmission capacity. Unplanned outages of generating units, including extensions of scheduled outages due to mechanical failures or other problems, occur from time to time and are an inherent risk of the business. Unplanned outages typically increase operation and maintenance expenses and may reduce revenues as a result of selling fewer megawatt hours or require the project to incur significant costs as a result of obtaining replacement power from third parties in the open market to satisfy forward power sales obligations. The projects inability to operate its electric generation assets efficiently, manage capital expenditures and costs and generate earnings and cash flow could have a material adverse effect on our investment and our business, financial condition, results of operations and cash flows. While the projects maintain insurance, obtain warranties from vendors and obligate contractors to meet certain performance levels, the proceeds of such insurance, warranties or performance guarantees may not cover the lost revenues, increased expenses or liquidated damages payments should the project experience equipment breakdown or non-performance by contractors or vendors.
Some of the projects in which we invest may require substantial operating or capital expenditures in the future.
Many of the projects in which we invest are capital intensive and require substantial ongoing expenditures for, among other things, additions and improvements, and maintenance and repair of plant and equipment related to project operations. While we do not typically bear the responsibility for these expenditures, any failure by the equity owner to make necessary operating or capital expenditures could adversely impact project performance. In addition, some of these expenditures may not be recoverable from current or future contractual arrangements.
The use of real property rights that we acquire or are used for our sustainable infrastructure projects may be adversely affected by the rights of lienholders and leaseholders that are superior to those of the grantors of those real property rights to us.
The projects in which we invest often require large areas of land for construction and operation or other easements or access to the underlying land. In addition, we may acquire rights to land or other real property. The rights to use the land can be obtained through freehold title, leases and other rights of use. Although we believe
- 25 -
Table of Contents
that the real property rights we acquire, or our projects in which we invest, have valid rights to all material easements, licenses and rights of way, not all of such easements, licenses and rights of way are registered against the lands to which they relate and may not bind subsequent owners. Some of our real property rights and projects generally are, and are likely to continue to be, located on land occupied pursuant to long-term easements and leases. The ownership interests in the land subject to these easements and leases may be subject to mortgages securing loans or other liens (such as tax liens) and other easement and lease rights of third parties (such as leases of oil or mineral rights) that were created prior to, or are superior to, our or our projects easements and leases. As a result, the rights under these easements or leases may be subject, and subordinate, to the rights of those third parties. We typically obtain representations or perform title searches or obtain title insurance to protect our real property interest or our investments in our projects against these risks. Such measures may, however, be inadequate to protect against all risk of loss of rights to use the land rights we have acquired or the land on which these projects are located, which could have a material and adverse effect on our land rights, our projects and their financial condition and operating results.
We own land or leasehold interests that are used by renewable energy projects. Negative market conditions or adverse events affecting tenants, or the industries in which they operate, could have an adverse impact on our underwritten returns. Moreover, such assets are concentrated in a limited number of properties, which subjects us to an increased risk of significant loss if any property declines in value or if we are unable to lease a property.
We own a limited number of land or leasehold interests that are used by renewable energy projects. One consequence of a limited number of real property assets is that the aggregate returns we realize may be substantially adversely affected by the unfavorable performance of a small number of leases or a significant decline in the value of any single property. Our cash flow depends in part on the ability to lease the real estate to tenants on economically favorable terms. We could be adversely affected by various facts and events over which we have limited or no control, such as:
| | lack of demand in areas where our properties are located; |
| | inability to retain existing tenants and attract new tenants; |
| | oversupply of space and changes in market rental rates; |
| | our tenants creditworthiness and ability to pay rent, which may be affected by their operations, the current economic situation and competition within their industries from other operators; |
| | defaults by and bankruptcies of tenants, failure of tenants to pay rent on a timely basis, or failure of tenants to comply with their contractual obligations; and |
| | economic or physical decline of the areas where the properties are located. |
At any time, any tenant may experience a downturn in its business that may weaken its operating results or overall financial condition, a tenant may delay lease commencement, fail to make rental payments when due, decline to extend a lease upon its expiration, become insolvent or declare bankruptcy. Any tenant bankruptcy or insolvency, leasing delay or failure to make rental payments when due could result in the termination of the tenants lease and material losses to us.
If a tenant elects to terminate its lease prior to or upon its expiration or does not renew its lease as it expires, we may not be able to rent or sell the properties. Furthermore, leases that are renewed and some new leases for properties that are re-leased, may have terms that are less economically favorable than expiring lease terms, or may require us to incur significant costs, such as lease transaction costs. In addition, negative market conditions or adverse events affecting tenants, or the industries in which they operate, may force us to sell vacant properties for less than their carrying value, which could result in impairments. Any of these events could adversely affect cash flow from operations and our ability to make distributions to stockholders and service indebtedness. A significant portion of the costs of owning property, such as real estate taxes, insurance and maintenance, are not
- 26 -
Table of Contents
necessarily reduced when circumstances cause a decrease in rental revenue from the properties. In a weakened financial condition, tenants may not be able to pay these costs of ownership and we may be unable to recover these operating expenses from them.
Further, the occurrence of a tenant bankruptcy or insolvency could diminish the income we receive from the tenants lease or leases. For instance, a bankruptcy court might authorize the tenant to terminate its leases with us. If that happens, our claim against the bankrupt tenant for unpaid future rent would be subject to statutory limitations that most likely would be substantially less than the remaining rent we are owed under the leases. In addition, any claim we have for unpaid past rent, if any, may not be paid in full. As a result, tenant bankruptcies may have a material adverse effect on our results of operations.
In addition, since renewable energy projects are often concentrated in certain states, we would also be subject to any adverse change in the political or regulatory climate in those states or specific counties where such properties are located that could adversely affect our properties and our ability to lease such properties.
Performance of projects where we invest may be harmed by future labor disruptions and economically unfavorable collective bargaining agreements.
A number of the projects where we invest could have workforces that are unionized or that in the future may become unionized and, as a result, are required to negotiate the wages, benefits and other terms with many of their employees collectively. If these projects were unable to negotiate acceptable contracts with any of their unions as existing agreements expire, they could experience a significant disruption of their operations, higher ongoing labor costs and restrictions on their ability to maximize the efficiency of their operations, which could have a material and adverse effect on our business, financial condition and results of operations. In addition, in some jurisdictions where our projects have operations, labor forces have a legal right to strike which may have a negative impact on our business, financial condition and results of operations, either directly or indirectly, for example if a critical upstream or downstream counterparty was itself subject to a labor disruption which impacted the ability of our projects to operate.
We invest in projects that rely on third parties to manufacture quality products or provide reliable services in a timely manner and the failure of these third parties could cause project performance to be adversely affected.
We invest in projects that typically rely on third parties to select and manage various equipment and service providers. These third parties may be responsible for choosing vendors, including equipment suppliers and subcontractors. Project success often depends on third parties who are capable of installing and managing projects and structuring contracts that provide appropriate protection against construction and operational risks. In many cases, in addition to contractual protections and remedies, project owners may seek guaranties, warranties and construction bonding to provide additional protection.
The warranties provided by the third parties and, in some cases, their subcontractors, typically limit any direct harm that results from relying on their products and services. However, there can be no assurance that a supplier or subcontractor will be willing or able to fulfill its contractual obligations and make necessary repairs or replace equipment. In addition, these warranties generally expire within one to five years or may be of limited scope or provide limited remedies. If projects are unable to avail themselves of warranty protection or receive the expected protection under the terms of the guaranties or bonding, we may need to incur additional costs, including replacement and installation costs, which could adversely impact our investment.
- 27 -
Table of Contents
Liability relating to environmental matters may impact the value of properties that we may acquire or the properties underlying our assets.
Under various U.S. federal, state and local laws, an owner or operator of real estate or a project may become liable for the costs of removal of certain hazardous substances released from the project or any underlying real property. These laws often impose liability without regard to whether the owner or operator knew of, or was responsible for, the release of such hazardous substances.
The presence of hazardous substances may adversely affect our, or another owners, ability to sell a contaminated project or borrow using the project as collateral. To the extent that we, or another project owner, become liable for removal costs, our investment, or the ability of the owner to make payments to us, may be negatively impacted.
We acquire real property rights, make investments in projects that own real property, have collateral consisting of real property and in the course of our business, we may take title to a project or its underlying real estate assets relating to one of our debt financings. In these cases, we could be subject to environmental liabilities with respect to these assets. To the extent that we become liable for the removal costs, our results of operation and financial condition may be adversely affected. The presence of hazardous substances, if any, may adversely affect our ability to sell the affected real property or the project and we may incur substantial remediation costs, thus harming our financial condition.
Our insurance and contractual protections may not always cover lost revenue, increased expenses or liquidated damages payments.
Although our assets or projects generally have insurance, supplier warranties, subcontractors performance assurances such as bonding and other risk mitigation measures, the proceeds of such insurance, warranties, bonding or other measures may not be adequate to cover lost revenue, increased expenses or liquidated damages payments that may be required in the future.
Risks Related to Our Company
We may change our operational policies (including our investment guidelines, strategies and policies) with the approval of our board of directors but without stockholder consent at any time, which may adversely affect the market value of our common stock and our ability to make distributions to our stockholders.
Our board of directors determines our operational policies and may amend or revise our policies, including our policies with respect to acquisitions, dispositions, growth, operations, compensation, indebtedness, capitalization and dividends, or approve transactions that deviate from these policies, without a vote of, or notice to, our stockholders at any time. We may change our investment guidelines, underwriting process and our strategy at any time with the approval of our board of directors, but without the consent of our stockholders, which could result in our originating assets that are different in type from, and possibly riskier than, the assets initially contemplated. In addition, our charter provides that our board of directors may authorize us to revoke or otherwise terminate our REIT election, without the approval of our stockholders, if it determines that it is no longer in our best interests to qualify as a REIT. These changes could adversely affect our business, financial condition, results of operations and our ability to make distributions to our stockholders.
Our management and employees depend on information systems and system failures could significantly disrupt our business, which may, in turn, negatively affect the market price of our common stock and our ability to make distributions to our stockholders.
Our underwriting process and our asset and financial management and reporting are dependent on our present and future communications and information systems. Any failure or interruption of these systems could cause delays or other problems in our originating, financing, investing, asset and financial management and reporting activities, which could have a material adverse effect on our operating results.
- 28 -
Table of Contents
Cybersecurity risk and cyber incidents may adversely affect our business by causing a disruption to our operations, a compromise or corruption of our confidential information and/or damage to our business relationships, all of which could negatively impact our financial results.
A cyber incident is considered to be any adverse event that threatens the confidentiality, integrity or availability of our information resources. These incidents may be an intentional attack or an unintentional event and could involve gaining unauthorized access to our information systems for purposes of misappropriating assets, stealing confidential information, corrupting data or causing operational disruption. The result of these incidents may include disrupted operations, misstated or unreliable financial data, liability for stolen assets or information, increased cybersecurity protection and insurance cost, litigation and damage to our relationships. As our reliance on technology has increased, so have the risks posed to both our information systems and those provided by third-party service providers. We have implemented processes, procedures and internal controls to help mitigate cybersecurity risks and cyber intrusions, but these measures, as well as our increased awareness of the nature and extent of a risk of a cyber incident, do not guarantee that our financial results, operations or confidential information will not be negatively impacted by such an incident.
We may seek to expand our business internationally, which will expose us to additional risks that we do not face in the United States, which could have an adverse effect on our business, financial condition and operating results.
We generate substantially all of our revenue from operations in the United States, and currently derive only a small amount of revenue from outside of the United States. We may seek to expand our revenue and projects outside of the United States in the future. These operations will be subject to a variety of risks that we do not face in the United States, including risk from changes in foreign country regulations, infrastructure, legal systems and markets. Other risks include possible difficulty in repatriating overseas earnings and fluctuations in foreign currencies.
Our overall success in international markets will depend, in part, on our ability to succeed in different legal, regulatory, economic, social and political conditions. We may not be successful in developing and implementing policies and strategies that will be effective in managing these risks in each country where we decide to do business. Our failure to manage these risks successfully could harm our international projects, reduce our international income or increase our costs, thus adversely affecting our business, financial condition and operating results.
We may seek to expand our business in part through future acquisitions
As we grow our business, we may find opportunities to use acquisitions of companies or assets to invest in new or different projects, expand our project skill-sets and capabilities, expand our geographic markets, add experienced management and increase our product and service offerings. There are a number of risks associated with any acquisition and we may not achieve our goals in making an acquisition. Any future acquisitions that we may make could disrupt our business, cause dilution to our stockholders and harm our business, financial condition or operating results. In addition, the time and effort involved in attempting to identify acquisition candidates and consummate acquisitions may divert members of our management from the operations of our company.
Risks Relating to Regulation
We cannot predict the unintended consequences and market distortions that may stem from far-ranging governmental intervention in the economic and financial system or from regulatory reform of the oversight of financial markets.
The U.S. federal government, the Federal Reserve Board of Governors, the U.S. Treasury, the SEC, U.S. Congress and other governmental and regulatory bodies have taken, are taking or may in the future take, various actions to address the financial crisis or other areas of regulatory concern. Such actions could have a dramatic
- 29 -
Table of Contents
impact on our business, results of operations and financial condition, and the cost of complying with any additional laws and regulations could have a material adverse effect on our financial condition and results of operations. The far-ranging government intervention in the economic and financial system may carry unintended consequences and cause market distortions. We are unable to predict at this time the extent and nature of such unintended consequences and market distortions, if any.
Loss of our 1940 Act exception would adversely affect us, the market price of shares of our common stock and our ability to distribute dividends.
We conduct our operations so that we are not required to register as an investment company under the 1940 Act. Section 3(a)(1)(A) of the 1940 Act defines an investment company as any issuer that is or holds itself out as being engaged primarily in the business of investing, reinvesting or trading in securities. Section 3(a)(1)(C) of the 1940 Act defines an investment company as any issuer that is engaged or proposes to engage in the business of investing, reinvesting, owning, holding or trading in securities and owns or proposes to acquire investment securities having a value exceeding 40% of the value of the issuers total assets (exclusive of U.S. Government securities and cash items) on a non-consolidated basis, which we refer to as the 40% test. Excluded from the term investment securities, among other things, are U.S. Government securities and securities issued by majority-owned subsidiaries that are not themselves investment companies and are not relying on the exception from the definition of investment company set forth in Section 3(c)(1) or Section 3(c)(7) of the 1940 Act.
We conduct our businesses primarily through our subsidiaries and our operations so that we comply with the 40% test. The securities issued by any wholly-owned or majority-owned subsidiaries that we hold or may form in the future that are excepted from the definition of investment company based on Section 3(c)(1) or 3(c)(7) of the 1940 Act, together with any other investment securities we may own, may not have a value in excess of 40% of the value of our total assets on a non-consolidated basis. Certain of our subsidiaries rely on or will rely on an exception from registration as an investment company under the 1940 Act pursuant to Section 3(c)(5)(C) of the 1940 Act, which is available for entities which are not primarily engaged in issuing redeemable securities, face-amount certificates of the installment type or periodic payment plan certificates and which are primarily engaged in the business of purchasing or otherwise acquiring mortgages and other liens on and interests in real estate. This exception generally requires that at least 55% of such subsidiaries portfolios must be comprised of qualifying assets and at least 80% of each of their portfolios must be comprised of qualifying assets and real estate-related assets under the 1940 Act. Consistent with guidance published by the SEC staff, we intend to treat as qualifying assets for this purpose loans secured by projects for which the original principal amount of the loan did not exceed 100% of the value of the underlying real property portion of the collateral when the loan was made. We intend to treat as real estate-related assets non-controlling equity interests in joint ventures that own projects whose assets are primarily real property. In general, with regard to our subsidiaries relying on Section 3(c)(5)(C), we rely on other guidance published by the SEC or its staff or on our analyses of guidance published with respect to other types of assets to determine which assets are qualifying real estate assets and real estate-related assets.
In addition, one or more of our subsidiaries qualifies for an exception from registration as an investment company under the 1940 Act pursuant to either Section 3(c)(5)(A) of the 1940 Act, which is available for entities which are not engaged in the business of issuing redeemable securities, face-amount certificates of the installment type or periodic payment plan certificates, and which are primarily engaged in the business of purchasing or otherwise acquiring notes, drafts, acceptances, open accounts receivable, and other obligations representing part or all of the sales price of merchandise, insurance, and services, or Section 3(c)(5)(B) of the 1940 Act, which is available for entities primarily engaged in the business of making loans to manufacturers, wholesalers, and retailers of, and to prospective purchasers of, specified merchandise, insurance, and services. These exceptions generally require that at least 55% of such subsidiaries portfolios must be comprised of qualifying assets that meet the requirements of the exception. We intend to treat energy efficiency loans where the loan proceeds are specifically provided to finance equipment, services and structural improvements to properties and other facilities and renewable energy and other sustainable infrastructure projects or
- 30 -
Table of Contents
improvements as qualifying assets for purposes of these exceptions. In general, we also expect, with regard to our subsidiaries relying on Section 3(c)(5)(A) or (B), to rely on guidance published by the SEC or its staff or on our analyses of guidance published with respect to other types of assets to determine which assets are qualifying assets under the exceptions.
Although we monitor the portfolios of our subsidiaries relying on the Section 3(c)(5)(A), (B) or (C) exceptions periodically and prior to each acquisition, there can be no assurance that such subsidiaries will be able to maintain their exceptions. Qualification for exceptions from registration under the 1940 Act will limit our ability to make certain investments. For example, these restrictions will limit the ability of these subsidiaries to make loans that are not secured by real property or that do not represent part or all of the sales price of merchandise, insurance, and services.
There can be no assurance that the laws and regulations governing the 1940 Act, including the Division of Investment Management of the SEC providing more specific or different guidance regarding these exceptions, will not change in a manner that adversely affects our operations. For example, on August 31, 2011, the SEC issued a concept release (No. IC-29778; File No. SW7-34-11, Companies Engaged in the Business of Acquiring Mortgages and Mortgage-Related Instruments) pursuant to which it is reviewing the scope of the exception from registration under Section 3(c)(5)(C) of the 1940 Act. Any additional guidance from the SEC or its staff from this process or in other circumstances could provide additional flexibility to us, or it could further inhibit our ability to pursue the strategies we have chosen. If we or our subsidiaries fail to maintain an exception from the 1940 Act, we could, among other things, be required either to (1) change the manner in which we conduct our operations to avoid being required to register as an investment company, (2) effect sales of our assets in a manner that, or at a time when, we would not otherwise choose to do so or (3) register as an investment company, any of which could negatively affect our business, our ability to make distributions and the market price for our shares of common stock.
We have not requested the SEC or its staff to approve our treatment of any company as a majority-owned subsidiary and neither the SEC nor its staff has done so. If the SEC or its staff were to disagree with our treatment of one or more companies as majority-owned subsidiaries, we would need to adjust our strategy and our assets in order to continue to pass the 40% test. Any such adjustment in our strategy could have a material adverse effect on us.
Rapid changes in the values of our assets may make it more difficult for us to maintain our qualification as a REIT or our exception from the 1940 Act.
If the market value or income potential of our assets changes as a result of changes in interest rates, general market conditions, government actions or other factors, we may need to adjust the portfolio mix of our real estate assets and income or liquidate our non-qualifying assets to maintain our REIT qualification or our exception from the 1940 Act. If changes in asset values or income occur quickly, this may be especially difficult to accomplish. This difficulty may be exacerbated by the illiquid nature of the assets we may own. We may have to make decisions that we otherwise would not make absent the REIT and 1940 Act considerations.
Because we expect to distribute substantially all of our taxable income to our stockholders, we will need additional capital to finance our growth and such capital may not be available on favorable terms or at all.
We may need additional capital to fund our growth. U.S. federal income tax law generally requires that a REIT distribute annually at least 90% of its REIT taxable income, without regard to the deduction for dividends paid and excluding net capital gains, and that it pay tax at regular corporate rates to the extent that it annually distributes greater than 90% but less than 100% of its REIT taxable income. Because we intend to grow our business, this limitation may require us to incur additional debt or raise additional equity at a time when it may be disadvantageous to do so. We cannot make any assurance that debt and equity financing will be available to us on favorable terms, or at all, and debt financings may be restricted by the terms of any of our outstanding
- 31 -
Table of Contents
borrowings. If additional funds are not available to us, we could be forced to curtail or cease new asset originations and acquisitions, which could have a material adverse effect on our business and financial condition.
The preparation of our financial statements involves use of estimates, judgments and assumptions, and our financial statements may be materially affected if our estimates prove to be inaccurate.
Financial statements prepared in accordance with U.S. GAAP require the use of estimates, judgments and assumptions that affect the reported amounts. Different estimates, judgments and assumptions reasonably could be used that would have a material effect on the financial statements, and changes in these estimates, judgments and assumptions are likely to occur from period to period in the future. Significant areas of accounting requiring the application of managements judgment include, but are not limited to determining the fair value of our assets. These estimates, judgments and assumptions are inherently uncertain, and, if they prove to be wrong, then we face the risk that charges to income will be required. In addition, because our company has a limited operating history, we have in some of these areas limited experience in making these estimates, judgments and assumptions and the risk of future charges to income may be greater than if we had more experience in these areas. Any such charges could significantly harm our business, financial condition, results of operations and the price of our securities. See Managements Discussion and Analysis of Financial Condition and Results of OperationsCritical Accounting Policies for a discussion of the accounting estimates, judgments and assumptions that we believe are the most critical to an understanding of our business, financial condition and results of operations.
Risks Related to Borrowings
We use leverage in executing our business strategy, which may adversely affect the return on our assets and may reduce cash available for distribution to our stockholders, as well as increase losses when economic conditions are unfavorable.
We use leverage to finance our assets, including our credit facility and our nonrecourse debt as well as securitizations. In the future, our financing sources may also include other fixed and floating rate borrowings in the form of new bank credit facilities (including term loans and revolving facilities), warehouse facilities, repurchase agreements, securitizations and public and private debt issuances. For further information on our credit facility and nonrecourse debt, see Managements Discussion and Analysis of Financial Condition and Results of OperationsCredit Facility and Nonrecourse Debt.
Changes in the financial markets and the economy generally could adversely affect one or more of our lenders or potential lenders and could cause one or more of our lenders, potential lenders or institutional investors to be unwilling or unable to provide us with financing or participate in securitizations or could increase the costs of that financing or securitization. The return on our assets and cash available for distribution to our stockholders may be reduced to the extent that market conditions prevent us from leveraging our assets or increase the cost of our financing relative to the income that can be derived from the assets acquired. Increases in our financing costs will reduce cash available for distributions to stockholders. We may not be able to meet our financing obligations and, to the extent that we cannot, we risk the loss of some or all of our assets to liquidation or sale to satisfy the obligations.
An increase in our borrowing costs relative to the interest we receive on our leveraged assets may adversely affect our profitability and our cash available for distribution to our stockholders. Our borrowings may have a shorter duration than our assets.
Borrowing rates are currently at historically low levels that may not be sustained in the long run. As any borrowing agreements we enter into mature, we will be required either to enter into new borrowings or to sell certain of our assets. In addition, our credit facility has rates that adjust on a frequent basis based on prevailing interest rates. An increase in interest rates, or the flattening of the yield curve, would reduce the spread between the returns on our assets and the cost of any new borrowings or borrowings where the interest rate adjusts to
- 32 -
Table of Contents
market rates. This increase in interest rates would adversely affect the returns on our assets, which might reduce our earnings and, in turn, cash available for distribution to our stockholders. In addition, as we may use short-term borrowings including repurchase agreements and warehouse facilities that are generally short-term commitments of capital, lenders may respond to market conditions making it more difficult for us to secure continued financing. If we are not able to renew our then existing facilities or arrange for new financing on terms acceptable to us, or if we default on our covenants or are otherwise unable to access funds under any of these facilities, we may have to curtail entering into new transactions and/or dispose of assets. We will face particular risk in this regard given that we expect many of our borrowings will have a shorter duration than the assets they finance.
We do not have a formal policy limiting the amount of debt we may incur. Our board of directors may change our leverage policy without stockholder approval.
Although we are not restricted by any regulatory requirements to maintain our leverage ratio at or below any particular level, the amount of leverage we may deploy for particular assets will depend upon the availability of particular types of financing and our assessment of the credit, liquidity, price volatility and other risks of those assets and the credit quality of our financing counterparties. In March 2015, we increased our leverage target to 2.5 to 1 from less than 2.0 to 1. Our debt to equity ratio was approximately 2.1 to 1 as of December 31, 2015. We also have increased the percentage of fixed rate debt from zero at the IPO to approximately 71% as of December 31, 2015, or slightly above our targeted fixed rate debt percentage range of approximately 50% to 70%. In order to simplify these calculations, we have begun to use, in February 2016, the total debt on our balance sheet, including our credit facility, nonrecourse securitization debt and other nonrecourse match funded debt. Historically, we excluded the other nonrecourse match funded debt, which as of December 31, 2015, was $101 million, and if such debt would have been excluded, the debt to equity ratio would have been 1.9 to 1 and the fixed rate debt percentage was 68%. We continue to calculate both of these ratios exclusive of securitizations that are not consolidated on our balance sheet (where the collateral is typically borrowings with U.S. government obligors) and for the purposes of the fixed rate debt target, we include as fixed rate debt, the present notional value hedged by interest rate swaps. However, our charter and bylaws do not limit the amount or type of indebtedness we can incur, and our board of directors has changed, and has the discretion to deviate from or change at any time in the future, our leverage policy, which could result in an investment portfolio with a different risk profile. Moreover, we have more limited experience dealing with debt financings with obligors other than U.S. federal government agencies as well as with our other types of assets and we may apply too much leverage to our assets or use the wrong kinds of financings to leverage our assets.
We will require additional borrowings and equity raises in the future to achieve our targets
To achieve our leverage target and to grow our business, we will require new sources of debt and equity which may be difficult to arrange or which may have significantly higher costs. Certain participants in the sustainable energy industry have experienced significant declines in the value of their equity and may face difficulty in raising new equity or in raising or refinancing debt. If we were to experience such declines or difficulties, we may be forced to limit our growth, liquidate assets or incur higher costs which may significantly harm our business, financial condition, results of operations, and our ability to make or grow our distributions, which could cause the value of our common stock to decline.
The use of securitizations and special purpose entities would expose us to additional risks.
We presently hold, and to the extent that we securitize loans in the future, we anticipate that we will often hold the most junior certificates or the residual value associated with a securitization. We may also establish other funds or special purpose entities where we would hold only a partial interest, a residual value or a right to participate in the profits of such entity once it achieves a predefined threshold. As a holder of the residual value or other such interests, we are more exposed to losses on the underlying collateral because the interest we retain in the securitization vehicle or other entity would be subordinate to the more senior notes or interests issued to
- 33 -
Table of Contents
investors and we would, therefore, absorb all of the losses, up to the value of our interests, sustained with respect to the underlying assets before the owners of the notes or other interests experience any losses. In addition, the inability to securitize our portfolio or assets within our portfolio could hurt our performance and our ability to grow our business.
We also use various special purpose entities to own and finance our assets. These subsidiaries incur various types of debt, which can be used to finance one or more of our assets. This debt is typically structured as nonrecourse debt, which means it is repayable solely from the revenue from the investment financed by the debt and is secured by the related physical assets, major contracts, cash accounts and in some cases, a pledge of our ownership interests in the subsidiaries involved in the projects. Although this subsidiary debt is typically nonrecourse to us, we make certain representations and warranties or enter into certain guaranties of our subsidiarys obligations or covenants to the nonrecourse debt holder, the breach of which may require us to make payments to the lender. We may also from time to time determine to provide financial support to the subsidiary in order to maintain rights to the project or otherwise avoid the adverse consequences of a default. In the event a subsidiary defaults on its indebtedness, its creditors may foreclose on the collateral securing the indebtedness, which may result in us losing our ownership interest in some or all of the subsidiarys assets. The loss of our ownership interest in a subsidiary or some or all of a subsidiarys assets could have a material adverse effect on our business, financial condition and operating results.
Our existing credit facility and nonrecourse debt contain, and any future financing facilities may contain, covenants that restrict our operations and may inhibit our ability to grow our business and increase revenues.
Our existing senior secured revolving credit facility contains, and any future financing facilities may contain, various affirmative and negative covenants, including maintenance of an interest coverage ratio and limitations on the incurrence of liens and indebtedness, investments, fundamental organizational changes, dispositions, changes in the nature of business, transactions with affiliates, use of proceeds and stock repurchases. In addition, the terms of our nonrecourse debt include restrictions and covenants, including limitations on our ability to transfer or incur liens on the assets that secure the debt. For further information see Managements Discussion and Analysis of Financial Condition and Results of OperationsCredit Facility and Nonrecourse Debt.
The covenants and restrictions included in our existing financings do, and the covenants and restrictions to be included in any future financings may, restrict our ability to, among other things:
| | incur or guarantee additional debt; |
| | make certain investments, originations or acquisitions; |
| | make distributions on or repurchase or redeem capital stock; |
| | engage in mergers or consolidations; |
| | reduce liquidity below certain levels; |
| | grant liens; |
| | incur operating losses for more than a specified period; and |
| | enter into transactions with affiliates. |
Our nonrecourse debt limits our ability to take action with regard to the assets pledged as security for the debt. These restrictions, as well as any other covenants contained in any future financings, may interfere with our ability to obtain financing, or to engage in other business activities, which may significantly limit or harm our business, financial condition, liquidity and results of operations. Our financing agreements may contain cross-default provisions, so that if a default occurs under any one agreement, the lenders under our other
- 34 -
Table of Contents
agreements could also declare a default. Although as of December 31, 2015, we were in compliance with all of the covenants in our existing credit facility and nonrecourse debt, a default and resulting repayment acceleration could significantly reduce our liquidity, which could require us to sell our assets to repay amounts due and outstanding. This could also significantly harm our business, financial condition, results of operations, and our ability to make distributions, which could cause the value of our common stock to decline and adversely affect our ability to qualify, or remain qualified, as a REIT. A default will also significantly limit our financing alternatives such that we will be unable to pursue our leverage strategy, which could curtail the returns on our assets.
We will have to pay off the remaining balance or refinance our borrowings when they become due. The failure to be able to pay off the remaining balance or refinance such borrowings or an increase in interest rates of such refinancing could have a material impact on our business.
Some of our borrowings will have a remaining balance when they become due. See Note 7 and 8 of our audited financial statements in this Form 10-K for more information on our borrowings. If our subsidiary is unable to repay or refinance the remaining balance of this debt, or if the terms of any available refinancing are not favorable, we may be forced to liquidate assets or incur higher costs which may significantly harm our business, financial condition, results of operations, and our ability to make distributions, which could cause the value of our common stock to decline.
If a counterparty to repurchase transactions defaults on its obligation to resell the underlying security back to us at the end of the transaction term, or if the value of the underlying security has declined as of the end of that term, or if we default on obligations under the repurchase agreement, we will lose money on repurchase transactions.
If we engage in repurchase transactions, we will generally sell loans or other financings to lenders (i.e., repurchase agreement counterparties) and receive cash from the lenders. The lenders will be obligated to resell the same financings back to us at the end of the term of the transaction. Because the cash we will receive from the lender when we initially sell the financing to the lender is less than its value (this difference is the haircut), if the lender defaults on its obligation to resell the same loans back to us we would incur a loss on the transaction equal to the amount of the haircut (assuming there was no other change in value). We would also lose money on a repurchase transaction if the value of the underlying loans has declined as of the end of the transaction term, as we would have to repurchase the loans for their initial value but would receive loans worth less than that amount. We may also be forced to sell assets at significantly depressed prices to meet margin calls, post additional collateral and maintain adequate liquidity, which could cause us to incur losses. Moreover, to the extent we are forced to sell assets at such time, given market conditions, we may be selling at the same time as others facing similar pressures, which could exacerbate a difficult market environment and which could result in our incurring significantly greater losses on our sale of such assets. In an extreme case of market duress, a market may not even be present for certain of our assets at any price. Such a situation would likely result in a rapid deterioration of our financial condition and possibly necessitate a filing for protection under the United States Bankruptcy Code (the Bankruptcy Code). Further, if we default on one of our obligations under a repurchase transaction, the lender will be able to terminate the transaction and cease entering into any other repurchase transactions with us. We expect that our repurchase agreements will contain cross-default provisions, so that if a default occurs under any one agreement, the lenders under our other agreements could also declare a default. If a default occurs under any of our repurchase agreements and the lenders terminate one or more of our repurchase agreements, we may need to enter into replacement repurchase agreements with different lenders. There can be no assurance that we will be successful in entering into such replacement repurchase agreements on the same terms as the repurchase agreements that were terminated or at all. Any losses we incur on our repurchase transactions could adversely affect our earnings and thus our cash available for distribution to our stockholders. In the event of our insolvency or bankruptcy, certain repurchase agreements may qualify for special treatment under the Bankruptcy Code, the effect of which, among other things, would be to allow the lender under the applicable repurchase agreement to avoid the automatic stay provisions of the Bankruptcy Code and to foreclose on the collateral agreement without delay, which could ultimately reduce the amounts we could otherwise recover.
- 35 -
Table of Contents
Risks Related to Hedging
We, or the projects in which we invest, enter into hedging transactions that could expose us to contingent liabilities in the future and adversely impact our financial condition.
Subject to maintaining our qualification as a REIT, part of our strategy, or the strategy of the projects in which we invest, involves entering into hedging transactions that could require us to fund cash payments in certain circumstances (e.g., the early termination of the hedging instrument caused by an event of default or other early termination event, or the decision by a counterparty to request margin securities it is contractually owed under the terms of the hedging instrument). The amount due would be equal to the unrealized loss of the open swap positions with the respective counterparty and could also include other fees and charges. These economic losses will be reflected in our, or the projects, results of operations, and our, or the projects, ability to fund these obligations will depend on the liquidity of our, or the projects, assets and access to capital at the time, and the need to fund these obligations could adversely impact our financial condition.
We have limited experience hedging the interest rate or commodity risk of our assets and such hedging may adversely affect our results of operations.
We have limited experience hedging the interest rate or commodity risk of our assets, as the holders of the notes issued by trusts or vehicles and collateralized by our projects historically managed this risk. However, as part of our strategy, we may pursue various hedging strategies to seek to reduce our exposure to adverse changes in interest rates or commodity prices. Our hedging activity will vary in scope based on the level and volatility of interest rates or the underlying commodity, the type of assets held and other changing market conditions. Interest rate or commodity hedging may fail to protect or could adversely affect us because, among other things:
| | our hedging strategies may be poorly designed or improperly executed resulting from our limited experience hedging the interest rate or commodity risk of our assets; |
| | interest rate or commodity hedging can be expensive, particularly during periods of rising and volatile interest rates or commodity prices; |
| | available interest rate or commodity hedges may not correspond directly with the interest rate or commodity risk for which protection is sought; |
| | the duration of the hedge may not match the duration of the related liability or exposure; |
| | the amount of income that a REIT may earn from certain hedging transactions (other than through taxable REIT subsidiaries, or TRSs), to offset interest rate losses is limited by U.S. federal tax provisions governing REITs; |
| | the credit quality of the hedging counterparty owing money on the hedge may be downgraded to such an extent that it impairs our ability to sell or assign our side of the hedging transaction; |
| | the hedging counterparty owing money in the hedging transaction may default on its obligation to pay; and |
| | our hedging transactions, which are intended to limit losses, may actually adversely affect our earnings, which could reduce our cash available for distribution to our stockholders. |
In addition, over-the-counter hedges entered into to hedge interest rates or commodity prices involve risk since they often are not traded on regulated exchanges or cleared through a central counterparty. We would remain exposed to our counterpartys ability to performance perform its obligations under each hedge and cannot look to the creditworthiness of a central counterparty for performance. As a result, if a hedging counterparty cannot perform under the terms of the hedge, we would not receive payments due under that hedge, we may lose any unrealized gain associated with the hedge and the hedged liability would cease to be hedged. While we would seek to terminate the relevant hedge transaction and may have a claim against the defaulting counterparty
- 36 -
Table of Contents
for any losses, including unrealized gains, there is no assurance that we would be able to recover such amounts or to replace the relevant hedge on economically viable terms or at all. In such case, we could be forced to cover our unhedged liabilities at the then current market price. We may also be at risk for any collateral we have pledged to secure our obligations under the hedge if the counterparty becomes insolvent or files for bankruptcy.
Furthermore, our interest rate swaps and other hedge transactions are subject to increasing statutory and other regulatory requirements and, depending on the identity of the counterparty, applicable international requirements. Recently, new regulations have been promulgated by U.S. and foreign regulators to strengthen the oversight of swaps, and any further actions taken by such regulators could constrain our strategy or increase our costs, either of which could materially and adversely impact our results of operations.
In addition, the DoddFrank Wall Street Reform and Consumer Protection Act requires certain derivatives, including certain interest rate swaps, to be executed on a regulated market and cleared through a central counterparty. Unlike over-the-counter swaps, the counterparty for the cleared swaps is the clearing house, which reduces counterparty risk. However, cleared swaps require us to appoint clearing brokers and to post margin in accordance with the clearing houses rules, which has resulted in increased costs for cleared swaps compared to over-the-counter swaps. Our over-the-counter hedges with swap dealers will become subject to margin regulations promulgated by U.S. regulators on March 1, 2017, which regulations are expected to increase the required margin, and the cost to us of over-the-counter swaps. The margin requirements for both cleared and uncleared swaps also limit eligible margin to cash and specified types of securities, which may further increase the costs of hedging and induce us to change or reduce the use of hedging transactions. The margin regulations are not expected to apply to any over-the-counter swaps that were entered into prior to the effective date of such regulations.
In addition, the projects in which we invest, may enter into various forms of hedging including interest rate and power price hedging. To the extent they enter into such hedges, the financial results of the project will be exposed to similar risks as described above which could adversely impact our results of operations.
If we choose not to pursue, or fail to qualify for, hedge accounting treatment, our operating results may suffer because losses on the derivatives that we enter into may not be offset by a change in the fair value of the related hedged transaction.
We may choose not to pursue, or fail to qualify for, hedge accounting treatment relating to derivative and hedging transactions. We may fail to qualify for hedge accounting treatment for a number of reasons, including if we use instruments that do not meet the Accounting Standards Codification (ASC) Topic 815 definition of a derivative (such as short sales), we fail to satisfy ASC Topic 815 hedge documentation and hedge effectiveness assessment requirements or our instruments are not highly effective. If we fail to qualify for, or choose not to pursue, hedge accounting treatment, our operating results may suffer because losses on the derivatives that we enter into may not be offset by a change in the fair value of the related hedged transaction.
Risks Related to Our Common Stock
There can be no assurance that an active trading market for our common stock will continue, which could cause our common stock to trade at a discount and make it difficult for holders of our common stock to sell their shares.
Our common stock is listed on the NYSE. However, there can be no assurance that an active trading market for our common stock will continue, which could cause our common stock to trade at a discount. Accordingly, no assurance can be given as to the ability of our stockholders to sell their common stock or the price that our stockholders may obtain for their common stock. Some of the factors that could negatively affect the market price of our common stock include:
| | our actual or projected operating results, financial condition, cash flows and liquidity or changes in business strategy or prospects; |
- 37 -
Table of Contents
| | changes in the mix of our financing products and services, including the level of securitizations or fee income in any quarter; |
| | actual or perceived conflicts of interest with individuals, including our executives; |
| | our ability to arrange financing for projects; |
| | equity issuances by us, or share resales by our stockholders, or the perception that such issuances or resales may occur; |
| | seasonality in construction and demand for our financial solutions; |
| | actual or anticipated accounting problems; |
| | publication of research reports about us or the sustainable infrastructure industry; |
| | changes in market valuations of similar companies; |
| | adverse market reaction to any increased indebtedness we may incur in the future; |
| | commodity price changes; |
| | interest rate changes; |
| | additions to or departures of our key personnel; |
| | speculation in the press or investment community; |
| | our failure to meet, or the lowering of, our earnings estimates or those of any securities analysts; |
| | increases in market interest rates, which may lead investors to demand a higher distribution yield for our common stock, and would result in increased interest expenses on our debt; |
| | changes in governmental policies, regulations or laws; |
| | failure to qualify, or maintain our qualification, as a REIT or failure to maintain our exception from registration as an investment company under the 1940 Act; |
| | price and volume fluctuations in the stock market generally; and |
| | general market and economic conditions, including the current state of the credit and capital markets. |
Market factors unrelated to our performance could also negatively impact the market price of our common stock. One of the factors that investors may consider in deciding whether to buy or sell our common stock is our distribution rate as a percentage of our stock price relative to market interest rates. If market interest rates increase, prospective investors may demand a higher distribution rate or seek alternative investments paying higher dividends or interest. As a result, interest rate fluctuations and conditions in capital markets can affect the market value of our common stock.
Common stock and preferred stock eligible for future sale may have adverse effects on our share price.
Subject to applicable law, our board of directors, without stockholder approval, may authorize us to issue additional authorized and unissued shares of common stock and preferred stock on the terms and for the consideration it deems appropriate.
In addition, we entered into a registration rights agreement pursuant to which we granted registration rights to those persons who received common stock (including common stock issuable upon exchange of units of limited partnership interests in our Operating Partnership (OP units)) in our formation transactions. On August 27, 2014, the SEC declared effective the registration statement, which covers the resale of 3,178,410 shares of our common stock (including 331,282 shares of common stock issuable upon exchange of an equivalent number of OP units). In certain circumstances, the registration rights agreement also requires us to provide piggyback and underwritten offering demand rights to those holders who received common stock (including common stock issuable upon exchange of OP units) in our formation transactions.
- 38 -
Table of Contents
We cannot predict the effect, if any, of future sales of our common stock or the availability of shares for future sales, on the market price of our common stock. Sales of substantial amounts of common stock or the perception that such sales could occur may adversely affect the prevailing market price for our common stock.
We cannot assure you of our ability to make distributions in the future. If our portfolio of assets fails to generate sufficient income and cash flow, we could be required to sell assets, borrow funds or make a portion of our distributions in the form of a taxable stock distribution or distribution of debt securities.
We are generally required to distribute to our stockholders at least 90% of our REIT taxable income (without regard to the deduction for dividends paid and excluding net capital gains) each year for us to qualify, and maintain our qualification, as a REIT under the Internal Revenue Code of 1986, as amended (the Internal Revenue Code). Our current policy is to pay quarterly distributions, which on an annual basis will equal all or substantially all of our taxable income. In the event that our board of directors authorizes distributions in excess of the income or cash flow generated from our assets, we may make such distributions from the proceeds of future offerings of equity or debt securities or other forms of debt financing or the sale of assets.
Our ability to make distributions may be adversely affected by a number of factors. Therefore, although we anticipate making quarterly distributions to our stockholders, our board of directors has the sole discretion to determine the timing, form and amount of any distributions to our stockholders. If our portfolio of assets fails to generate sufficient income and cash flow, we could be required to sell assets, borrow funds or make a portion of our distributions in the form of a taxable stock distribution or distribution of debt securities. To the extent that we are required to sell assets in adverse market conditions or borrow funds at unfavorable rates, our results of operations could be materially and adversely affected. Our board of directors will make determinations regarding distributions based upon various factors, including our earnings, our financial condition, our liquidity, our debt and preferred stock covenants, maintenance of our REIT qualification, applicable provisions of the MGCL and other factors as our board of directors may deem relevant from time to time. We believe that a change in any one of the following factors could adversely affect our results of operations and impair our ability to make distributions to our stockholders:
| | our ability to make profitable investments and loans; |
| | margin calls or other expenses that reduce our cash flow; |
| | defaults in our asset portfolio or decreases in the value of our portfolio; and |
| | the fact that anticipated operating expense levels may not prove accurate, as actual results may vary from estimates. |
As a result, no assurance can be given that we will be able to make distributions to our stockholders at any time in the future or that the level of any distributions we do make to our stockholders will achieve a market yield or increase or even be maintained over time, any of which could materially and adversely affect us.
In addition, distributions that we make to our stockholders will generally be taxable to our stockholders as ordinary income. However, a portion of our distributions may be designated by us as long-term capital gains to the extent that they are attributable to capital gain income recognized by us or may constitute a return of capital to the extent that they exceed our earnings and profits as determined for tax purposes. A return of capital is not taxable, but has the effect of reducing the basis of a stockholders investment in shares of our common stock.
Future offerings of debt or equity securities, which may rank senior to our common stock, may adversely affect the market price of our common stock.
Our present debt ranks, and any future debt would rank, senior to our common stock. Such debt is, and likely will be, governed by a loan agreement, an indenture or other instrument containing covenants restricting our operating flexibility. Additionally, any equity securities or convertible or exchangeable securities that we issue in
- 39 -
Table of Contents
the future may have rights, preferences and privileges more favorable than those of our common stock and may result in dilution to owners of our common stock. We and, indirectly, our stockholders will bear the cost of issuing and servicing such debt or securities. Because our decision to issue debt or equity securities in any future offering will depend on market conditions and other factors beyond our control, we cannot predict or estimate the amount, timing or nature of our future offerings. Thus, holders of our common stock will bear the risk of our future offerings reducing the market price of our common stock and diluting the value of their stock holdings in us.
Risks Related to Our Organization and Structure
Our business could be harmed if key personnel terminate their employment with us.
Our success depends, to a significant extent, on the continued services of Jeffrey Eckel, Brendan Herron, Steven Chuslo, Rhem Wooten, Nate Rose, Daniel McMahon and the other members of our senior management team. Upon completion of our IPO and our formation transactions, several of our officers, including Jeffrey Eckel, our chief executive officer, Brendan Herron, our executive vice president and chief financial officer, Steven Chuslo, our executive vice president and general counsel, Rhem Wooten and Daniel McMahon, our executive vice presidents, and Nate Rose, our executive vice president and chief operating officer, entered into new employment agreements with us. These employment agreements provide for an initial four-year term of employment. Notwithstanding these agreements, there can be no assurance that any or all of these members of our senior management team will remain employed by us. We do not maintain key person life insurance on any of our officers other than two policies we maintain for Mr. Eckel under which we are a named beneficiary in the amount of approximately $3 million. The loss of services of one or more members of our senior management team could harm our business and our prospects.
Conflicts of interest could arise as a result of our structure.
Conflicts of interest could arise in the future as a result of the relationships between us and our affiliates, on the one hand, and our Operating Partnership or any partner thereof, on the other. Our directors and officers have duties to our company under applicable Maryland law in connection with our management. At the same time, we have fiduciary duties, as a general partner, to our Operating Partnership and to our limited partners under Delaware law in connection with the management of our Operating Partnership. Our duties, as the general partner, to our Operating Partnership and our partners may come into conflict with the duties of our directors and officers to us.
Unless otherwise provided for in the relevant partnership agreement, Delaware law generally requires a general partner of a Delaware limited partnership to adhere to fiduciary duty standards under which it owes its limited partners the highest duties of good faith, fairness and loyalty and which generally prohibit such general partner from taking any action or engaging in any transaction as to which it has a conflict of interest.
Additionally, the partnership agreement of our Operating Partnership expressly limits our liability by providing that neither we, as the general partner of the Operating Partnership, nor any of our directors or officers, will be liable or accountable in damages to our Operating Partnership, its limited partners or their assignees for errors in judgment, mistakes of fact or law or for any act or omission if the general partner, director or officer, acted in good faith. In addition, our Operating Partnership is required to indemnify us, our affiliates and each of our and their respective officers, directors, employees and agents to the fullest extent permitted by applicable law against any and all losses, claims, damages, liabilities (whether joint or several), expenses (including, without limitation, attorneys fees and other legal fees and expenses), judgments, fines, settlements and other amounts arising from any and all claims, demands, actions, suits or proceedings, civil, criminal, administrative or investigative, that relate to the operations of the Operating Partnership, provided that our Operating Partnership will not indemnify any such person for (1) willful misconduct or a knowing violation of the law, (2) any
- 40 -
Table of Contents
transaction for which such person received an improper personal benefit in violation or breach of any provision of the partnership agreement of our Operating Partnership, or (3) in the case of a criminal proceeding, the person had reasonable cause to believe the act or omission was unlawful.
The provisions of Delaware law that allow the common law fiduciary duties of a general partner to be modified by a partnership agreement have not been resolved in a court of law, and we have not obtained an opinion of counsel covering the provisions set forth in the partnership agreement of our Operating Partnership that purport to waive or restrict our fiduciary duties that would be in effect under common law were it not for the partnership agreement of our Operating Partnership.
Certain provisions of Maryland law could inhibit changes in control.
Certain provisions of the MGCL may have the effect of deterring a third party from making a proposal to acquire us or of impeding a change in control under circumstances that otherwise could provide the holders of our common stock with the opportunity to realize a premium over the then-prevailing market price of our common stock. We are subject to the business combination provisions of the MGCL that, subject to limitations, prohibit certain business combinations (including a merger, consolidation, statutory share exchange, or, in circumstances specified in the statute, an asset transfer or issuance or reclassification of equity securities) between us and an interested stockholder (defined generally as any person who beneficially owns 10% or more of our then outstanding voting stock or an affiliate or associate of ours who, at any time within the two-year period prior to the date in question, was the beneficial owner of 10% or more of our then outstanding voting stock) or an affiliate thereof for five years after the most recent date on which the stockholder becomes an interested stockholder. After the five-year prohibition, any business combination between us and an interested stockholder generally must be recommended by our board of directors and approved by the affirmative vote of at least (1) 80% of the votes entitled to be cast by holders of outstanding shares of our voting stock and (2) two thirds of the votes entitled to be cast by holders of our voting stock other than shares held by the interested stockholder with whom or with whose affiliate the business combination is to be effected or held by an affiliate or associate of the interested stockholder. These super-majority vote requirements do not apply if, among other conditions, our common stockholders receive a minimum price, as defined under the MGCL, for their shares in the form of cash or other consideration in the same form as previously paid by the interested stockholder for its shares. These provisions of the MGCL do not apply, however, to business combinations that are approved or exempted by a board of directors prior to the time that the interested stockholder becomes an interested stockholder. Our board of directors has by resolution exempted business combinations between us and (1) any other person, provided, that such business combination is first approved by our board of directors (including a majority of our directors who are not affiliates or associates of such person), (2) the Predecessor and its affiliates and associates as part of our formation transactions and (3) persons acting in concert with any of the foregoing. As a result, any person described in the preceding sentence may be able to enter into business combinations with us that may not be in the best interests of our stockholders, without compliance by our company with the supermajority vote requirements and other provisions of the statute. There can be no assurance that our board of directors will not amend or revoke the exemption at any time.
The control share provisions of the MGCL provide that, subject to certain exceptions, a holder of control shares of a Maryland corporation (defined as shares which, when aggregated with all other shares controlled by the stockholder (except solely by virtue of a revocable proxy), entitle the stockholder to exercise one of three increasing ranges of voting power in electing directors) acquired in a control share acquisition (defined as the direct or indirect acquisition of ownership or control of issued and outstanding control shares) has no voting rights with respect to such shares except to the extent approved by our stockholders by the affirmative vote of at least two thirds of all the votes entitled to be cast on the matter, excluding votes entitled to be cast by the acquirer of control shares, our officers and our directors who are also our employees. Our bylaws contain a provision exempting from the control share acquisition statute any and all acquisitions by any person of shares of our stock. There can be no assurance that this provision will not be amended or eliminated at any time in the future.
- 41 -
Table of Contents
The unsolicited takeover provisions of Title 3, Subtitle 8 of the MGCL permit our board of directors, without stockholder approval and regardless of what is currently provided in our charter or bylaws, to implement certain takeover defenses, some of which (for example, a classified board) we do not yet have. Our charter contains a provision whereby we have elected to be subject to the provisions of Title 3, Subtitle 8 of the MGCL, pursuant to which our board of directors has the exclusive power to fill vacancies on our board of directors. These provisions may have the effect of inhibiting a third party from making an acquisition proposal for us or of delaying, deferring or preventing a change in control of us under the circumstances that otherwise could provide the holders of shares of common stock with the opportunity to realize a premium over the then current market price.
Our authorized but unissued shares of common and preferred stock may prevent a change in our control.
Our charter permits our board of directors to authorize us to issue additional shares of our authorized but unissued common or preferred stock. In addition, our board of directors may, without common stockholder approval, amend our charter to increase the aggregate number of our shares of stock or the number of shares of stock of any class or series that we have the authority to issue and classify or reclassify any unissued shares of common or preferred stock and set the terms of the classified or reclassified shares. As a result, our board of directors may establish a series of common or preferred stock that could delay or prevent a transaction or a change in control that might involve a premium price for shares of our common stock or otherwise be in the best interest of our stockholders.
Our rights and the rights of our stockholders to take action against our directors and officers are limited, which could limit stockholder recourse in the event of actions not in our stockholders best interests.
Our charter eliminates the liability of our present and former directors and officers to us and our stockholders for money damages to the maximum extent permitted under Maryland law. Under Maryland law, our present and former directors and officers will not have any liability to us or our stockholders for money damages other than liability resulting from:
| | actual receipt of an improper benefit or profit in money, property or services; or |
| | active and deliberate dishonesty by the director or officer that was established by a final judgment and was material to the cause of action adjudicated. |
Our charter authorizes us to indemnify our directors and officers for actions taken by them in those and other capacities to the maximum extent permitted by Maryland law. Our bylaws require us to indemnify each present and former director or officer, and each person who served any predecessor of our company, including the Predecessor, in a similar capacity, to the maximum extent permitted by Maryland law, in connection with the defense of any proceeding to which he or she is made, or threatened to be made, a party or a witness by reason of his or her service to us or any predecessor. In addition, we may be obligated to pay or reimburse the expenses incurred by such persons in connection with any such proceedings without requiring a preliminary determination of their ultimate entitlement to indemnification.
Our charter contains provisions that make removal of our directors difficult, which could make it difficult for our stockholders to effect changes to our management.
Our charter provides that, subject to the rights of holders of any series of preferred stock, a director may be removed with or without cause upon the affirmative vote of holders of at least two thirds of the votes entitled to be cast generally in the election of directors. Vacancies may be filled only by a majority of the remaining directors in office, even if less than a quorum. These requirements make it more difficult to change our management by removing and replacing directors and may prevent a change in control of our company that is in the best interests of our stockholders.
- 42 -
Table of Contents
Ownership limitations may restrict change of control or business combination opportunities in which our stockholders might receive a premium for their shares.
In order for us to qualify as a REIT for each taxable year after 2013, no more than 50% in value of our outstanding capital stock may be owned, directly or constructively, by five or fewer individuals during the last half of any calendar year, and at least 100 persons must beneficially own our stock during at least 335 days of a taxable year of 12 months, or during a proportionate portion of a shorter taxable year. Individuals for this purpose include natural persons, private foundations, some employee benefit plans and trusts, and some charitable trusts. To assist us in preserving our REIT qualification, among other purposes, our charter generally prohibits any person from directly or indirectly owning more than 9.8% in value or in number of shares, whichever is more restrictive, of the aggregate outstanding shares of our capital stock, the outstanding shares of any class or series of our preferred stock or the outstanding shares of our common stock. These ownership limits could have the effect of discouraging a takeover or other transaction in which holders of our common stock might receive a premium for their shares over the then prevailing market price or which holders might believe to be otherwise in their best interests. Our board of directors has established exceptions from these ownership limits that permit certain institutional investors and their clients to hold shares of our common stock in excess of these ownership limits.
We are subject to financial reporting and other requirements for our accounting, internal audit and other management systems and resources and the failure to comply with such requirements may adversely effect our business, operating results and stock price.
We are subject to reporting and other obligations under the Exchange Act, including the requirements of Section 404 of the Sarbanes-Oxley Act of 2002 (the Sarbanes-Oxley Act). Section 404 requires annual management assessments of the effectiveness of our internal controls over financial reporting and, after we are no longer an Emerging Growth Company for purposes of the Jumpstart Our Business Startups Act (the JOBS Act), our independent registered public accounting firm to express an opinion on the effectiveness of our internal controls over financial reporting. To the extent applicable, these reporting and other obligations place or will place significant demands on our management, administrative, operational, internal audit and accounting resources and will cause us to incur significant expenses. We may need to upgrade our systems or create new systems; implement additional financial and management controls, reporting systems and procedures; expand or outsource our internal audit function; and hire additional accounting, internal audit and finance staff. If we are unable to accomplish these objectives in a timely and effective fashion, our ability to comply with the financial reporting requirements and other rules that apply to reporting companies could be impaired. We believe that we have in place, or will have in place at the end of any applicable phase-in periods permitted by the NYSE, the SEC and the JOBS Act, accounting, internal audit and other management systems and resources that will allow us to maintain compliance with the requirements of the Sarbanes-Oxley Act. Any failure to maintain effective internal controls could have a material adverse effect on our business, operating results and stock price.
Pursuant to the JOBS Act, we are eligible to take advantage of certain specified reduced disclosure and other requirements that are otherwise generally applicable to public companies for so long as we are an emerging growth company.
We are an emerging growth company as defined in the JOBS Act and we are eligible to take advantage of certain specified reduced disclosure and other requirements that are otherwise generally applicable to public companies that are not emerging growth companies including, but not limited to, not being required to comply with the auditor attestation requirements of Section 404 of the Sarbanes-Oxley Act, reduced disclosure obligations regarding executive compensation in our periodic reports and proxy statements, and exemptions from the requirements of holding a nonbinding advisory vote on executive compensation and stockholder approval of any golden parachute payments not previously approved. We may take advantage of these exemptions for up to five years or such earlier time that we are no longer an emerging growth company. We would cease to be an
- 43 -
Table of Contents
emerging growth company if we have more than $1 billion in annual gross revenues, we have more than $700 million in market value of our stock held by non-affiliates, or we issue more than $1 billion of non-convertible debt over a three-year period. If we do take advantage of any or all of these exceptions, we cannot predict if some investors will find our common stock less attractive because we will rely on these exemptions. The result may be a less active trading market for our common stock and our stock price may be more volatile.
Risks Related to Our Taxation as a REIT
Qualifying as a REIT involves highly technical and complex provisions of the Internal Revenue Code, and our failure to qualify or remain qualified as a REIT would subject us to U.S. federal income tax and applicable state and local tax, which would negatively impact the results of our operations and reduce the amount of cash available for distribution to our stockholders.
We elected and qualified as a REIT for U.S. federal income tax purposes commencing with our taxable year ended December 31, 2013. The U.S. federal income tax laws governing REITs are complex, and judicial and administrative interpretations of the U.S. federal income tax laws governing REIT qualification are limited. To qualify as a REIT and remain so qualified, we must meet, on an ongoing basis through actual operating results, various tests regarding the nature and diversification of our assets and our income, the ownership of our outstanding shares, and the amount of our distributions. Even a technical or inadvertent violation could jeopardize our REIT qualification. Our ability to satisfy the asset tests depends upon our analysis of the characterization and fair market values of our assets, some of which are not susceptible to a precise determination, and for which we will not obtain independent appraisals.
We intend to continue to treat a substantial portion of our existing assets and any similar assets that we may in the future have an interest in as qualifying real estate assets for purposes of the REIT asset tests, and intend to continue to treat the income derived from such assets as interest income qualifying under the 75% gross income test. We received a private letter ruling from the Internal Revenue Service (IRS) relating to our ability to treat certain of our assets as qualifying REIT assets to the extent they fall within the scope of such private letter ruling. We are entitled to rely upon this ruling for those assets which fit within the scope of the ruling only to the extent that we have the legal and contractual rights described therein and did not misstate or omit in the ruling request a relevant fact and that we continue to operate in the future in accordance with the relevant facts described in such request, and no assurance can be given that we will always be able to do so.
If we were not able to treat the interest income that we receive as qualifying income for purposes of the REIT gross income tests, we would be required to restructure the manner in which we receive such income and we may realize significant income that does not qualify for the REIT 75% gross income test, which could cause us to fail to qualify as a REIT. In addition, our compliance with the REIT income and quarterly asset requirements also depends upon our ability to successfully manage the composition of our income and assets on an ongoing basis in accordance with existing REIT regulations and rules and interpretations thereof. Moreover, the IRS, new legislation, court decisions or other administrative guidance, in each case possibly with retroactive effect, may make it more difficult or impossible for us to qualify as a REIT.
In addition, our ability to satisfy the requirements to qualify as a REIT depends in part on the actions of third parties over which we have no control or only limited influence, including in cases where we own an equity interest in an entity that is classified as a partnership for U.S. federal income tax purposes. Thus, while we intend to operate so that we will qualify as a REIT, given the highly complex nature of the rules governing REITs, the ongoing importance of factual determinations, and the possibility of future changes in our circumstances, no assurance can be given that we will so qualify for any particular year.
If we fail to qualify as a REIT in any taxable year, and we do not qualify for certain statutory relief provisions, we would be required to pay U.S. federal income tax on our taxable income, and distributions to our
- 44 -
Table of Contents
stockholders would not be deductible by us in determining our taxable income. In such a case, we might need to borrow money or sell assets in order to pay our taxes. Our payment of income tax would negatively impact the results of our operations and decrease the amount of our income available for distribution to our stockholders. Furthermore, if we fail to maintain our qualification as a REIT, we no longer would be required to distribute substantially all of our taxable income to our stockholders. In addition, unless we were eligible for certain statutory relief provisions, we could not re-elect to qualify as a REIT for the subsequent four taxable years following the year in which we failed to qualify.
Complying with REIT requirements may force us to liquidate or forego otherwise attractive investments.
To qualify as a REIT, we must ensure that we meet the REIT gross income tests annually and that, at the end of each calendar quarter, at least 75% of the value of our total assets consists of cash, cash items, government securities, shares in REITs and other qualifying real estate assets. The remainder of our investment in securities (other than government securities and REIT qualified real estate assets) generally cannot include more than 10% of the outstanding voting securities of any one issuer or more than 10% of the total value of the outstanding securities of any one issuer. In addition, in general, no more than 5% of the value of our total assets (other than government securities, securities of a TRS and securities that are qualifying real estate assets) can consist of the securities of any one issuer, and no more than 25% (20% beginning with the taxable year ending December 31, 2018) of the value of our total assets can be represented by securities of one or more TRSs, and no more than 25% of the value of our assets can consist of debt instruments issued by publicly offered REITs that are not otherwise secured by real property. If we fail to comply with these requirements at the end of any calendar quarter, we must correct the failure within 30 days after the end of the calendar quarter or qualify for certain statutory relief provisions to avoid losing our REIT qualification and suffering adverse tax consequences. As a result, we may be required to liquidate from our portfolio, or contribute to a TRS, otherwise attractive investments, and may be unable to pursue investments that would be otherwise advantageous to us in order to satisfy the source of income or asset diversification requirements for qualifying as a REIT. These actions could have the effect of reducing our income and amounts available for distribution to our stockholders.
REIT distribution requirements could adversely affect our ability to execute our business plan and may require us to incur debt or sell assets to make such distributions.
In order to qualify as a REIT, we must distribute to our stockholders, each calendar year, at least 90% of our REIT taxable income (including certain items of non-cash income), determined without regard to the deduction for dividends paid and excluding net capital gain. To the extent that we satisfy the 90% distribution requirement, but distribute less than 100% of our taxable income, we will be subject to U.S. federal corporate income tax on our undistributed income. In addition, we will incur a 4% non-deductible excise tax on the amount, if any, by which our distributions in any calendar year are less than a minimum amount specified under U.S. federal income tax laws. We intend to distribute our taxable income to our stockholders in a manner intended to satisfy the REIT 90% distribution requirement and to avoid the 4% non-deductible excise tax.
In addition, differences in timing between the recognition of taxable income, our U.S. GAAP income and the actual receipt of cash may occur. For example, we may be required to accrue interest and discount income on debt securities or interests in debt securities before we receive any payments of interest or principal on such assets, and there may be timing differences in the accrual of such interest and discount income for tax purposes and for U.S. GAAP purposes.
As a result of the foregoing, we may generate less cash flow than taxable income in a particular year and find it difficult or impossible to meet the REIT distribution requirements in certain circumstances. In such circumstances, we may be required to: (i) sell assets in adverse market conditions, (ii) borrow on unfavorable terms, (iii) distribute amounts that would otherwise be invested in future acquisitions, capital expenditures or repayment of debt, (iv) make a taxable distribution of our shares as part of a distribution in which stockholders
- 45 -
Table of Contents
may elect to receive shares or (subject to a limit measured as a percentage of the total distribution) cash or (v) use cash reserves, in order to comply with the REIT distribution requirements and to avoid U.S. federal corporate income tax and the 4% non-deductible excise tax. Thus, compliance with the REIT distribution requirements may hinder our ability to grow, which could adversely affect the value of our common stock.
Even if we qualify as a REIT, we may face tax liabilities that reduce our cash flow.
Even if we qualify for taxation as a REIT, we may be subject to certain U.S. federal, state and local taxes on our income and assets, including taxes on any undistributed income, tax on income from some activities conducted as a result of a foreclosure, and state or local income, franchise, property and transfer taxes, including mortgage recording taxes. In addition, any TRSs we own will be subject to U.S. federal, state and local corporate income or franchise taxes. In order to meet the REIT qualification requirements, or to avoid the imposition of a 100% tax that applies to certain gains derived by a REIT from sales of inventory or property held primarily for sale to customers in the ordinary course of business, we may hold some of our assets through TRSs. Any taxes paid by such TRSs would decrease the cash available for distribution to our stockholders.
The failure of assets subject to a repurchase agreement to be considered owned by us or a mezzanine loan to qualify as a real estate asset may adversely affect our ability to qualify as a REIT.
We may enter into repurchase agreements under which we will nominally sell certain of our assets to a counterparty and simultaneously enter into an agreement to repurchase the sold assets. We believe that we will be treated for U.S. federal income tax purposes as the owner of the assets that are the subject of any such agreements and that the repurchase agreements will be treated as secured lending transactions notwithstanding that such agreements may transfer record ownership of the assets to the counterparty during the term of the agreement. It is possible, however, that the IRS could assert that we did not own the assets during the term of the repurchase agreement, in which case we could fail to qualify as a REIT.
In addition, we may acquire mezzanine loans, which are loans secured by equity interests in a partnership or limited liability company that directly or indirectly owns real property. In IRS Revenue Procedure 2003-65, the IRS provided a safe harbor pursuant to which a mezzanine loan, if it meets each of the requirements contained in the Revenue Procedure, will be treated by the IRS as a real estate asset for purposes of the REIT asset tests, and interest derived from the mezzanine loan will be treated as qualifying mortgage interest for purposes of the REIT 75% gross income test. Although IRS Revenue Procedure 2003-65 provides a safe harbor on which taxpayers may rely, it does not prescribe rules of substantive tax law. We may acquire mezzanine loans that may not meet all of the requirements for reliance on this safe harbor. In the event we own a mezzanine loan that does not meet the safe harbor, the IRS could challenge such loans treatment as a real estate asset for purposes of the REIT asset and income tests, and if such a challenge were sustained, we could fail to qualify as a REIT.
We may be required to report taxable income for certain investments in excess of the economic income we ultimately realize from them.
To the extent we acquire debt instruments in the secondary market for less than their face amount, the amount of such discount will generally be treated as market discount for U.S. federal income tax purposes. We expect to accrue market discount on the basis of a constant yield to maturity of a debt instrument. Accrued market discount is reported as income when, and to the extent that, any payment of principal of the debt instrument is made, unless we elect to include accrued market discount in income as it accrues. Principal payments on certain loans are made monthly, and consequently accrued market discount may have to be included in income each month as if the debt instrument were assured of ultimately being collected in full. If we collect less on the debt instrument than our purchase price plus the market discount we had previously reported as income, we may not be able to benefit from any offsetting loss deductions.
- 46 -
Table of Contents
Similarly, some of the debt instruments that we acquire may have been issued with original issue discount. We will be required to report such original issue discount based on a constant yield method and will be taxed based on the assumption that all future projected payments due on such debt instruments will be made. If such debt instruments turn out not to be fully collectible, an offsetting loss deduction will become available only in the later year that uncollectability is provable. In addition, in the event that any debt instruments acquired by us are delinquent as to mandatory principal and interest payments, or in the event payments with respect to a particular debt instrument are not made when due, we may nonetheless be required to continue to recognize the unpaid interest as taxable income as it accrues, despite doubt as to its ultimate collectability. While we would in general ultimately have an offsetting loss deduction available to us when such interest was determined to be uncollectible, the utility of that deduction could depend on our having taxable income in that later year or thereafter. Although we do not presently intend to, we may, in the future, acquire debt investments that are subsequently modified by agreement with the borrower. If such amendments are significant modifications under the applicable Treasury Regulations, we may be required to recognize taxable income as a result of such amendments. Finally, we may be required under the terms of indebtedness that we incur with private lenders to use cash received from interest payments to make principal payments on that indebtedness, with the effect of recognizing income but not having a corresponding amount of cash available for distribution to our stockholders.
The interest apportionment rules under Treasury Regulation Section 1.856-5(c) provide that, if a loan is secured by both real property and other property, a REIT is required to apportion its annual interest income to the real property securing the loan based on a fraction, the numerator of which is the value of such real property, determined when the REIT commits to acquire the loan, and the denominator of which is the highest principal amount of the loan during the year. Beginning in 2016, if a mortgage loan is secured by both real property and personal property and the value of the personal property does not exceed 15% of the aggregate value of the property securing the mortgage loan, the mortgage loan is treated as secured solely by real property for this purpose. IRS Revenue Procedure 2014-51 interprets the principal amount of the loan to be the face amount of the loan, despite the Internal Revenue Code requiring taxpayers to treat any market discount, that is the difference between the purchase price of the loan and its face amount, for all purposes (other than certain withholding and information reporting purposes) as interest rather than principal. The interest apportionment regulations apply only if the loan in question is secured by both real property and other property and, beginning in 2016, the value of personal property securing the mortgage exceeds 15% of the aggregate value of the property securing the mortgage.
If the IRS were to assert successfully that our loans were secured by property other than real estate, the interest apportionment rules applied for purposes of our REIT testing, and that the position taken in IRS Revenue Procedure 2014-51 should be applied to certain loans in our portfolio, then depending upon the value of the real property securing our loans and their face amount, and the sources of our gross income generally, we may fail to meet the 75% REIT gross income test. If we do not meet this test, we could potentially lose our REIT qualification or be required to pay a penalty to the IRS.
The taxable mortgage pool rules may increase the taxes that we or our stockholders may incur, and may limit the manner in which we effect future securitizations.
Securitizations by us or our subsidiaries could result in the creation of taxable mortgage pools for U.S. federal income tax purposes. As a result, we could have excess inclusion income. Certain categories of stockholders, such as non-U.S. stockholders eligible for treaty or other benefits, U.S. stockholders with net operating losses, and certain U.S. tax-exempt stockholders that are subject to unrelated business income tax, could be subject to increased taxes on a portion of their dividend income from us that is attributable to any such excess inclusion income. In the case of a stockholder that is a REIT, a regulated investment company (a RIC) common trust fund or other pass-through entity, our allocable share of our excess inclusion income could be considered excess inclusion income of such entity. In addition, to the extent that our common stock is owned by U.S. tax-exempt disqualified organizations, such as certain government-related entities and charitable remainder trusts that are not subject to tax on unrelated business income, we may incur a corporate level tax on a
- 47 -
Table of Contents
portion of any excess inclusion income. Because this tax generally would be imposed on us, all of our stockholders, including stockholders that are not disqualified organizations, generally will bear a portion of the tax cost associated with the classification of us or a portion of our assets as a taxable mortgage pool. A RIC, or other pass-through entity owning our common stock in record name will be subject to tax at the highest U.S. federal corporate tax rate on any excess inclusion income allocated to their owners that are disqualified organizations. Moreover, we could face limitations in selling equity interests in these securitizations to outside investors, or selling any debt securities issued in connection with these securitizations that might be considered to be equity interests for tax purposes. Finally, if we were to fail to qualify as a REIT, any taxable mortgage pool securitizations would be treated as separate taxable corporations for U.S. federal income tax purposes that could not be included in any consolidated U.S. federal corporate income tax return. These limitations may prevent us from using certain techniques to maximize our returns from securitization transactions.
Although our use of TRSs may be able to partially mitigate the impact of meeting the requirements necessary to maintain our qualification as a REIT, our ownership of and relationship with our TRSs is limited and a failure to comply with the limits would jeopardize our REIT qualification and may result in the application of a 100% excise tax.
A REIT may own up to 100% of the stock of one or more TRSs. Subject to certain exceptions, a TRS may hold assets and earn income that would not be qualifying assets or income if held or earned directly by a REIT. Both the subsidiary and the REIT must jointly elect to treat the subsidiary as a TRS. A corporation of which a TRS directly or indirectly owns more than 35% of the voting power or value of the stock will automatically be treated as a TRS. Overall, no more than 25% (20% beginning with the taxable year ending December 31, 2018) of the value of a REITs total assets may consist of stock or securities of one or more TRSs. In addition, the TRS rules limit the deductibility of interest paid or accrued by a TRS to its parent REIT to assure that the TRS is subject to an appropriate level of corporate taxation. The rules also impose a 100% excise tax on certain transactions between a TRS and its parent REIT that are not conducted on an arms-length basis. Our TRSs will pay U.S. federal, state and local income or franchise tax on their taxable income, and their after-tax net income will be available for distribution to us but will not be required to be distributed to us, unless necessary to maintain our REIT qualification. While we will be monitoring the aggregate value of the securities of our TRSs and intend to conduct our affairs so that such securities will represent less than 25% (or 20% beginning January 1, 2018) of the value of our total assets, there can be no assurance that we will be able to comply with the TRS limitation in all market conditions.
Dividends payable by REITs generally do not qualify for the reduced tax rates on dividend income from regular corporations, which could adversely affect the value of our shares.
The maximum U.S. federal income tax rate for certain qualified dividends payable to U.S. stockholders that are individuals, trusts and estates is 20%. Dividends payable by REITs are generally not eligible for the reduced rates and therefore may be subject to a 39.6% maximum U.S. federal income tax rate on ordinary income. Although the reduced U.S. federal income tax rate applicable to dividend income from regular corporate dividends does not adversely affect the taxation of REITs or dividends paid by REITs, the more favorable rates applicable to regular corporate dividends could cause investors who are individuals, trusts and estates to perceive investments in REITs to be relatively less attractive than investments in the stocks of non-REIT corporations that pay dividends, which could adversely affect the value of the shares of REITs, including shares of our common stock.
The tax on prohibited transactions limits our ability to engage in transactions, including certain methods of securitizing loans, which would be treated as sales for U.S. federal income tax purposes.
A REITs net income from prohibited transactions is subject to a 100% tax. In general, prohibited transactions are sales or other dispositions of property, other than foreclosure property, but including loans, held as inventory or primarily for sale to customers in the ordinary course of business. We might be subject to this tax
- 48 -
Table of Contents
if we were to sell or securitize loans in a manner that was treated as a sale of the loans as inventory for U.S. federal income tax purposes. Therefore, in order to avoid the prohibited transactions tax, we may choose not to engage in certain sales of loans, other than through a TRS, and we may be required to limit the structures we use for our securitization transactions, even though such sales or structures might otherwise be beneficial for us.
Complying with REIT requirements may limit our ability to hedge effectively.
The REIT provisions of the Internal Revenue Code may limit our ability to hedge our assets and operations. Under these provisions, any income that we generate from transactions intended to hedge our interest rate exposure will be excluded from gross income for purposes of the REIT 75% and 95% gross income tests if (i) the instrument (A) hedges interest rate risk on liabilities used to carry or acquire real estate assets or certain other specified types of risk, or (B) hedges an instrument described in clause (A) for a period following the extinguishment of the liability or the disposition of the asset that was previously hedged by the hedged instrument, and (ii) such instrument is properly identified under applicable Treasury Regulations. Income from hedging transactions that do not meet these requirements will generally constitute non-qualifying income for purposes of both the REIT 75% and 95% gross income tests. As a result of these rules, we may have to limit our use of hedging techniques that might otherwise be advantageous or implement those hedges through a TRS. This could increase the cost of our hedging activities because our TRS would be subject to tax on gains or the limits on our use of hedging techniques could expose us to greater risks associated with changes in interest rates than we would otherwise want to bear. In addition, losses in our TRS will generally not provide any tax benefit to us, although such losses may be carried forward to offset future taxable income of the TRS.
We may be subject to adverse legislative or regulatory tax changes that could reduce the market price of shares of our common stock.
At any time, the U.S. federal income tax laws or regulations governing REITs or the administrative interpretations of those laws or regulations may be changed, possibly with retroactive effect. See Item 7. Management Discussion and Analysis of Financial Condition and Operating ResultsFactors Impacting our Operating ResultsRecent U.S. Federal Income Tax Legislation for recently adopted REIT legislation. We cannot predict if or when any new U.S. federal income tax law, regulation or administrative interpretation, or any amendment to any existing U.S. federal income tax law, regulation or administrative interpretation, will be adopted, promulgated or become effective or whether any such law, regulation or interpretation may take effect retroactively. We and our stockholders could be adversely affected by any such change in, or any new, U.S. federal income tax law, regulation or administrative interpretation.
On May 14, 2014, the U.S. Department of the Treasury published proposed regulations which, if adopted in the form proposed, would revise the definition of real property for purposes of the REIT income and asset tests. The proposed regulations are not yet in effect, and, depending upon whether and in what form they are actually adopted and how if adopted they are interpreted, may affect the classification of certain of our assets under these tests, and thus could require us to alter our mix of assets, adjust our approach to qualifying as a REIT or adjust our business strategy. The proposed regulations are proposed to be effective for calendar quarters beginning after they are published in final form. The Treasury has not indicated whether or when the proposed regulations will be finalized.
Liquidation of our assets may jeopardize our REIT qualification.
To qualify as a REIT, we must comply with requirements regarding our assets and our sources of income. If we are compelled to liquidate our assets to repay obligations to our lenders, we may be unable to comply with these requirements, thereby jeopardizing our qualification as a REIT, or we may be subject to a 100% tax on any resultant gain if we sell assets that are treated as inventory or property held primarily for sale to customers in the ordinary course of business.
- 49 -
Table of Contents
Your investment has various U.S. federal income tax risks.
We urge you to consult your tax advisor concerning the effects of U.S. federal, state, local and foreign tax laws to you with regard to an investment in shares of our common stock.
| Item 1B. | Unresolved Staff Comments. |
None.
| Item 2. | Properties. |
Our principal executive offices are located at 1906 Towne Centre Blvd, Suite 370, Annapolis, Maryland 21401. Our telephone number is (410) 571-9860.
| Item 3. | Legal Proceedings. |
From time to time, we may be involved in various claims and legal actions in the ordinary course of business. As of December 31, 2015, we are not currently subject to any legal proceedings that are likely to have a material adverse effect on our financial position, results of operations or cash flows.
| Item 4. | Mine Safety Disclosures. |
Not applicable.
- 50 -
Table of Contents
| Item 5. | Market for Registrants Common Equity, Related Stockholder Matters and Issuer Purchases of Equity Securities. |
Market Information
Our common stock began trading on the NYSE on April 18, 2013 under the symbol HASI. Prior to that time, there was no public trading market for our common stock. On February 26, 2016, the last sales price for our common stock on the NYSE was $17.49 per share. The following table presents the high and low sales prices per share of our common stock during each calendar quarter since it commenced trading on the NYSE on April 18, 2013 until December 31, 2015:
| 2015: |
High | Low | Dividends | |||||||||
| October 1, 2015 through December 31, 2015 |
$ | 19.58 | $ | 15.46 | $ | 0.30 | ||||||
| July 1, 2015 through September 30, 2015 |
21.52 | 16.32 | 0.26 | |||||||||
| April 1, 2015 through June 30, 2015 |
21.32 | 18.00 | 0.26 | |||||||||
| January 1, 2015 through March 31, 2015 |
19.15 | 13.61 | 0.26 | |||||||||
| 2014: |
High | Low | Dividends | |||||||||
| October 1, 2014 through December 31, 2014 |
$ | 14.48 | $ | 13.07 | $ | 0.26 | ||||||
| July 1, 2014 through September 30, 2014 |
14.87 | 13.28 | 0.22 | |||||||||
| April 1, 2014 through June 30, 2014 |
14.88 | 12.91 | 0.22 | |||||||||
| January 1, 2014 through March 31, 2014 |
15.11 | 12.61 | 0.22 | |||||||||
| 2013: |
High | Low | Dividends | |||||||||
| October 1, 2013 through December 31, 2013 |
$ | 14.15 | $ | 11.03 | $ | 0.36 | ||||||
| July 1, 2013 through September 30, 2013 |
12.51 | 11.05 | 0.06 | |||||||||
| April 18, 2013 through June 30, 2013 |
12.51 | 9.15 | | |||||||||
Holders
As of February 26, 2016, we had 125 registered holders of our common stock. The 125 holders of record does not include the beneficial owners of our common stock whose shares are held by a broker or bank. Such information was obtained from The Depository Trust Company.
Dividends
We intend to make regular quarterly distributions to holders of our common stock. U.S. federal income tax law generally requires that a REIT distribute annually at least 90% of its REIT taxable income, without regard to the deduction for dividends paid and excluding net capital gains, and that it pay tax at regular corporate rates to the extent that it annually distributes less than 100% of its REIT taxable income. Our current policy is to pay quarterly distributions, which on an annual basis will equal all or substantially all of our taxable income. Any distributions we make will be at the discretion of our board of directors and will depend upon, among other things, our actual results of operations. These results and our ability to pay distributions will be affected by various factors, including the net interest and other income from our portfolio, our operating expenses and any other expenditures. See Item 1A, Risk Factors, and Item 7, Managements Discussion and Analysis of Financial Conditions and Results of Operations, of this Form 10-K, for information regarding the sources of funds used for dividends and for a discussion of factors, if any, which may adversely affect our ability to pay dividends. See Note 11 of the audited financial statements in this Form 10-K for details of our dividends declared in 2014 and 2015.
- 51 -
Table of Contents
Stockholder Return Performance
The stock performance graph and table below shall not be deemed, under the Securities Act or the Exchange Act, to be (i) soliciting material or filed or (ii) incorporated by reference by any general statement into any filing made by us with the SEC, except to the extent that we specifically incorporate such stock performance graph and table by reference.
The following graph is a comparison of the cumulative total stockholder return on our shares of common stock, the Standard & Poors 500 Index (the S&P 500 Index), and the SNL Finance REIT Index and the Dow Jones Utility Average which are peer group indexes from April 18, 2013 (our first day of trading on the NYSE) to December 31, 2015. The graph assumes that $100 was invested at closing on April 18, 2013 in our shares of common stock, the S&P 500 Index, and the peer group indexes and that all dividends were reinvested without the payment of any commissions. There can be no assurance that the performance of our common stock will continue in line with the same or similar trends depicted in the graph below.
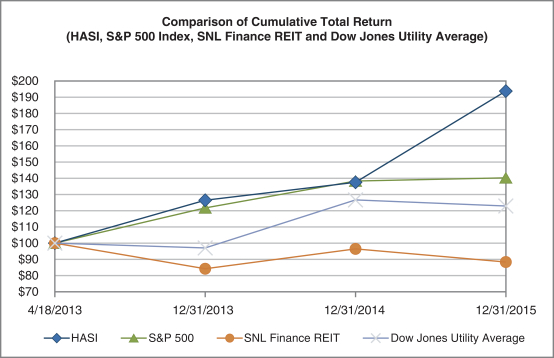
| Index | 04/18/13 | 12/31/13 | 12/31/14 | 12/31/15 | ||||||||||||
| Hannon Armstrong Sustainable Infrastructure Capital, Inc. |
$ | 100.00 | $ | 126.51 | $ | 137.59 | $ | 193.74 | ||||||||
| S&P 500 Index |
$ | 100.00 | $ | 121.73 | $ | 138.39 | $ | 140.31 | ||||||||
| SNL Finance REIT Index (1) |
$ | 100.00 | $ | 84.25 | $ | 96.48 | $ | 88.47 | ||||||||
| Dow Jones Utility Average |
$ | 100.00 | $ | 96.99 | $ | 126.71 | $ | 122.83 | ||||||||
Source: SNL Financial LC, Charlottesville, VA© 2015
| (1) | As of December 31, 2015, the SNL Finance REIT Index comprised of the following companies: AG Mortgage Investment Trust, Inc.; American Capital Agency Corp.; American Capital Mortgage Investment Corp.; American Church Mortgage Company; Annaly Capital Management, Inc.; Anworth Mortgage Asset Corporation; Apollo Commercial Real Estate Finance, Inc.; Apollo Residential Mortgage, Inc.; Arbor Realty Trust, Inc.; Ares Commercial Real Estate Corporation; ARMOUR Residential REIT, Inc.; Bimini Capital Management, Inc.; Blackstone Mortgage Trust, Inc.; Capstead Mortgage Corporation; Cherry Hill Mortgage Investment Corporation; Chimera Investment Corporation; Colony Capital, Inc.; CV Holdings, |
- 52 -
Table of Contents
| Inc.; CYS Investments, Inc.; Dynex Capital, Inc.; Ellington Residential Mortgage REIT; Five Oaks Investment Corp.; Great Ajax Corp.; Hannon Armstrong Sustainable Infrastructure Capital, Inc.; Hatteras Financial Corp.; Invesco Mortgage Capital Inc.; iStar Financial Inc.; JAVELIN Mortgage Investment Corp.; JER Investors Trust Inc.; Jernigan Capital Inc.; Ladder Capital Corp.; MFA Financial, Inc.; New Residential Investment Corp.; New York Mortgage Trust, Inc.; Newcastle Investment Corp.; Orchid Island Capital, Inc.; Origen Financial, Inc.; Owens Realty Mortgage, Inc.; PennyMac Mortgage Investment Trust; RAIT Financial Trust; Redwood Trust, Inc.; Resource Capital Corp.; Starwood Property Trust, Inc.; Two Harbors Investment Corp.; United Development Funding IV; Western Asset Mortgage Capital Corporation; and ZAIS Financial Corp. |
Securities Authorized For Issuance Under Equity Compensation Plans
In 2013, we adopted the 2013 Hannon Armstrong Sustainable Infrastructure Capital, Inc. Equity Incentive Plan (the 2013 Plan) to provide equity based incentive compensation to members of our senior management team, our independent directors, advisers, consultants and other personnel. The 2013 Plan authorizes our compensation committee to grant stock options, shares of restricted common stock, phantom shares, dividend equivalent rights, long term incentive plan (LTIP) units and other restricted limited partnership units issued by our Operating Partnership and other equity-based awards up to an aggregate of 7.5% of the shares of common stock issued and outstanding from time to time on a fully diluted basis (assuming, if applicable, the exercise of all outstanding options and the conversion of all warrants and convertible securities, including OP units and long-term incentive-plan units (LTIP units), into shares of common stock).
As of December 31, 2015, we have 1,248,069 shares of our restricted common stock outstanding, which are subject to vesting and, in some cases, performance requirements, to our directors, officers and other employees. In addition, from January 1, 2016 through February 26, 2016, we have granted 74,316 shares of our restricted common stock, which are subject to vesting, and in some cases, performance requirements, to our directors, officers and other employees.
The following table presents certain information about our equity compensation plan as of December 31, 2015:
| Award |
Number of securities remaining available for future issuance under equity compensation plans (1) |
|||
| Equity compensation plans approved by stockholders |
1,271,320 | |||
| Equity compensation plans not approved by stockholders |
| |||
|
|
|
|||
| Total |
1,271,320 | |||
|
|
|
|||
| (1) | The 2013 Plan provides for grants of equity awards up to, in the aggregate, the equivalent of 7.5% of the issued and outstanding shares of our common stock from time to time (on a fully diluted basis (assuming, if applicable, the exercise of all outstanding options and the conversion of all warrants and convertible securities into shares of common stock)) at the time of the award. As of December 31, 2015, we did not have outstanding under our equity compensation plan, any options, warrants or rights to purchase share of our common stock. |
Recent Sales of Unregistered Equity Securities; Use of Proceeds from Registered Securities
For the year ended December 31, 2015, we issued 46,290 shares of our common stock upon redemption of an equal number of OP units. Because these shares of common stock were issued to accredited investors in transactions not involving a public offering, the transactions were exempt from registration under the Securities
- 53 -
Table of Contents
Act in accordance with Section 4(a)(2). During the years ended December 31, 2015, certain of our employees surrendered common stock owned by them to satisfy their statutory minimum federal and state tax obligations associated with the vesting of restricted stock units.
The table below summarizes all of our repurchases of common stock during 2015. The number of shares purchased represents shares of common stock surrendered by certain of our employees to satisfy their minimum tax and other compensation related withholdings associated with the vesting of restricted stock. The price paid per share is based on the closing price of our common stock as of the date of the withholding.
| Period |
Total number of shares purchased |
Average price paid per share |
Total number of shares purchased as part of publicly announced plans or programs |
Maximum number of shares that may yet be purchased under the plans or programs |
||||||||||||
| February 2015 |
2,769 | $ | 15.88 | N/A | N/A | |||||||||||
| April 2015 |
17,535 | $ | 19.02 | N/A | N/A | |||||||||||
| June 2015 |
16,889 | $ | 20.30 | N/A | N/A | |||||||||||
| December 2015 |
10,894 | $ | 18.97 | N/A | N/A | |||||||||||
| Item 6. | Selected Financial Data. |
The following table sets forth selected financial and operating data on a historical basis for the Predecessor for periods prior to the consummation of our IPO on April 23, 2013 and for us for periods on or after April 23, 2013. The financial data for the Predecessor for such periods do not reflect the material changes to the business as a result of the capital raised in our IPO including the broadened types of projects undertaken, the enhanced financial structuring flexibility and the ability to retain a larger share of the economics from the origination activities. Accordingly, the financial data for the Predecessor is not necessarily indicative of our results of operations, cash flows or financial position following the completion of our IPO.
The following financial information should be read in conjunction with Managements Discussion and Analysis of Financial Condition and Results of Operations and the financial statements and related notes thereto. The Predecessors fiscal year ended on September 30 of each year. Our fiscal year ends on December 31 of each year, beginning with the year ended December 31, 2013. The historical consolidated balance sheet information as of September 30, 2012, and 2011 are of the Predecessor and the consolidated statements of operations information for the three months ended December 31, 2012 and for the years ended September 30, 2012 and 2011, are of the Predecessor and, along with the consolidated balance sheets of our company as of December 31, 2015, 2014 and 2013 and the consolidated statement of operations of our company for the years ended December 31, 2015, 2014 and 2013, have been derived from the historical audited consolidated financial statements and related notes. The historical condensed consolidated statements of operations information for the three-month periods ended December 31, 2011 has been derived from the unaudited historical condensed consolidated financial statements of the Predecessor, which we believe include all adjustments (consisting of normal recurring adjustments) necessary to present the information set forth therein under U.S. GAAP. The results of operations for the interim three month periods ended December 31, 2012 and December 31, 2011 are not necessarily indicative of the results to be obtained for the full fiscal year. Certain amounts in the prior year have been reclassified to conform to the current year presentation.
- 54 -
Table of Contents
|
Years Ended December 31, |
Three Months Ended December 31, |
Years Ended September 30, |
||||||||||||||||||||||||||
| 2015 | 2014 | 2013 | 2012 | 2011 | 2012 | 2011 | ||||||||||||||||||||||
| (unaudited) | ||||||||||||||||||||||||||||
| (amounts in thousands, except per share data) | ||||||||||||||||||||||||||||
| Total Revenue: |
||||||||||||||||||||||||||||
| Total revenue |
$ | 58,679 | $ | 45,275 | $ | 24,445 | $ | 5,622 | $ | 5,578 | $ | 27,140 | $ | 16,641 | ||||||||||||||
| Investment interest expense |
(26,385 | ) | (16,655 | ) | (9,815 | ) | (2,347 | ) | (2,821 | ) | (9,852 | ) | (9,442 | ) | ||||||||||||||
| Provision for credit losses |
| | (11,000 | ) | | | | | ||||||||||||||||||||
|
|
|
|
|
|
|
|
|
|
|
|
|
|
|
|||||||||||||||
| Total Revenue, net of investment interest expense and provision |
32,294 | 28,620 | 3,630 | 3,275 | 2,757 | 17,288 | 7,199 | |||||||||||||||||||||
|
|
|
|
|
|
|
|
|
|
|
|
|
|
|
|||||||||||||||
| Compensation and benefits |
(16,788 | ) | (10,518 | ) | (12,312 | ) | (1,157 | ) | (1,065 | ) | (7,697 | ) | (4,028 | ) | ||||||||||||||
| General and administrative |
(6,462 | ) | (5,550 | ) | (3,844 | ) | (584 | ) | (626 | ) | (3,901 | ) | (2,506 | ) | ||||||||||||||
| Acquisition costs |
| (2,456 | ) | | | | | | ||||||||||||||||||||
| Other, net |
(794 | ) | (300 | ) | (359 | ) | (137 | ) | (153 | ) | (602 | ) | (630 | ) | ||||||||||||||
| Loss from equity method investments in affiliates |
(98 | ) | | | (448 | ) | (799 | ) | (1,284 | ) | (5,047 | ) | ||||||||||||||||
|
|
|
|
|
|
|
|
|
|
|
|
|
|
|
|||||||||||||||
| Other Expenses, net |
(24,142 | ) | (18,824 | ) | (16,515 | ) | (2,326 | ) | (2,643 | ) | (13,484 | ) | (12,211 | ) | ||||||||||||||
|
|
|
|
|
|
|
|
|
|
|
|
|
|
|
|||||||||||||||
| Net income (loss) before income tax |
8,152 | 9,796 | (12,885 | ) | $ | 949 | $ | 114 | $ | 3,804 | $ | (5,012 | ) | |||||||||||||||
|
|
|
|
|
|
|
|
|
|
|
|
|
|
|
|||||||||||||||
| Income tax (expense) benefit |
(118 | ) | (26 | ) | 251 | | | | | |||||||||||||||||||
|
|
|
|
|
|
|
|
|
|
|
|
|
|
|
|||||||||||||||
| Net Income (Loss) |
8,034 | 9,770 | (12,634 | ) | $ | 949 | $ | 114 | $ | 3,804 | $ | (5,012 | ) | |||||||||||||||
|
|
|
|
|
|
|
|
|
|
|
|
|
|
|
|||||||||||||||
| Net income (loss) attributable to non-controlling interest holders |
76 | 163 | (2,175 | ) | ||||||||||||||||||||||||
|
|
|
|
|
|
|
|||||||||||||||||||||||
| Net income (loss) income attributable to controlling shareholders |
$ | 7,958 | $ | 9,607 | $ | (10,459 | ) | |||||||||||||||||||||
|
|
|
|
|
|
|
|||||||||||||||||||||||
| Balance Sheet Data (at Period End): |
||||||||||||||||||||||||||||
| Financing receivables |
$ | 783,967 | $ | 552,706 | $ | 347,871 | $ | 195,582 | $ | 143,776 | ||||||||||||||||||
| Financing receivables held-for-sale |
60,376 | 62,275 | 24,758 | | | |||||||||||||||||||||||
| Investments (1) |
29,017 | 27,273 | 95,177 | | 506 | |||||||||||||||||||||||
| Real estate (2) |
155,699 | 113,965 | | | | |||||||||||||||||||||||
| Equity method investments in affiliates |
318,769 | 143,903 | | | | |||||||||||||||||||||||
| Cash and cash equivalents |
42,645 | 58,199 | 31,846 | 20,948 | 1,633 | |||||||||||||||||||||||
| Total assets |
1,469,621 | 1,008,682 | 571,275 | 232,463 | 174,594 | |||||||||||||||||||||||
| Nonrecourse debt |
663,791 | 319,196 | 259,767 | 200,283 | 148,177 | |||||||||||||||||||||||
| Credit facility |
247,350 | 315,748 | 77,114 | 4,599 | 6,895 | |||||||||||||||||||||||
| Total liabilities |
1,037,515 | 734,640 | 420,651 | 213,301 | 158,309 | |||||||||||||||||||||||
| Total equity |
432,106 | 274,042 | 150,624 | 19,162 | 16,285 | |||||||||||||||||||||||
| Total liabilities and equity |
1,469,621 | 1,008,682 | 571,275 | 232,463 | 174,594 | |||||||||||||||||||||||
| Per Share Data: |
||||||||||||||||||||||||||||
| Basic and diluted earnings per share |
$ | 0.21 | $ | 0.43 | $ | (0.68 | ) | |||||||||||||||||||||
| Weighted average shares outstandingbasic and diluted |
30,761,151 | 20,656,826 | 15,716,250 | |||||||||||||||||||||||||
| Managed Assets (3) |
$ | 3,188,174 | $ | 2,609,548 | $ | 2,085,798 | $ | 1,608,275 | $ | 1,538,526 | ||||||||||||||||||
| (1) | The December 31, 2013 balance includes investments held-to-maturity. |
| (2) | Includes real estate intangible assets. |
| (3) | See Non-GAAP Financial MeasuresManaged Assets and Investment Income from Managed Assets for information on Managed Assets. |
- 55 -
Table of Contents
| Item 7. | Managements Discussion and Analysis of Financial Condition and Results of Operations. |
The following discussion should be read in conjunction with our financial statements and accompanying notes included in Item 8, Financial Statements and Supplementary Data, of this Form 10-K.
Our Business
We provide debt and equity financing to the energy efficiency and renewable energy markets. We focus on providing preferred or senior level capital to established sponsors and high credit quality obligors for assets that generate long-term, recurring and predictable cash flows.
We are internally managed and our management team has extensive industry knowledge and experience having completed its first renewable energy financing over 25 years ago and its first energy efficiency financing over 15 years ago. We have deep and long-standing relationships in the markets we target with leading energy service providers, manufacturers, project developers and owners. We originate many of our transactions through programmatic finance relationships with global ESCOs, such as Honeywell International, Ingersoll Rand, Johnson Controls, Schneider Electric, Siemens and United Technologies. We also originate transactions with renewable energy manufacturers, developers and operators such as EDF Renewable Energy, EDP Renewables, E.ON, First Solar, Invenergy, SunPower and other companies who own and operate renewable energy projects, including a number of U.S. utility companies. Additionally, we rely on relationships with a variety of key financial participants, including institutional investors, private equity funds, senior lenders, and investment and commercial banks, as well as leading intermediaries, to complement our origination and financing activities. We believe we are the leading provider of financing for energy efficiency projects for the U.S. federal government, the largest property owner and energy user in the United States.
We focus our investment activities primarily on:
| | Energy Efficiency Projects: projects, typically undertaken by ESCOs, which reduce a buildings or facilitys energy usage or cost by improving or installing various building components, including HVAC systems, lighting, energy controls, roofs, windows, building shells, and/or combined heat and power systems; and |
| | Renewable Energy Projects: projects that deploy cleaner energy sources, such as solar and wind to generate power production. |
We may also provide financing solutions for other projects, such as water or communications infrastructure, that improve water or energy efficiency, increase energy system resiliency, positively impact the environment or more efficiently use natural resources.
Our goal is to deliver attractive risk-adjusted returns to our stockholders by investing in projects that generate long-term, recurring and predictable cash flows or cost savings. The cash flows or cost savings are generally generated from proven technologies that minimize performance uncertainty, enabling us to more accurately predict project cash flow over the term of the financing or investment. We provide capital through debt financings and a variety of preferred and common equity structures with a preference for structures in which we hold a senior or preferred position in the capital structure.
We completed approximately $935 million of transactions during 2015, compared to approximately $875 million during 2014. Our strategy includes holding a large portion of these transactions on our balance sheet. As of December 31, 2015, we held approximately $1.3 billion of transactions on our balance sheet, including approximately 75% of our 2015 transactions. The transactions that we hold on our balance sheet as of a given date, which we refer to as our Portfolio included the following as of December 31, 2015:
| | Financing Receivables, such as project loans, receivables and direct financing leases, |
| | Debt securities, |
- 56 -
Table of Contents
| | Real Estate, such as land or other physical assets and related intangible assets used in sustainable infrastructure projects, and |
| | Equity Investments in unconsolidated affiliates, such as projects where we hold a non-controlling equity interest in a project. |
As of December 31, 2015, approximately 64% of our Portfolio consisted of loans, financing receivables, direct financing leases or debt securities with 59% structured with fixed rates and 5% structured with floating rates. Approximately 12% of our Portfolio was real estate with long-term leases and approximately 24% represented equity ownership of wind projects. Excluding our equity investments, approximately 45% of our Portfolio consisted of U.S. federal government or state or local government obligors, approximately 54% consisted of investment grade commercial obligations and 1% consisted of non-investment grade rated commercial obligations, in all cases rated either by an independent third party rating service or our internal credit rating system. Our Portfolio consisted of over 105 transactions and the weighted average remaining life of our Portfolio as of December 31, 2015, (excluding match-funded transactions) was approximately ten years. For more information on the assets included in our Portfolio, see the Our Portfolio section of Financial Condition and Results of Operation discussed below.
We also originate transactions for securitization trusts or similar vehicles, including the Hannon Armstrong Multi-Asset Infrastructure Trust, or Hannie Mae, that we manage or service. Large institutional investors, primarily insurance companies and commercial banks, provide the financing needed for a project by purchasing the notes issued by the trust or vehicle. The securitization market for the assets we finance has remained active throughout various market cycles due to investor demand for high credit quality, long-term investments. We typically arrange such securitizations of loans or other assets prior to originating the transaction and thus have avoided exposure to credit spread and interest rate risks that are normally associated with traditional capital markets conduit transactions. Additionally, we have typically avoided funding risks for these loans or other assets given that our securitization partners contractually agree to fund such assets before the origination transaction is completed. In most cases, the transfer of loans or other assets to these non-consolidated securitization trusts qualify as sales for accounting purposes. In these transactions, we record income as a gain on sale of receivables and investments.
We also typically manage and service these assets in exchange for fees and other payments, which we record as fee income on our statement of operations. We may also use other funds or structures where institutional investors purchase all or a portion of the economics of the transaction and where we may receive upfront revenues or ongoing fees for managing the assets. We periodically provide other services, including arranging financings that are held on the balance sheet of other investors and advising various companies with respect to structuring investments.
We managed approximately $3.2 billion of assets, which consisted of our Portfolio plus approximately $1.8 billion of assets held in non-consolidated securitization trusts. We refer to this $3.2 billion of assets collectively as our managed assets.
We have raised net proceeds of approximately $470 million including $181 million in two follow on public offerings completed in 2015. Since April 2013, we have also completed approximately $610 million of nonrecourse borrowings and have a credit facility with maximum capacity of $500 million. In 2015, we completed approximately $395 million of nonrecourse borrowings and had a $50 million increase in available capacity under our credit facility.
We have a large and active pipeline of potential new opportunities that are in various stages of our underwriting process. We refer to potential opportunities as being part of our pipeline if we have determined that the project fits within our investment strategy and exhibits the appropriate risk/reward characteristics through an initial credit analysis, including a quantitative and qualitative assessment of the opportunity, as well as research
- 57 -
Table of Contents
on the market and sponsor. Our pipeline of transactions that could potentially close in the next 12 months consists of opportunities in which we will be the lead originator, as well as projects in which we may participate with other institutional investors. As of December 31, 2015, our pipeline consisted of more than $2.5 billion in new debt and equity opportunities. There can, however, be no assurance that any or all of the transactions in our pipeline will be completed.
Market Conditions
We believe that the markets we serve are in the midst of a prolonged expansion fueled principally by the following macro-economic and geopolitical trends:
| | global climate change caused by man-made GHG emissions; |
| | governmental policies that seek to address global climate change and other environmental issues; |
| | volatile commodity prices; |
| | national security risks associated with energy procurement that threaten energy supply; |
| | fiscal challenges and budgetary constraints facing U.S. federal, state and local governments; and |
| | changes in global banking regulations which increase capital requirements for banks when they retain financing for long-lived clean energy projects, thus reducing the amount of available bank financing for such projects. |
For example, in October 2015, the U.S. Environmental Protection Agency introduced the Clean Power Plan intended to establish GHG emissions guidelines for existing U.S. power plants, the implementation of which was stayed by the Supreme Court of the United States pending review on the merits by lower appellate courts. On a global basis, nearly 200 countries participated in a December 2015 Conference of the Parties to the United Nations Framework Convention on Climate Change (COP 21) where an agreement was reached to continue efforts to reduce GHG emissions.
In part due to this growing demand, we believe that capital availability has not kept pace with the growing financing demands in the markets we serve in the United States, as well as elsewhere around the world. In the face of growing demand for capital, we are concurrently witnessing a decline, elimination or expiration of important government subsidies that have played an important historical role in bringing capital to our markets. In addition, much of the capital that is available to the sector comes with conditions attached, including substantial minimum project size requirements, requirements that all project cash flows be fully contracted prior to any provision of financing, and the inability of lenders to take any merchant or investment risk with respect to various government incentives.
While we believe that the long-term growth prospects for our business remain positive, recent financial market and commodity price volatility and interest rate movements have raised near-term concerns that have impacted the markets we serve. The U.S. Energy Information Administration reported that U.S. benchmark crude oil prices were down 53% in 2015 compared with 2014 and the 2015 average benchmark natural gas prices decreased by 41% from 2014. Oil represents only about 1% of U.S. power production and thus has limited impact on power pricing. However, wholesale electricity prices are closely tied to wholesale natural gas prices in many parts of the country and thus lower natural gas prices have the potential to negatively impact renewable energy projects that sell wholesale power on a merchant basis at spot prices.
The price declines in energy have also adversely impacted energy debt and equity markets, including master limited partnerships that transport, store or process oil and gas. In addition, concerns have been raised about the level of economic growth in the United States as well in other important economic centers around the world. While this impact is still developing, it has the potential to cause investors and lenders, who in some cases also participate in the sustainable energy industry, to adjust the types and amounts of investments that they make. Certain participants in the sustainable energy industry have experienced significant declines in the value of their equity and may face difficulty in raising or refinancing debt.
- 58 -
Table of Contents
As described in more detail in Factors Impacting our Operating ResultsCommodity Prices below, we attempt to mitigate our exposure to commodity price volatility by focusing on projects with contracted revenues and by negotiating certain structural protections such as preferred returns. In addition, we do not lend to individual companies but instead focus on projects or portfolios of assets which are typically held in special purpose entities. We also seek to manage credit risk that might arise from commodity price declines thorough due diligence and underwriting processes, strong structural protections in our transaction agreements with customers and on-going active asset management and portfolio monitoring.
The U.S. Federal Reserve raised its target range for the fed funds rate by 0.25% in December 2015 and credit spreads, the difference between a credit index and U.S. Treasuries of a comparable maturity, have also increased. As described in Factors Impacting our Operating ResultsChanges in Market Interest Rates and Liquidity, on the asset side, rising rates and spread widening will increase the returns from new investments we make, which we believe will have a positive impact on our overall Portfolio yield. On the liability side, and in response to concerns over rising interest rates, we have increased our level of fixed rate debt and plan to continue to broaden our sources of debt over the next one to three years.
Notwithstanding the near-term concerns that current market conditions have raised for our business, we believe significant opportunities exist for us to grow our business in the face of these conditions. Historically, better risk adjusted returns were available in an environment where demand for capital is growing but capital availability is in shorter supply. As a long-term player committed to providing capital to the energy efficiency and renewable energy markets, we plan to continue to fund projects that meet our underwriting standards and look for opportunities to expand our business as other capital providers withdraw or scale back their funding allocations to our markets.
Factors Impacting our Operating Results
We expect that our results of operations will be affected by a number of factors and will primarily depend on the size of our Portfolio, including the mix of transactions which we hold in our Portfolio, the income we receive from securitizations, syndications and other services, our Portfolios credit risk profile, changes in market interest rates, commodity prices, U.S. federal, state and/or municipal governmental policies, general market conditions in local, regional and national economies and our ability to qualify as a REIT and maintain our exception from registration as an investment company under the 1940 Act.
Portfolio Size
The size of our Portfolio will be a key revenue driver. Generally, as the size of our Portfolio on our balance sheet grows the amount of our investment revenue will increase. Our Portfolio may grow at an uneven pace as opportunities to originate new assets may be irregularly timed, and the timing and extent of our success in such originations cannot be predicted. To the extent the size of our Portfolio changes due to investment activity in our equity method affiliates, the income or loss from such investments will not be included in revenue but are reflected on a separate line in our income statement. In addition, we may decide for any particular project that we should securitize or otherwise sell a portion, or all, of the project, which would result in gain on sale of receivables and investments or fee income as, described below. The level of portfolio activity will fluctuate from period to period based upon the market demand for the capital we provide, our view of economic fundamentals including interest rates, the present mix of our Portfolio, our ability to identify new opportunities that meet our investment criteria, the volume of projects that have advanced to stages where we believe a transaction is appropriate, seasonality in our activities and in the various projects where we may provide debt or equity and our ability to consummate the identified opportunities, including as a result of our available capital. The level of our new origination activity, the percentage of the originations that we choose to retain on our balance sheet and the related income, will directly impact our investment revenue.
- 59 -
Table of Contents
Income from Securitization, Syndication and Other Services
We will also earn gain on sale of receivables and investments or fee income by securitizing or selling all or a portion of our transactions and by servicing the securitization financings we arrange. For transactions that we securitize to a non-consolidated trust, we recognize a gain on securitization of the receivables. We receive a majority of the gain in cash and record the present value of the remaining portion as a retained interest in our securitization assets. We may also recognize additional income such as servicing fees from these securitization assets over the life of the project.
In many cases, we arrange the securitization of the loan or other asset prior to originating the transaction and thus have avoided exposure to credit spread and interest rate risks that are typically associated with traditional capital markets conduit transactions. In these cases, we avoid funding risks for these loans or other assets given that our securitization partners contractually agree to fund such assets before the origination transaction is completed.
We also generate fee income for syndications where we arrange financings that are held directly on the balance sheet of other investors or if we sell existing transactions to other investors. In these transactions, unless we decide to hold a portion of the economic interest of the transaction on our balance sheet, we have no exposure to risks related to ownership of those financings. We may charge advisory, retainer or other fees, including through our broker dealer subsidiary. As a large portion of these fees are earned upon the closing of a financing transaction, the timing of these fees will vary from quarter to quarter.
The gain on sale income and our other sources of fee income will also vary depending on the level of our new origination activity and the portion of our originated assets we decide to transfer to other investors. We view this revenue from such activities as a valuable component of our earnings and an important source of franchise value. The total amount of fee income will vary on a quarter to quarter basis depending on various factors, including the level of our originations, the duration, credit quality and types of assets we originate, current and anticipated future interest rates, the mix of our Portfolio and our need to tailor our mix of assets in order to allow us to qualify as a REIT for U.S. federal income tax purposes and maintain our exception from registration under the 1940 Act.
Credit Risks
We source and identify quality opportunities within our broad areas of expertise and apply our rigorous underwriting processes to our transactions, which, we believe, will generally enable us to keep our credit losses and financing costs low. While we do not anticipate facing significant credit risk in our financings related to U.S. federal government energy efficiency projects, we are subject to varying degrees of credit risk in these projects in relation to guarantees provided by ESCOs where payments under energy savings performance contracts are contingent upon achieving pre-determined levels of energy savings. We are also exposed to credit risk in projects that do not benefit from the U.S. federal government as obligor. We increasingly target such projects as part of our strategy. In the case of various renewable energy and sustainable infrastructure projects, we will also be exposed to the credit risk of the obligor of the projects power purchase agreement or other long-term contractual revenue commitments. We may encounter enhanced credit risk as we expect that over time our strategy will increasingly include mezzanine debt, real estate or equity investments. We seek to manage credit risk using thorough due diligence and underwriting processes, strong structural protections in our transaction agreements with customers and continual, active asset management and portfolio monitoring. Nevertheless, unanticipated credit losses could occur and during periods of economic downturn in the global economy, our exposure to credit risks from obligors increases, and our efforts to monitor and mitigate the associated risks may not be effective in reducing our credit risks.
We utilize a risk rating system to evaluate projects that we increasingly target, such as on balance sheet financing of projects undertaken by state and local governments, universities, schools and hospitals, as well as privately owned commercial projects. We first evaluate the credit rating of the obligors involved in the project using an average of the external credit ratings for an obligor, if available, or an estimated internal rating based on
- 60 -
Table of Contents
a third party credit scoring system. We then evaluate the probability of default and estimated recovery rate based on the obligors credit ratings and the terms of the contract. We also review the performance of each investment, including through, as appropriate, a review of project performance, monthly payment activity and active compliance monitoring, regular communications with project management and, as applicable, its obligors, sponsors and owners, monitoring the financial performance of the collateral, periodic property visits and monitoring cash management and reserve accounts. The results of our reviews are used to update the projects risk rating as necessary.
Changes in Market Interest Rates and Liquidity
Interest rates and prepayment speeds vary according to the type of asset, conditions in the financial markets, competition and other factors, none of which can be predicted with any certainty. With respect to our business operations, increases in interest rates, in general, may over time cause: (1) an increase in the returns we receive from new financings we provide, but will also likely cause project owners to be less interested in borrowing or raising equity and thus reduce the demand for our financings and services; (2) the interest expense associated with our borrowings to increase; (3) the market value of our fixed rate or fixed return investments to decline; and (4) the market value of interest rate swap agreements to increase, to the extent we, or the projects to which we provide capital, enter into such agreements as part of a hedging strategy. Conversely, decreases in interest rates, in general, may over time cause: (1) a decrease in the returns we receive from new financings we provide, but will also likely cause project owners to be more interested in borrowing or raising equity and thus increase the demand for our financings; (2) prepayments on our investments, to the extent allowed, to increase; (3) the interest expense associated with our borrowings to decrease; (4) the market value of our fixed rate or fixed return investments to increase; and (5) the market value of interest rate swap agreements to decrease, to the extent we, or the projects to which we provide capital, enter into such agreements as part of our hedging strategy. We are, and will, in the future, be subject to changes in market interest rate for any new floating or inverse floating rate assets and credit facilities including our existing credit facility and the refinancing of our fixed rated debt. Because short-term borrowings are generally short-term commitments of capital, lenders may respond to market conditions, making it more difficult for us to secure continued financing. If we are not able to renew our then existing facilities or arrange for new financing on terms acceptable to us, or if we default on our covenants or are otherwise unable to access funds under any of these facilities, we may have to curtail our origination of new assets and/or dispose of assets. We face particular risk in this regard given that we expect many of our borrowings will have a shorter duration than the assets they finance. In addition, our ability to receive protection against prepayments, which occur in a declining interest rate environment, including through the use of make-whole payments, will vary according to type of investment and obligor. Subject to maintaining our qualification as a REIT for U.S. federal income tax purposes and our exception from registration under the 1940 Act, we may, from time to time, utilize derivative financial instruments to hedge interest rate risk. In addition to the use of traditional derivative instruments, we also seek to mitigate interest rate risk by using securitizations such as asset backed securitizations, syndications and other techniques to construct a portfolio with a staggered maturity profile.
In preparation for potentially higher interest rates, we also have increased the percentage of fixed rate debt from approximately 50% as of December 31, 2014 to approximately 71% as of December 31, 2015, or slightly above our targeted fixed rate debt percentage range of approximately 50% to 70%. For the purposes of these calculations, we used the total debt on our balance sheet, including our credit facility, nonrecourse securitization debt and other nonrecourse match funded debt but excluding securitizations that are not consolidated on our balance sheet (where the collateral is typically borrowings with U.S. government obligors). In addition, for the purposes of the fixed rate debt target, we include in the fixed rate debt, the present notional value hedged by interest rate swaps.
We have also worked to expand our liquidity and access to the debt and bank loan markets and in 2015, entered into borrowing relationships with three new lenders and with several institutional investors through our $101 million issuance of HASI Sustainable Yield Bonds in 2015 . We also increased the size of our credit facility by $50 million and continue to conduct securitizations with institutional investors.
- 61 -
Table of Contents
Commodity Prices
When we provide debt or equity for a project that acts as a substitute for an underlying commodity we are exposed to volatility in prices for that commodity. For example, the performance of renewable energy projects that produce electricity can be impacted by volatility in the market prices of various forms of energy, including electricity, coal and natural gas. This is especially true for utility scale projects that sell power on a wholesale basis such as many of our wind projects as opposed to distributed renewable projects or energy efficiency projects which compete against the retail or delivered costs of electricity which includes the cost of transmitting and distributing the electricity to the end user.
Although we generally focus on renewable energy projects that have the majority of their operating cash flow supported by long-term PPAs, ranging from 10 to 30 years, to the extent that the projects have shorter term contracts (which may have the potential of producing higher current returns) or sell their power in the open market on a merchant basis, the cash flows of such projects, and thus the repayment of, or the returns available for, our assets, may be subject to risk if energy prices change. We also mitigate our exposure through structural protections. These structural protections, which are typically in the form of a preferred return mechanism, are design to allow recovery of our capital and an acceptable return over time. When structuring and underwriting these transactions, we evaluate these transactions using a variety of scenarios, including long-term depressed natural gas prices. In the case of utility scale solar projects, we focus on owning the land under the project where our rent is paid out of project operational costs before the debt or equity in the project receives any payments.
We believe the current low prices in natural gas will increase demand for some types of our projects, such as combined heat and power, but may reduce the demand for other projects such as renewable energy that may be a substitute for natural gas. We seek to structure our energy efficiency financings so that we typically avoid exposure to commodity price risk. However, volatility in energy prices may cause building owners and other parties to be reluctant to commit to projects for which repayment is based upon a fixed monetary value for energy savings that would not decline if the price of energy declines.
Government Policies
We provide debt and equity financing to projects that typically depend in part on various U.S. federal, state or local governmental policies that support or enhance the projects economic feasibility. Such policies may include governmental initiatives, laws and regulations designed to reduce energy usage, encourage the use of renewable energy or encourage the investment in and the use of sustainable infrastructure. Incentives provided by the U.S. federal government may include tax credits (with some of these tax credits that are related to renewable energy schedule to be reduced in the future), tax deductions, bonus depreciation as well as federal grants and loan guarantees. Incentives provided by state and local governments may include renewable portfolio standards, which specify the portion of the power utilized by local utilities that must be derived from renewable energy sources such as renewable energy as well as the state or local government sponsored programs where the financing of energy efficiency or renewable energy projects is repaid through an assessment in the property tax bill in a program commonly referred to as PACE. Additionally, certain states have implemented feed-in tariffs, pursuant to which electricity generated from renewable energy sources is purchased at a higher rate than prevailing wholesale rates. Other incentives include tariffs, tax incentives and other cash and non-cash payments. In addition, U.S. federal, state and local governments provide regulatory, tax and other incentives to encourage the development and growth of sustainable infrastructure. Governmental agencies and other owners of real estate frequently depend on these policies to help defray the costs associated with, and to finance, various projects. Government regulations also impact the terms of third party financing provided to support these projects. If any of these government policies, incentives or regulations are adversely amended, delayed, eliminated, reduced or not extended beyond their current expiration dates the demand for, and the returns available from, the financing we provide may decline, which could harm our business. Changes in government policies, support and incentives, including retroactive changes, could also negatively impact the operating results of the projects we finance and the returns on our assets.
- 62 -
Table of Contents
Recent U.S. Federal Income Tax Legislation
On December 18, 2015, President Obama signed into law the Consolidated Appropriations Act, 2016, an omnibus spending bill, with a division referred to as the Protecting Americans From Tax Hikes Act of 2015 (the PATH Act). The PATH Act changes certain of the rules affecting REIT qualification and taxation of REITs and REIT shareholders, which are briefly summarized below.
| | For taxable years beginning after 2017, the percentage of a REITs total assets that may be represented by securities of one or more TRSs is reduced from 25% to 20%. |
| | Publicly offered REITs (which generally include any REIT required to file annual and periodic reports with the SEC, including us) are no longer subject to the preferential dividend rules for taxable years beginning after 2014. |
| | For taxable years beginning after 2015, debt instruments issued by publicly offered REITs are qualifying assets for purposes of the 75% REIT asset test. However, no more than 25% of the value of a REITs assets may consist of debt instruments that are issued by publicly offered REITs that are not otherwise treated as real estate assets, and interest on debt of a publicly offered REIT will not be qualifying income under the 75% REIT gross income test unless the debt is secured by real property. |
| | For taxable years beginning after 2015, to the extent rent attributable to personal property is treated as rents from real property (because rent attributable to the personal property for the taxable year does not exceed 15% of the total rent for the taxable year for such real and personal property), the personal property will be treated as a real estate asset for purposes of the 75% REIT asset test. Similarly, debt obligation secured by a mortgage on both real and personal property will be treated as a real estate asset for purposes of the 75% asset test, and interest thereon will be treated as interest on an obligation secured by real property, if the fair market value of the personal property does not exceed 15% of the fair market value of all property securing the debt. |
| | For taxable years beginning after 2014, the period during which dispositions of properties with net built-in gains from C corporations in carry-over basis transactions will trigger the built-in gains tax is reduced from ten years to five years. |
| | For taxable years beginning after 2015, a 100% excise tax will apply to redetermined services income, i.e., non-arms-length income of a REITs TRS attributable to services provided to, or on behalf of, the REIT (other than services provided to REIT tenants, which are potentially taxed as redetermined rents). |
| | The rate of withholding tax applicable under the Foreign Investment in Real Property Tax Act of 1980 (FIRPTA) to certain sales and other dispositions of U.S. real property interests (USRPIs) by non-U.S. persons, and certain distributions from corporations whose stock may constitute a USRPI, is increased from 10% to 15% for dispositions and distributions occurring after February 16, 2016. |
| | For dispositions and distributions on or after December 18, 2015, the stock ownership thresholds for exemption from FIRPTA taxation on sale of stock of a publicly traded REIT and for recharacterizing capital gain dividends received from a publicly traded REIT as ordinary dividends is increased from not more than 5% to not more than 10%. |
| | Effective December 18, 2015, certain look-through, presumption, and other rules will apply for purposes of determining if we qualify as domestically controlled. |
| | For dispositions and distributions after December 18, 2015, certain qualified foreign pension funds satisfying certain requirements, as well as entities that are wholly owned by a qualified foreign pension fund, are exempt from income and withholding taxes applicable under FIRPTA. In addition, new FIRPTA rules apply to ownership of REIT shares by qualified shareholders, which generally include publicly traded non-U.S. stockholders meeting certain requirements. |
- 63 -
Table of Contents
Our Qualification as a REIT
We have elected to qualify, and operate our business so as to qualify, to be taxed as a REIT under Sections 856 through 860 of the Internal Revenue Code commencing with our taxable year ended December 31, 2013. We believe that we have been organized and operated, and we intend to continue to operate, in such a manner so as to qualify for taxation as a REIT under the Internal Revenue Code. Qualification and taxation as a REIT depends on our ability to satisfy, among other requirements, certain asset and income tests, some of which depend upon the classification of at least 75% of the fair market value of our assets as real estate assets under the Internal Revenue Code. As described above, the PATH Act has changed certain rules affecting REIT qualification and taxation. In May 2014, the United States Department of the Treasury published proposed regulations which, if adopted in the form proposed, would revise the definition of real property for purposes of the REIT income and asset tests. Most of the new rules and the proposed regulations are not yet in effect, and, depending upon whether and in what form they are actually adopted and how if adopted they are interpreted, may affect the classification of certain of our assets under these tests, and thus could require us to alter our mix of assets, adjust our approach to qualifying as a REIT or adjust our business strategy. The proposed regulations are proposed to be effective for calendar quarters beginning after they are published in final form. The Treasury has not indicated whether or when the proposed regulations will be finalized.
In order for us to continue to qualify as a REIT under the Internal Revenue Code, shares of our stock must be owned by 100 or more persons during at least 335 days of a taxable year of 12 months. Also, not more than 50% of the value of the outstanding shares of our stock may be owned, directly or constructively, by five or fewer individuals (as defined in the Internal Revenue Code to include certain entities) during the last half of a taxable year. To assist us in preserving our REIT qualification, among other purposes, our charter generally prohibits any person from directly or indirectly owning more than 9.8% in value or in number of shares, whichever is more restrictive, of the aggregate outstanding shares of our capital stock, the outstanding shares of any class or series of our preferred stock or the outstanding shares of our common stock. Our board of directors has established exceptions from these ownership limits in our charter which permits certain institutional investors and their clients to hold shares of our common stock in excess of these ownership limits.
Critical Accounting Policies and Use of Estimates
Our financial statements are prepared in accordance with U.S. GAAP, which requires the use of estimates and assumptions that involve the exercise of judgment and use of assumptions as to future uncertainties. The following discussion addresses the accounting policies that we use. Our most critical accounting policies involve decisions and assessments that could affect our reported assets and liabilities, as well as our reported revenues and expenses. We believe that all of the decisions and assessments upon which our financial statements are based are reasonable at the time made and based upon information available to us at that time. Our critical accounting policies and accounting estimates may be expanded over time. Those material accounting policies and estimates that we expect to be most critical to an investors understanding of our financial results and condition and require complex management judgment are discussed below. See Note 2 of the audited financial statements in this Form 10-K for further details on our accounting policies.
Financing Receivables
Financing receivables include financing energy efficiency and renewable energy project loans, receivables and direct financing leases.
Unless otherwise noted, we generally have the ability and intent to hold our financing receivables for the foreseeable future and thus they are classified as held for investment. Our ability and intent to hold certain financing receivables may change from time to time depending on a number of factors, including economic, liquidity and capital conditions. The carrying value of financing receivables held for investment represents the present value of the note, lease or other payments, net of any unearned fee income, which is recognized as income over the term of the note or lease using the effective interest method. Financing receivables that are held
- 64 -
Table of Contents
for investment are carried, unless deemed impaired, at cost, net of any unamortized acquisition premiums or discounts and include origination and acquisition costs, as applicable. Financing receivables that we intend to sell in the short-term are classified as held-for-sale and are carried at the lower of amortized cost or fair value on our balance sheet. The net purchases and proceeds from these sales of our held-for-sale financing receivables are recorded as an operating activity in our statement of cash flows based on our intent at the time of purchase. We may secure nonrecourse debt with the proceeds from our financing receivables.
We evaluate our financing receivables for potential delinquency or impairment on at least a quarterly basis and more frequently when economic or other conditions warrant such an evaluation. When a financing receivable becomes 90 days or more past due, and if we otherwise do not expect the debtor to be able to service all of its debt or other obligations, we will generally consider the financing receivable delinquent or impaired and place the financing receivable on non-accrual status and cease recognizing income from that financing receivable until the borrower has demonstrated the ability and intent to pay contractual amounts due. If a financing receivables status significantly improves regarding the debtors ability to service the debt or other obligations, we will remove it from non-accrual status.
A financing receivable is also considered impaired as of the date when, based on current information and events, it is determined that it is probable that we will be unable to collect all amounts due in accordance with the original contracted terms. Many of our financing receivables are secured by energy efficiency and renewable energy infrastructure projects. Accordingly, we regularly evaluate the extent and impact of any credit deterioration associated with the performance and value of the underlying project, as well as the financial and operating capability of the borrower, its sponsors or the obligor as well as any guarantors. We consider a number of qualitative and quantitative factors in our assessment, including, as appropriate, a projects operating results, loan-to-value ratios and any cash reserves, the ability of expected cash from operations to cover the cash flow requirements currently and into the future, key terms of the transaction, the ability of the borrower to refinance the transaction, other credit support from the sponsor or guarantor and the projects collateral value. In addition, we consider the overall economic environment, the sustainable infrastructure sector, the effect of local, industry, and broader economic factors, the impact of any variation in weather and the historical and anticipated trends in interest rates, defaults and loss severities for similar transactions.
If a financing receivable is considered to be impaired, we record an allowance to reduce the carrying value of the financing receivable to the present value of expected future cash flows discounted at the financing receivables contractual effective rate or the amount realizable from other contractual terms such as the currently estimated fair market value of the collateral less estimated selling costs, if repayment is expected solely from the collateral. We charge off financing receivables against the allowance when we determine the unpaid principal balance is uncollectible, net of recovered amounts.
We record income from financing receivables held on our balance sheet on an accrual basis to the extent amounts are expected to be collected. We expect that income on our financing receivables will be accrued based on the actual coupon rate and the outstanding principal balance of such securities, or if no actual coupon rate exists, using the effective interest method. Premiums and discounts will be amortized or accreted into income over the lives of the financing receivables using the effective yield method, as adjusted for actual prepayments in accordance with ASC 310-40, ReceivablesNonrefundable Fees and Other Costs. For financing receivables that are direct financing leases under ASC 840, Leases, we amortize the unearned income to income over the lease term to produce a constant periodic rate of return on the net investment in the lease.
Investments
Investments include debt securities that meet the criteria of ASC 320, InvestmentsDebt and Equity Securities. As a result of the sale of certain debt securities previously designated as held-to-maturity in 2014, we have designated our debt securities as available-for-sale and will carry these securities at fair value on our balance sheet from that date. Unrealized gains and losses, to the extent not considered other than temporary impairment (OTTI), on available-for-sale debt securities are recorded as a component of accumulated other comprehensive income (OCI) in equity on our balance sheet.
- 65 -
Table of Contents
We evaluate our investments for OTTI on at least a quarterly basis, and more frequently when economic or market conditions warrant such an evaluation. Our OTTI assessment is a subjective process requiring the use of judgments and assumptions. Accordingly, we regularly evaluate the extent and impact of any credit deterioration associated with the financial and operating performance and value of the underlying project. We consider a number of qualitative and quantitative factors in our assessment. We first consider the current fair value of the security and the duration of any unrealized loss. Other factors considered include changes in the credit rating, performance of the underlying project, key terms of the transaction, the value of any collateral and any support provided by the sponsor or guarantor.
To the extent that we have identified an OTTI for a security and intend to hold the investment to maturity and we do not expect that we will be required to sell the security prior to recovery of the amortized cost basis, we recognize only the credit component of OTTI in earnings. We determine the credit component using the difference between the securities amortized cost basis and the present value of its expected future cash flows, discounted using the effective interest method or its estimated collateral value. Any remaining unrealized loss due to factors other than credit, or the non-credit component, is recorded in accumulated OCI.
To the extent we hold investments with an OTTI and if we have made the decision to sell the security or it is more likely than not that we will be required to sell the security prior to recovery of its amortized cost basis, we recognize the entire portion of the impairment in earnings.
We expect that income on investments that are debt securities will be accrued based on the actual coupon rate and the outstanding principal balance of such securities, or if no actual coupon rate exists, using the effective interest method. Premiums or discounts on investment securities are amortized or accreted into investment interest income using the effective interest method.
Real Estate
Real estate reflects land or other real estate held on our balance sheet. Real estate intangibles reflect the value of associated lease intangibles, net of any amortization. In accordance with ASC 805, Business Combinations, the fair value of the real estate acquired in a business combination with in-place leases is allocated to (i) the acquired tangible assets, consisting of land or other real property such as buildings, and (ii) the identified intangible assets and liabilities, consisting of the value of above-market and below-market leases and the value of other acquired intangible assets, based in each case on their fair values.
The fair value of the tangible assets of an acquired leased property is determined by valuing the property as if it were vacant, and the as-if-vacant value is then allocated to land, building and tenant improvements, if any, based on the determination of the fair values of these assets. The as-if-vacant fair value of a property is determined by management based on an appraisal of the property by a qualified appraiser.
In allocating the fair value of the identified intangible assets and liabilities of an acquired property, above-market and below-market in-place lease values are recorded as intangible assets based on the present value (using an interest rate which reflects the risks associated with the leases acquired) of the difference between (i) the contractual amounts to be paid pursuant to the in-place leases, and (ii) managements estimate of fair market lease rates for the corresponding in-place leases, measured over a period equal to the remaining term of the lease, including renewal periods likely of being exercised by the lessee. The capitalized above-market lease values are amortized as a reduction of rental income and the capitalized below-market lease values are amortized as an increase to rental income. We also record, as appropriate, an intangible asset for in-place leases. The value of the leases in place at the time of the transaction is equal to the potential revenue (rent and expenses) lost if the leases were not in place (during downtime) and that would be incurred to obtain the lease. The amortization is calculated over the initial term unless management believes that it is likely that the tenant would exercise the renewal option, whereby we would amortize the value attributable to the renewal over the renewal period. If a lease were to be terminated, all unamortized amounts relating to that lease would be written off.
- 66 -
Table of Contents
We record the purchases of real estate, other than in a business combination (i.e. real estate with no in-places leases), as asset acquisitions that are recorded at cost, including acquisition and closing costs.
Our real estate is generally leased to tenants on a net lease basis, whereby the tenant is responsible for all operating expenses relating to the property, generally including property taxes, insurance, maintenance, repairs and capital expenditures. Scheduled rental revenue typically varies during the lease term and thus rental income is recognized on a straight-line basis, unless there is considerable risk as to collectability, so as to produce a constant periodic rent over the term of the lease. Accrued rental income is the aggregate difference between the scheduled rents which vary during the lease term and the income recognized on a straight-line basis and is recorded in other assets. Rental expenses (if any) are charged to operations as incurred.
Securitization of Receivables
We have established various special purpose entities or securitization trusts for the purpose of securitizing certain financing receivables or other debt investments. We determined that the trusts used in securitizations are variable interest entities, as defined in ASC 810, Consolidation. We typically serve as primary or master servicer of these trusts; however, as the servicer, we do not have the power to make significant decisions impacting the performance of the trusts. Based on an analysis of the structure of the trusts, under U.S. GAAP, we have concluded that we are not the primary beneficiary of the trusts as we do not have power over the trusts significant activities. Therefore, we do not consolidate these trusts in our consolidated financial statements.
We account for transfers of financing receivables to these securitization trusts as sales pursuant to ASC 860, Transfers and Servicing, as we have concluded the transferred receivables have been isolated from the transferor (i.e., put presumptively beyond the reach of the transferor and its creditors, even in bankruptcy or other receivership) and we have surrendered control over the transferred receivables. We have received true-sale-at-law opinions for all of our securitization trust structures and non-consolidation legal opinions for all but one old securitization trust structure that support our conclusion regarding the transferred receivables. When we sell receivables in securitizations, we generally retain minor interests in the form of servicing rights and residual assets, which we refer to as securitization assets.
Gain or loss on the sale of receivables is calculated based on the excess of the proceeds received from the securitization (less any transaction costs) plus any retained interests obtained over the cost basis of the receivables sold. For retained interests, we generally estimate fair value based on the present value of future expected cash flows using our best estimates of the key assumptions of anticipated losses, prepayment rates, and current market discount rates commensurate with the risks involved.
We initially account for all separately recognized servicing assets and servicing liabilities at fair value and subsequently measure such servicing assets and liabilities using the amortization method. Servicing assets and liabilities are amortized in proportion to, and over the period of, estimated net servicing income with servicing income recognized as earned. We assess servicing assets for impairment at each reporting date. If the amortized cost of servicing assets is greater than the estimated fair value, we will recognize an impairment in net income.
Our other retained interest in securitized assets, the residual assets, are classified as available-for-sale securities and carried at fair value on the consolidated balance sheets in Other Assets. We generally do not sell our residual assets. Our residual assets are evaluated for impairment on a quarterly basis.
Interest income related to the residual assets is recognized using the effective interest rate method. If there is a change in expected cash flows related to the residual assets, we calculate a new yield based on the current amortized cost of the residual assets and the revised expected cash flows. This yield is used prospectively to recognize interest income.
- 67 -
Table of Contents
Other Fee Income
We may periodically provide services, including arranging financing that is held on the balance sheet of other investors and advising various companies with respect to structuring investments. For services that are separately identifiable and where evidence exists to substantiate fair value, income is recognized as earned, which is generally when the investment or other applicable transaction closes. Retainer fees are amortized over the performance period.
Valuation of Financial Instruments
ASC 820 establishes a framework for measuring fair value in accordance with U.S. GAAP and expands financial statement disclosure requirements for fair value measurements. ASC 820 further specifies a hierarchy of valuation techniques, which is based on whether the inputs into the valuation technique are observable or unobservable. Where inputs for a financial asset or liability fall in more than one level in the fair value hierarchy, the financial asset or liability is classified in its entirety based on the lowest level input that is significant to the fair value measurement of that financial asset or liability. We use our judgment and consider factors specific to the financial assets and liabilities in determining the significance of an input to the fair value measurements. As of December 31, 2015 and 2014, only our residual assets, financing receivables held-for-sale, interest rate swaps and investments available-for-sale, if any, were carried at fair value on the consolidated balance sheets on a recurring basis. The three levels of the fair value hierarchy are described below:
| | Level 1Quoted prices (unadjusted) in active markets that are accessible at the measurement date. |
| | Level 2Observable prices that are based on inputs not quoted on active markets, but corroborated by market data. |
| | Level 3Unobservable inputs that are used when little or no market data is available. |
For financial assets and liabilities carried at fair value, we use quoted market prices, when available, to determine the fair value of an asset or liability. If quoted market prices are not available, we consult independent pricing services or third party broker quotes, provided that there is no ongoing material event that affects the issuer of the securities being valued or the market thereof. If there is such an ongoing event, or if quoted market prices are not available, we will determine the fair value of the securities using valuation techniques that use, when possible, current market-based or independently-sourced market parameters, such as interest rates.
Fair value for most of our assets are measured using a discounted cash flow model, contractual terms and Level 3 unobservable inputs which consist of base interest rates and spreads over base rates which are based upon market observation and recent comparable transactions. An increase in these unobservable inputs would result in a lower fair value and a decline would result in a higher fair value. Fair value under U.S. GAAP represents an exit price in the normal course of business, not a forced liquidation price. If we were forced to sell assets in a short period to meet liquidity needs, the prices we receive could be substantially less than their recorded fair values. Furthermore, the analysis of whether it is more likely than not that we will be required to sell securities in an unrealized loss position prior to an expected recovery in value (if any), the amount of such expected required sales, and the projected identification of which securities would be sold is also subject to significant judgment, particularly in times of market illiquidity.
Any changes to the valuation methodology will be reviewed by our investment committee to ensure the changes are appropriate. As markets and products develop and the pricing for certain products becomes more transparent, we will continue to refine our valuation methodologies. The methods used by us may produce a fair value calculation that may not be indicative of net realizable value or reflective of future fair values. Furthermore, while we anticipate that our valuation methods will be appropriate and consistent with other market participants, the use of different methodologies, or assumptions, to determine the fair value of certain financial instruments could result in a different estimate of fair value at the reporting date. We will use inputs that are current as of the measurement date, which may include periods of market dislocation, during which price transparency may be reduced.
- 68 -
Table of Contents
Variable Interest Entities and Equity Method Investments in Affiliates
We account for our investment in entities that are considered voting or variable interest entities under ASC 810. We perform an ongoing assessment to determine the primary beneficiary of each entity as required by ASC 810. We have established various special purpose entities or securitization trusts for the purpose of securitizing certain financing receivables or other debt investments which are not consolidated in our financial statements as described in Securitization of Receivables above.
Substantially all of the activities of the special purpose entities that are formed for the purpose of holding our financing receivables and investments on our balance sheet are closely associated with our activities. Based on our assessment, we determined that we have power over and receive the benefits of these special purpose entities; hence, we are the primary beneficiary and should consolidate these entities under the provisions of ASC 810.
As described in Note 1 of the audited financial statements in this Form 10-K, we made equity investments in various wind projects. Wind projects are typically owned in partnerships structures (using limited liability corporations, or LLCs taxed as partnerships) where we, along with other large institutional investors, if any, receive a stated preferred return consisting of a priority distribution of the projects cash flows, and in some cases, tax attributes. Once this preferred return is achieved, the partnership flips and the wind energy company which operates the project, receives the a larger portion of the cash flows through its interest in the holding company and we, along with the other institutional investors, will have an on-going residual interest.
The limited liability entities with JPMorgan Chase & Co. (JPMorgan) (which own the interest in the holding companies that own certain of the wind projects) are jointly controlled with each member owning 50% of the voting stock. Based on our assessment, we have determined that these entities are voting interest entities and we have the ability to exercise influence over their operating and financial policies and as such we therefore account for such investments using the equity method. JPMorgan has certain rights to withdraw from the partnership in the future in which case we would be obligated to buy their interest at the fair market value at the time of withdraw.
We own directly, or indirectly as partners with JPMorgan, interests in various limited liability holding companies that own wind projects. Each of the holding companies is partially owned and operated by a wind energy company. Based on our assessment, we have determined that each of the holding companies (including the acquired ownership interest in the Creston Ridge Management, LLC and Buckeye Wind Energy Class B Holdings LLC) is a variable interest entity and that we have the ability to exercise influence over operating and financial policies of the holding companies, but we are not the primary beneficiary as we do not have the power to direct the most important decisions related to the most significant activities of the investment. Thus we do not consolidate the limited liability entities or the holding companies, but account for them using the equity method of accounting as described below. Our maximum exposure to loss associated with these entities is limited to our investment.
Under the equity method of accounting, the carrying value of our equity method investments is determined based on amounts we invested, adjusted for the equity in earnings or losses of investee allocated based on the limited liability entity agreement, less distributions received. Because the limited liability entity and holding company agreements contain preferences with regard to cash flows from operations, capital events and liquidation, we reflect our share of profits and losses by determining the difference between our claim on the investees book value at the end and the beginning of the period. This claim is calculated as the amount we would receive (or be obligated to pay) if the investee were to liquidate all of its assets at recorded amounts determined in accordance with U.S. GAAP and distribute the resulting cash to creditors and investors in accordance with their respective priorities. This method is commonly referred to as the hypothetical liquidation at book value method or (HLBV). Intra-company gains and losses are eliminated for an amount equal to our interest and are reflected in the share in loss from equity method investment in affiliate in the consolidated
- 69 -
Table of Contents
statements of operations. Cash distributions received from our equity method investments are classified as operating cash flows to the extent of cumulative HLBV earnings. Any additional cash flows are deemed to be returns of the investment and are classified as investing cash flows.
We evaluate the realization of our investment accounted for using the equity method if circumstances indicate that our investment is OTTI. OTTI impairment occurs when the estimated fair value of an investment is below the carrying value and the difference is determined to not be recoverable. This evaluation requires significant judgment regarding, but not limited to, the severity and duration of the impairment; the ability and intent to hold the securities until recovery; financial condition, liquidity, and near-term prospects of the issuer; specific events; and other factors. Based on an evaluation of our equity method investments, we determined that no impairment had occurred for 2015 or 2014. We did not have any equity method investments as of December 31, 2013.
Derivative Financial Instruments
We may utilize derivative financial instruments, primarily interest rate swaps, to manage, or hedge, our interest rate risk exposures associated with new debt issuances, to manage our exposure to fluctuations in interest rates on variable rate debt, and to optimize the mix of our fixed and floating-rate debt. In addition, we may use forward-starting interest rate swap contracts to manage a portion of our interest rate exposure for anticipated refinancing of our long-term debts. Our objective is to manage the impact of interest rates on the results of operations and cash flows and the market value of our debt.
We use interest rate swaps designated as cash flow hedges to manage our interest rate exposures associated with new debt issuances and to manage our exposure to fluctuations in interest rates on variable rate debt. We attempt to use derivative instruments that are considered highly effective in reducing our exposure to the interest rate risk that they are designated to hedge. This effectiveness is essential in order to qualify for hedge accounting. Instruments that meet these hedging criteria are formally designated as hedges at the inception of the derivative contract. Derivatives are recorded on the consolidated balance sheet at fair value. If a derivative is designated as a cash flow hedge, the effective portions of changes in the fair value of the derivative are recorded in Accumulated other comprehensive income, net of associated deferred income tax effects, in our Consolidated Statements of Stockholders Equity and Comprehensive Income (Loss) and are recognized in the Consolidated Statements of Operations when the hedged item affects earnings. Changes in fair value of the ineffective portions of these hedges are recognized in Other, net in our Consolidated Statements of Operations. For derivative instruments not designated as hedging instruments, changes in fair value are recognized in our Consolidated Statements of Operations in the period that the change occurs. We assess, both at the inception of the hedge and on an ongoing basis, whether the derivatives that are used in hedging transactions are highly effective in offsetting changes in cash flows of hedged items. As of December 31, 2015, all of our derivatives were designated as hedging instruments and there was no ineffectiveness recorded on our designated hedges. As of December 31, 2014 or 2013, we did not hold any derivatives. We do not hold derivatives for trading purposes.
Interest rate swap contracts contain a credit risk that counterparties may be unable to fulfill the terms of the agreement. We attempt to minimize that risk by evaluating the creditworthiness of its counterparties, who are limited to major banks and financial institutions, and do not anticipate nonperformance by the counterparties.
Income Taxes
We elected and qualified to be taxed as a REIT for U.S. federal income tax purposes, commencing with our taxable year ended December 31, 2013. To qualify as a REIT, we must meet a number of organizational and operational requirements, including a requirement that we currently distribute at least 90% of our net taxable income, excluding capital gains, to our shareholders. We intend to continue to meet the requirements for qualification as a REIT. As a REIT, we are not subject to U.S. federal corporate income tax on that portion of net income that is currently distributed to our owners. However, our taxable REIT subsidiaries (TRS) will
- 70 -
Table of Contents
generally be subject to U.S. federal, state, and local income taxes as well as taxes of foreign jurisdictions, if any. Prior to the completion of the IPO, the Predecessor was taxed as a partnership for U.S. federal income tax purposes.
We account for income taxes of our TRS using the asset and liability method. Deferred tax assets and liabilities are recognized for the estimated future tax consequences attributable to the differences between the consolidated financial statement carrying amounts of existing assets and liabilities and their respective tax bases. Deferred tax assets and liabilities are measured using enacted tax rates in effect for the year in which those temporary differences are expected to be recovered or settled. The effect on deferred tax assets and liabilities from a change in tax rates is recognized in earnings in the period when the new rate is enacted.
We apply accounting guidance with respect to how uncertain tax positions should be recognized, measured, presented, and disclosed in the financial statements. This guidance requires the accounting and disclosure of tax positions taken or expected to be taken in the course of preparing our tax returns to determine whether the tax positions are more likely than not to be sustained by the applicable tax authority. We are required to analyze all open tax years, as defined by the statute of limitations, for all major jurisdictions, which includes U.S. federal and certain states. We have no examinations in progress, none are expected at this time, and years 2012 through 2014 are open. As of December 31, 2015 and 2014, we had no uncertain tax positions. Our policy is to recognize interest expense and penalties related to income tax matters as a component of other expense. There were no accrued interest and penalties as of December 31, 2015 or 2014, and no interest and penalties were recognized during the years ended December 31, 2015, 2014 or 2013.
Equity-Based Compensation
At the time of completion of our IPO, we adopted the 2013 Plan, which provides for grants of stock options, stock appreciation rights, restricted stock units, shares of restricted common stock, phantom shares, dividend equivalent rights, LTIP units and other restricted limited partnership units issued by our Operating Partnership and other equity-based awards. From time to time, we may award unvested restricted stock as compensation to members of our senior management team, our independent directors, employees, advisors, consultants and other personnel under our 2013 Plan.
We record compensation expense for stock awards in accordance with ASC 718, CompensationStock Compensation. We record compensation expense for unvested shares that vest solely based on service conditions on a straight-line basis over the vesting period based upon the fair market value of the shares on the date of grant, adjusted for forfeitures. For awards where the vesting is contingent upon achievement of certain performance targets, compensation expense is recorded over the requisite service period (which includes the performance period) based on our estimate of the achievement of the various performance targets, adjusted for forfeitures. Our share price at the date of grant and actual performance results at the end of the performance period determine the fair value and the number of shares that will ultimately be awarded. The award earned is generally between 0% and 150% of the initial target, depending on the extent to which the performance target are met. If minimum performance targets are not attained, no awards will be made.
Segment Reporting
We provide and arrange debt and equity financing for sustainable infrastructure projects and report all of our activities as one business segment.
Results of Operations
We completed approximately $935 million of transactions during 2015, compared to approximately $875 million during 2014. Our strategy includes holding a large portion of these transactions on our balance sheet to . As of December 31, 2015, we held approximately $1.3 billion of our assets on our balance sheet, including approximately 75% of our 2015 transactions. We refer to the transactions we hold on our balance sheet as of a given date as our Portfolio.
- 71 -
Table of Contents
Our Portfolio
As of December 31, 2015, approximately 64% of our Portfolio consisted of loans, financing receivables, direct financing leases or debt securities with 59% structured with fixed rates and 5% structured with floating rates. Approximately 12% of our Portfolio was real estate with long-term leases and approximately 24% represented equity ownership of wind projects. Excluding our equity investments, approximately 45% of our Portfolio consisted of U.S. federal government or state or local government obligors, approximately 54% consisted of investment grade commercial obligations and 1% consisted of non-investment grade rated commercial obligations, in all cases rated either by an independent third party rating service or our internal credit rating system. Our Portfolio consisted of over 105 transactions and the weighted average remaining life of our Portfolio as of December 31, 2015, (excluding match-funded transactions) was approximately ten years.
The following is an analysis of our Portfolio by type of obligor and credit quality as of December 31, 2015:
| Investment Grade | Commercial Non- Investment Grade (3) |
Subtotal, Debt and Real Estate |
Equity Method Investments (4) |
Total | ||||||||||||||||||||
| Government (1) | Commercial Investment Grade (2) |
|||||||||||||||||||||||
| (dollars in millions) | ||||||||||||||||||||||||
| Financing receivables |
$ | 401 | $ | 383 | $ | | $ | 784 | $ | | $ | 784 | ||||||||||||
| Financing receivables held-for-sale |
60 | | | 60 | | 60 | ||||||||||||||||||
| Investments |
| 16 | 13 | 29 | | 29 | ||||||||||||||||||
| Real estate (5) |
| 156 | | 156 | | 156 | ||||||||||||||||||
| Equity method investments |
| | | | 319 | 319 | ||||||||||||||||||
|
|
|
|
|
|
|
|
|
|
|
|
|
|||||||||||||
| Total |
$ | 461 | $ | 555 | $ | 13 | $ | 1,029 | $ | 319 | $ | 1,348 | ||||||||||||
|
|
|
|
|
|
|
|
|
|
|
|
|
|||||||||||||
| % of Debt and Real Estate Portfolio |
45 | % | 54 | % | 1 | % | 100 | % | N/A | N/A | ||||||||||||||
| Average Remaining Balance (6) |
$ | 12 | $ | 9 | $ | 13 | $ | 10 | $ | 27 | $ | 12 | ||||||||||||
| (1) | Transactions where the ultimate obligor is the U.S. federal government or state or local governments where the obligors are rated investment grade (either by an independent rating agency or based upon our internal credit analysis). This amount includes $297 million of U.S. federal government transactions and $164 million of transactions where the ultimate obligors are state or local governments. Transactions may have guaranties of energy savings from third party service providers, the majority of which are entities rated investment grade by an independent rating agency. |
| (2) | Transactions where the projects or the ultimate obligors are commercial entities, including institutions such as hospitals or universities, that have been rated investment grade (either by an independent rating agency or based on our internal credit analysis). Of this total, $12 million of the transactions have been rated investment grade by an independent rating agency. Commercial investment grade financing receivables include $175 million of internally rated residential solar loans where the cash flows which support our financing receivables are subordinated to the tax equity investors (whose return is largely derived from the renewable energy tax incentives) and for which we rely on certain tax related indemnities of the publicly traded residential solar provider. |
| (3) | Transactions where the projects or the ultimate obligors are commercial entities, including institutions such as hospitals or universities, that have ratings below investment grade (either by an independent rating agency or using our internal credit analysis). |
| (4) | Consists of ownership interests in operating wind projects in which we earn a preferred return. |
| (5) | Includes the real estate and the lease intangible assets through which we receive scheduled lease payments, typically under long-term triple net lease agreements. |
| (6) | Excludes 77 transactions each with outstanding balances that are less than $1 million and that in the aggregate total $26 million. |
- 72 -
Table of Contents
The table below provides details on the interest rate and maturity of our financing receivables and investments as of December 31, 2015:
| Balance in Millions |
Maturity | |||||
| Floating-rate financing receivable, interest rate of 5.78% per annum |
$ | 73 | 2020 | |||
| Fixed-rate financing receivables, interest rates from 1.52% to 5.00% per annum |
341 | 2017 to 2039 | ||||
| Fixed-rate financing receivables, interest rates from 5.01% to 6.50% per annum |
179 | 2017 to 2038 | ||||
| Fixed-rate financing receivables, interest rates from 6.51% to 9.62% per annum |
191 | 2018 to 2069 | ||||
|
|
|
|||||
| Financing receivables |
784 | |||||
| Allowance for credit losses |
| |||||
|
|
|
|||||
| Financing receivables, net of allowance |
784 | |||||
| Financing receivables held-for-sale, interest rate of 3.19% to 3.99% per annum |
60 | 2026 to 2031 | ||||
| Fixed-rate investment in debt securities, interest rates of 4.25% to 5.89% per annum |
29 | 2017 to 2035 | ||||
|
|
|
|||||
| Total Financing Receivables and Investments |
$ | 873 | ||||
|
|
|
|||||
The table below presents, for each major category of our Portfolio and the related interest-bearing liabilities, the average outstanding balances, investment income earned, the interest expense incurred, and average yield or cost. Our earnings from our equity method investments are not included in Total Revenue and thus we have excluded our equity method investments and the related earnings and interest expenses from these calculations. Our net investment margin represents the difference between the interest, investment and rental income generated by our Portfolio and the interest expense, divided by our Portfolio balance.
| Years Ended December 31, | ||||||||||||
| 2015 | 2014 | 2013 | ||||||||||
| (In millions except for interest rate data) | ||||||||||||
| Interest Income, Financing receivables |
$ | 37 | $ | 23 | $ | 15 | ||||||
| Average monthly balance of financing receivables (1) |
$ | 703 | $ | 430 | $ | 272 | ||||||
| Average interest rate from financing receivables |
5.3 | % | 5.4 | % | 5.7 | % | ||||||
| Interest Income, Investments |
$ | 2 | $ | 4 | $ | 2 | ||||||
| Average monthly balance of investments |
$ | 28 | $ | 67 | $ | 34 | ||||||
| Average interest rate from investments |
5.3 | % | 5.7 | % | 5.6 | % | ||||||
| Rental Income |
$ | 9 | $ | 3 | $ | | ||||||
| Average monthly balance of real estate |
$ | 140 | $ | 50 | $ | | ||||||
| Average yield on real estate |
6.5 | % | 6.3 | % | | |||||||
| Average monthly balance of Portfolio |
$ | 871 | $ | 547 | $ | 306 | ||||||
| Average yield from Portfolio |
5.5 | % | 5.5 | % | 5.7 | % | ||||||
| Investment interest expense (2) |
$ | (20 | ) | $ | (15 | ) | $ | (10 | ) | |||
| Average monthly balance of debt (2) |
$ | 571 | $ | 381 | $ | 229 | ||||||
| Average interest rate from debt (2) |
3.4 | % | 4.0 | % | 4.3 | % | ||||||
| Average interest spread (2) |
2.1 | % | 1.5 | % | 1.4 | % | ||||||
| Net investment margin (2) |
3.3 | % | 2.7 | % | 2.5 | % | ||||||
| (1) | Excludes the allowance for credit losses of $1.2 million and $11.0 million as of December 31, 2014 and 2013, respectively. |
| (2) | Excludes the nonrecourse debt used to finance the equity investments in the wind projects because our earnings from the equity investments in the wind projects are not included in investment revenue. |
- 73 -
Table of Contents
The following table provides a summary of our anticipated principal repayments for our financing receivables and investments as of December 31, 2015:
| Payment due by Period | ||||||||||||||||||||
| Total | Less than 1 year |
1-5 years | 5-10 years | More than 10 years |
||||||||||||||||
| (dollars in millions) | ||||||||||||||||||||
| Financing Receivables (1) |
$ | 784 | $ | 31 | $ | 212 | $ | 192 | $ | 349 | ||||||||||
| Investments |
$ | 29 | $ | 1 | $ | 17 | $ | 4 | $ | 7 | ||||||||||
| (1) | Financing receivables does not include financing receivables held-for-sale of $60 million. |
For the anticipated maturity dates of our financing receivables and investments and the weighted average yield for each range of maturities as of December 31, 2015, see Note 6 of our audited financial statements in this Form 10-K.
For information on the term of our leases and a schedule of our future minimum rental income under our land lease agreements as of December 31, 2015, see Note 6 of our audited financial statements in this Form 10-K.
For information on our residual assets relating to our securitization trusts, see Note 5 of our audited financial statements in this Form 10-K. The residual assets do not have a contractual maturity date and the underlying securitized assets have contractual maturity dates ranging from 2016 to 2038.
Our non-investment grade rated commercial obligations as of December 31, 2015, include $13 million out of approximately $58 million in senior secured debt securities in an operating wind project with a long-term power purchase agreement with the remaining portion owned by a large financial institution (the Majority Debt Holder). As previously discussed in our 2014 Annual Report on Form 10-K, our Form 10-Qs for the quarters ended March 31, 2015, June 30, 2015 and September 30, 2015 and our Form 8-K dated October 13, 2015, although all interest and principal payments under these securities have been timely made, the trustee under the indenture for these securities determined that events of default arose under the indenture due to the termination of a tax credit agreement among project participants caused by a change of control in the parent company that owns the project and from the borrowers failure during separate intervals in 2015 to deliver sufficient funds to fund principal payments or to fund reserves allocated for future principal and interest payments under the indenture. As a result, approximately $1.1 million of the approximately $5.5 million debt service reserve for this project was used to fund the May 2015 principal payment and the borrower used an additional approximately $2.0 million out of this reserve to fund the payments made in early November 2015. On November 3, 2015, as a result of these defaults, the trustee, as directed by the Majority Debt Holder, provided a notice of acceleration and proposal of foreclosure relating to the outstanding debt securities. The project owner has agreed to the foreclosure proposal pending required regulatory approvals which are pending. The Majority Debt Holder is in the process of selling the project to a third party wind operator. Although there can be no assurances in this regard, we expect that the sales price would be sufficient to repay in full the remaining amounts due under the bonds and that the project sale to be completed in the first half of 2016. Based on our evaluation of our cash flow model for, and other aspects of, the project as well as the expected sales price, we have concluded that the debt securities were not impaired as of December 31, 2015.
We had no financing receivables, investments or leases on nonaccrual status as of December 31, 2015. We evaluate any modifications to our financing receivables in accordance with the guidance in ASC 310, Receivables. We evaluate modifications of financing receivables to determine if the modification is more than minor, whereby any related fees, such as prepayment fees, would be recognized as income at the time of the modification. We did not have any loan modifications that qualify as trouble debt restructurings for the years ended December 31, 2015, 2014 or 2013.
- 74 -
Table of Contents
Comparison of the Year Ended December 31, 2015 to the Year Ended December 31, 2014
| Years ended December 31 |
$ Change | % Change | ||||||||||||||
| 2015 | 2014 | |||||||||||||||
| (dollars in millions) | ||||||||||||||||
| Net Investment Revenue: |
||||||||||||||||
| Interest Income, Financing receivables |
$ | 37 | $ | 23 | $ | 14 | 61 | % | ||||||||
| Interest Income, Investments |
2 | 4 | (2 | ) | (50 | %) | ||||||||||
| Rental Income |
9 | 3 | 6 | 200 | % | |||||||||||
| Gain on sale of receivables and investments |
9 | 13 | (4 | ) | (31 | %) | ||||||||||
| Fee income |
2 | 2 | (0 | ) | | % | ||||||||||
|
|
|
|
|
|
|
|||||||||||
| Total Revenue |
59 | 45 | 14 | 31 | % | |||||||||||
| Investment interest expense |
(27 | ) | (16 | ) | (11 | ) | (69 | %) | ||||||||
| Provision for credit losses |
| | | | % | |||||||||||
|
|
|
|
|
|
|
|||||||||||
| Total Revenue, net of investment interest expense and provision |
32 | 29 | 3 | 10 | % | |||||||||||
|
|
|
|
|
|
|
|||||||||||
| Compensation and benefits |
(17 | ) | (11 | ) | (6 | ) | (55 | %) | ||||||||
| General and administrative |
(6 | ) | (6 | ) | (0 | ) | | % | ||||||||
| Acquisition costs |
| (2 | ) | 2 | 100 | % | ||||||||||
| Other, net |
(1 | ) | (0 | ) | (1 | ) | NM | |||||||||
| (Loss) from equity method investments in affiliates |
(0 | ) | | (0 | ) | NM | ||||||||||
|
|
|
|
|
|
|
|||||||||||
| Other Expenses, net |
(24 | ) | (19 | ) | (5 | ) | (26 | %) | ||||||||
|
|
|
|
|
|
|
|||||||||||
| Net Income (Loss) before income tax |
8 | 10 | (2 | ) | (20 | %) | ||||||||||
| Income tax (expense) benefit |
(0 | ) | (0 | ) | (0 | ) | NM | |||||||||
|
|
|
|
|
|
|
|||||||||||
| Net Income (Loss) |
$ | 8 | $ | 10 | $ | (2 | ) | (20 | %) | |||||||
|
|
|
|
|
|
|
|||||||||||
NMPercentage change is not meaningful.
Net Income
Net income decreased by $2 million to $8 million for the year ended December 31, 2015, compared to $10 million for the same period in 2014. A $3 million increase in in total revenue, net of investment interest expense and provision was offset by a $5 million increase in other expenses in the year ended December 31, 2015.
Our equity method investment in the wind projects had a significant impact on the changes in our operating results during the year ended December 31, 2015, when compared to the same period in 2014. For the year ended December 31, 2015, we recorded investment interest expense of $7 million related to the financing of our investment in the wind projects as compared on $2 million in 2014 and recorded an equity method loss related to those investments of $0 million in both periods. These results do not include the Non-GAAP Core Earnings adjustment related to recognizing income based on the effective interest methodology in order to treat this investment in a manner similar to our other investments, which is discussed in the Non-GAAP Financial Measures section below.
Total Revenue
Total revenue increased to $59 million for the year ended December 31, 2015, from $45 million in the same period in 2014. The increase was driven primarily by an increase in the average size of our Portfolio of assets held during the year ended December 31, 2015, when compared to the same period in 2014. The monthly average Portfolio balance increased to approximately $0.9 billion in the year ended December 31, 2015, from approximately $0.5 billion in the same period in 2014. This increase in our Portfolio was driven largely by
- 75 -
Table of Contents
additional investments in financing receivables, leading to an increase in our average monthly portfolio of financing receivables and investments of over $230 million for the year ended December 31, 2015, compared with the same period in 2014. In addition, the acquisition of our real estate investments beginning in May 2014 contributed approximately $140 million to the average monthly balance of our Portfolio and $9 million in rental revenue in the year ended December 31, 2015, as compared to contributing $50 million to the average monthly balance of real estate and $3 million in rental revenue for the year ended December 31, 2014. The increase from our Portfolio was offset by a $4 million decrease in gain on sale of receivables and investments for the year ended December 31, 2015, primarily as a result of fewer transactions and a lower margin on the sale of investments in the year ended December 31, 2015 when compared to same period in 2014.
Total Revenue, Net of Investment Interest Expense and Provision
Total revenue, net of investment interest expense and provision increased by $3 million for the year ended December 31, 2015 from $29 million for the year ended December 31, 2014. The increase in total revenue described above was offset by an $11 million increase in investment interest expense for the year ended December 31, 2015 when compared to the same period ended in 2014. As we have increased our leverage, the monthly average debt balance, excluding the nonrecourse secured borrowings used to finance the equity investments in the wind projects, increased in the year ended December 31, 2015 to approximately $571 million compared to approximately $381 million during the year ended December 31, 2014. Our average debt rate on these borrowings decreased to 3.4% during the year ended December 31, 2015, from 4.0% during the same period in 2014 due primarily to holding a higher average balance in the credit facility in 2015. The higher average monthly debt balance increased our investment interest expense by $5 million. The remaining increase in our investment interest expense is primarily related to the nonrecourse secured borrowings used to finance our equity method investments in wind projects.
Other Expenses, Net
Other expenses, net increased by $5 million primarily as a result of higher compensation and benefits costs of $6 million driven by higher equity based compensation expenses in the year ended December 31, 2015 of $5 million when compared to same period in 2014 and a $1 million change in other. Equity based compensation expense is calculated based upon actual and expected achievement of certain performance targets and or service-based vesting periods that may consist of multi-year periods. The 2015 equity based compensation expense includes expenses for awards granted in 2013, 2014 and 2015 that have performance periods and service-based vesting terms in 2015 and beyond. There were no business combination related acquisition costs in 2015 when compared to $2 million of costs incurred in 2014 related to our real estate acquisitions.
- 76 -
Table of Contents
Comparison of the Year Ended December 31, 2014 to the Year Ended December 31, 2013 (1)
| Years ended December 31 |
||||||||||||||||
| 2014 | 2013 | $ Change | % Change | |||||||||||||
| (dollars in millions) | ||||||||||||||||
| Net Investment Revenue: |
||||||||||||||||
| Interest Income, Financing receivables |
$ | 23 | $ | 15 | $ | 8 | 53 | % | ||||||||
| Interest Income, Investments |
4 | 2 | 2 | 100 | % | |||||||||||
| Rental Income |
3 | | 3 | NM | ||||||||||||
| Gain on sale of receivables and investments |
13 | 6 | 7 | 117 | % | |||||||||||
| Fee income |
2 | 1 | 1 | 100 | % | |||||||||||
|
|
|
|
|
|
|
|||||||||||
| Total Revenue |
45 | 24 | 21 | 88 | % | |||||||||||
| Investment interest expense |
(16 | ) | (10 | ) | (6 | ) | (60 | %) | ||||||||
| Provision for credit losses |
| (11 | ) | 11 | 100 | % | ||||||||||
|
|
|
|
|
|
|
|||||||||||
| Total Revenue, net of investment interest expense and provision |
29 | 3 | 26 | 867 | % | |||||||||||
|
|
|
|
|
|
|
|||||||||||
| Compensation and benefits |
(11 | ) | (12 | ) | 1 | 8 | % | |||||||||
| General and administrative |
(6 | ) | (4 | ) | (2 | ) | (50 | %) | ||||||||
| Acquisition costs |
(2 | ) | | (2 | ) | NM | ||||||||||
| Other, net |
(0 | ) | (0 | ) | 0 | NM | ||||||||||
|
|
|
|
|
|
|
|||||||||||
| Other Expenses, net |
(19 | ) | (16 | ) | (3 | ) | (19 | %) | ||||||||
|
|
|
|
|
|
|
|||||||||||
| Net Income (Loss) before income tax |
10 | (13 | ) | 23 | 177 | % | ||||||||||
| Income tax (expense) benefit |
0 | 0 | (0 | ) | NM | |||||||||||
|
|
|
|
|
|
|
|||||||||||
| Net Income (Loss) |
$ | 10 | $ | (13 | ) | $ | 23 | 177 | % | |||||||
|
|
|
|
|
|
|
|||||||||||
| (1) | Year ended December 31, 2103 includes results of our Predecessor prior to our IPO. See Part 1 of this 10-K for further information. |
NMPercentage change is not meaningful.
Net Income
Net income increased by $23 million to $10 million for the year ended December 31, 2014, compared to a loss of $13 million for the same period in 2013. This increase was primarily the result of a $26 million increase in total revenue, net of investment interest expense and provision that was driven primarily by the increase in the size of our Portfolio including our new investments in real estate that drove the increase in rental income, an increase in our securitization transactions and sale of investments when comparing the year ended December 31, 2014 to the same period in 2013, and the $11 million provision for credit losses in the year ended December 31, 2013. In addition, other expenses, net increased by $3 million due primarily to acquisitions costs of $2 million and a $2 million net increase in general and administrative expenses and other resulting from higher legal, consulting and accounting costs associated with being a public company, offset by a $1 million decrease in compensation and benefits as a result of lower equity-based compensation, during the year ended December 31, 2014, compared to the same period in 2013.
Our equity method investment in the wind projects had a significant impact on the changes in our operating results during the year ended December 31, 2014, when compared to the same period in 2013. For the year ended December 31, 2014, we recorded investment interest expense of $2 million related to the financing of our investment in the wind projects. We did not have our equity method investments in 2013. These results do not include the Non-GAAP Core Earnings adjustment related to recognizing income based on the effective interest methodology in order to treat this investment in a manner similar to our other investments, which is discussed in the Non-GAAP Financial Measures section below.
- 77 -
Table of Contents
Total Revenue
Total revenue increased to $45 million for the year ended December 31, 2014, from $24 million in the same period in 2013. The increase was driven primarily by an increase in the average size of our Portfolio of assets held during the year ended December 31, 2014, when compared to the same period in 2013. The monthly average Portfolio balance increased to approximately $547 million in the year ended December 31, 2014, from approximately $306 million in the same period in 2013. This increase in our Portfolio was driven by our strategy to hold more originated transactions on our balance sheet to increase our shareholders value. The increase in our Portfolio was partially offset by a decline in average interest rates earned on these assets, which decreased to 5.5% in the year ended December 31, 2014, from 5.7% in the same period in 2013. This decrease was driven primarily by the impact of the current lower interest rate environment as compared to the historical rate environment when our legacy portfolio was originated. Our larger Portfolio, partially offset by lower interest rates, generated a $13 million increase in interest and rental income.
Gain on sale of receivables and investments increased by $7 million for the year ended December 31, 2014, when compared to the year ended December 31, 2013. The increase was the result of higher transaction volume in 2014 when compared to 2013. Fee income in 2014 also increased by $1 million primarily as a result of an increase in the value of syndication fee transactions closed in the year ended December 31, 2014 when compared to such transactions closed in the same period in 2013.
Total Revenue, Net of Investment Interest Expense and Provision
Total revenue, net of investment interest expense and provision increased by $26 million to $29 million for the year ended December 31, 2014, compared to $3 million for the same period in 2013. This increase was primarily a result of the $21 million increase in total revenue as described above. Additionally, there was no provision for credit loss recorded in the year ended December 31, 2014, while a provision for credit loss of $11 million relating to a mezzanine debt investment in a geothermal project was recorded in the year ended December 31, 2013.
These increases were offset by an increase in investment interest expense of $6 million in the year ended December 31, 2014, compared to the same period in 2013. We used our existing credit facility and our nonrecourse debt to finance the majority of the growth in our Portfolio as the monthly average debt balance increased in the year ended December 31, 2014, to approximately $381 million compared to approximately $229 million during the same period in 2013. This increase in our monthly average debt balance was the primary driver for the increase in our investment interest expense when comparing the year ended December 31, 2014, to the same period ended December 31, 2013. Our average debt rate decreased to 4.0% during the year ended December 31, 2014, from 4.3% for the same period ending December 31, 2013, due to the lower interest rates on our credit facility and our asset backed debt as compared to our historical match funded other nonrecourse debt. In addition, our investment interest expense increased by approximately $2 million when comparing the year ended December 31, 2014, to the same period ended December 31, 2013 as a result the issuance of nonrecourse debt of $115 million used to fund our equity method investment in the wind projects.
Other Expenses, Net
Other expenses, net increased by $3 million to $19 million in the year ended December 31, 2014, compared to $16 million in the same period in 2013, primarily as a result of acquisition costs of $2 million related to the 2014 business combinations including the AWCC transaction and other smaller real estate acquisitions and higher general and administrative expenses and other of $2 million due to an increase in legal and professional fees related to being a public company. These increases were offset by lower compensation and benefits costs of $1 million driven by the one-time IPO related equity-based compensation expense charge in 2013 of $6 million, which was partially offset by higher equity-based compensation and staff expenses of $5 million in 2014 when compared to 2013 excluding the one-time IPO related charge.
- 78 -
Table of Contents
Non-GAAP Financial Measures
We consider the following non-GAAP financial measures useful to investors as key supplemental measures of our performance: (1) core earnings, (2) managed assets and (3) investment income from managed assets. These non-GAAP financial measures should be considered along with, but not as alternatives to, net income or loss as measures of our operating performance. These non-GAAP financial measures, as calculated by us, may not be comparable to similarly named financial measures as reported by other companies that do not define such terms exactly as we define such terms.
Core Earnings
We calculate Core Earnings as U.S. GAAP net income excluding non-cash equity compensation expense, non-cash provision for credit losses, amortization of intangibles, one-time acquisition related costs, if any and any non-cash tax charges. We also make an adjustment to account for our equity method investment in the wind projects on an effective interest method as described below. In the future, Core Earnings may also exclude one-time events pursuant to changes in U.S. GAAP and certain other non-cash charges as approved by a majority of our independent directors.
Our equity method investments in the wind projects are structured using typical wind partnership flip structures where we, along with other institutional investors, if any, receive a pre-negotiated preferred return consisting of priority distributions from the project cash flows along with tax attributes. Once this preferred return is achieved, the partnership flips and the wind energy company, which operates the project, receives the majority of the cash flows through its equity interests with the institutional investors retaining an ongoing residual interest. Given this structure, we negotiated our purchase price of our wind investments based on our assessment of the expected cash flows from each investment discounted back to net present value based on a discount rate that represented an expected yield on the investment. This is similar to how we value the expected cash flows in financing receivables. Under U.S. GAAP, we are required to account for these investments utilizing the hypothetical liquidation at book value method (HLBV), in which we recognize income or loss based on the change in the amount each partner would receive if the assets were liquidated at book value, in this case, at the end of the immediately preceding quarter after adjusting for any distributions or contributions made during such quarter. As HLBV incorporates non-cash items, such as depreciation, and because we are entitled to receive a preferred return of cash flows on our investments independent of how profits and losses are allocated, the HLBV allocation does not, in our opinion, reflect the economics of our investments. As a result, and in an attempt to treat these investments in a manner similar to our other investments and our initial valuation, in calculating our Core Earnings for the above periods, we adjusted the income we receive from these investments as if we were recognizing income or loss based on an effective interest methodology. Generally, under this methodology income is recognized over the life of the asset using a constant effective yield. The initial constant effective yield we selected is equal to the discount rates we used in making our investment decisions. On at least a quarterly basis, we will review and, if appropriate, adjust the discount rates and the income or loss we receive from these investments for purposes of calculating our Core Earnings in future periods, as necessary, to reflect changes in both actual cash flows received and our estimates of the future cash flows from the projects. Our allocation of profits and losses in our JPMorgan transactions is projected to change in 2019, which is expected to result in an increase of the amount of HLBV profits or losses allocated to us. In June 2015, JPMorgan and one of the project holding companies entered into an agreement regarding the treatment of certain tax matters that had the impact of reducing our expected future cash flows from that holding company. As a result of this agreement, JPMorgan paid us approximately $3 million, which effectively reduced our investment in that entity. In accordance with the methodology described above, we have calculated a new constant effective yield based upon the reduced investment amount and the reduction in expected future cash flows. We used this new effective yield, which is not materially different from our initial constant effective yield, beginning with the quarter ended September 30, 2015.
We have approximately $234 million of nonrecourse borrowings outstanding as of December 31, 2015, using our equity method investments as collateral. Included in our U.S. GAAP investment interest expense for
- 79 -
Table of Contents
the year ended December 31, 2015, was approximately $7 million of interest expense related to these nonrecourse loans. For the year ended December 31, 2015, we collected cash distributions from our wind investments of approximately $25 million (in addition to the $3 million payment), of which $13 million represents our Core Earnings adjustment for these investments based upon the effective yield methodology discussed above.
We believe that Core Earnings provides an additional measure of our core operating performance by eliminating the impact of certain non-cash expenses and facilitating a comparison of our financial results to those of other comparable REITs with fewer or no non-cash charges and comparison of our own operating results from period to period. Our management uses Core Earnings in this way. We believe that our investors also use Core Earnings, or a comparable supplemental performance measure, to evaluate and compare our performance to that of our peers, and as such, we believe that the disclosure of Core Earnings is useful to (and expected by) our investors.
However, Core Earnings does not represent cash generated from operating activities in accordance with U.S. GAAP and should not be considered as an alternative to net income (determined in accordance with U.S. GAAP), or an indication of our cash flow from operating activities (determined in accordance with U.S. GAAP), a measure of our liquidity, or an indication of funds available to fund our cash needs, including our ability to make cash distributions. In addition, our methodology for calculating Core Earnings may differ from the methodologies employed by other REITs to calculate the same or similar supplemental performance measures, and accordingly, our reported Core Earnings may not be comparable to the core earnings reported by other REITs.
We have calculated our Core Earnings for the years ended December 31, 2015, 2014 and 2013. The table below provides a reconciliation of our U.S. GAAP net income to Core Earnings:
| For the Years Ended December 31, | ||||||||||||||||||||||||
| 2015 | 2014 | 2013 | ||||||||||||||||||||||
| $ | Per Share | $ | Per Share | $ | Per Share | |||||||||||||||||||
| (in thousands, except per share amounts) | ||||||||||||||||||||||||
| Net income (loss) attributable to controlling shareholders |
$ | 7,958 | $ | 0.21 | $ | 9,607 | $ | 0.43 | $ | (10,459 | ) | $ | (0.68 | ) | ||||||||||
| Core Earnings Adjustments |
||||||||||||||||||||||||
| Equity method investment in Wind Projects |
13,405 | 2,376 | | |||||||||||||||||||||
| Non-cash equity-based compensation charge |
10,641 | 5,187 | 7,079 | |||||||||||||||||||||
| Business combination acquisition costs |
| 2,456 | | |||||||||||||||||||||
| Amortization of real estate intangibles |
1,179 | 276 | | |||||||||||||||||||||
| Amortization of other intangibles |
203 | 203 | 265 | |||||||||||||||||||||
| Non-cash provision (benefit) for taxes |
46 | 9 | (251 | ) | ||||||||||||||||||||
| Current year earnings attributable to minority interest |
76 | 163 | (2,175 | ) | ||||||||||||||||||||
| Non-cash provision for credit losses |
| | 11,000 | |||||||||||||||||||||
| Pre-IPO losses attributable to minority interest (2) |
| | 1,880 | |||||||||||||||||||||
|
|
|
|
|
|
|
|
|
|
|
|
|
|||||||||||||
| Core Earnings (1) |
$ | 33,508 | $ | 1.04 | $ | 20,277 | $ | 0.93 | $ | 7,339 | $ | 0.43 | ||||||||||||
|
|
|
|
|
|
|
|
|
|
|
|
|
|||||||||||||
| (1) | Core Earnings per share is based on 32,310,395, 21,870,184 and 16,886,041 shares for the years ended December 31, 2015, 2014 and 2013, respectively, which represents the weighted average number of fully-diluted shares outstanding including participating securities and the minority interest in our Operating Partnership. |
| (2) | Excludes amount allocated to Predecessors members prior to the IPO. |
- 80 -
Table of Contents
Managed Assets and Investment Income from Managed Assets
As we both consolidate assets on our balance sheet and securitize investments, certain of our financing receivables and other assets are not reflected on our balance sheet where we may have a residual interest in the performance of the investment. Thus, we also calculate both our investments and our investment revenue on a non-GAAP managed basis, which assumes that securitized financing receivables are not sold, with the effect that the income from securitized financing receivables are included in our revenue in the same manner as the income from financing receivables that we consolidated on our balance sheet. We believe that our managed asset and revenue information is useful to investors because it portrays the results of both on- and off-balance sheet financing receivables that we manage, which enables investors to understand and evaluate the credit performance associated with the portfolio of financing receivables and investments reported on our consolidated balance sheet and our retained interests in securitized financing receivables. Our non-GAAP managed assets and revenue measures may not be comparable to similarly titled measures used by other companies.
The following is a reconciliation of our U.S. GAAP Portfolio to our managed assets as of December 31, 2015, 2014, and 2013 and our U.S. GAAP income from our Portfolio (excluding our equity investments) to our investment revenue from managed assets for the years ended December 31, 2015, 2014, and 2013:
| As of December 31, | ||||||||||||
| 2015 | 2014 | 2013 | ||||||||||
| (in millions) | ||||||||||||
| Financing receivables (1) |
$ | 844 | $ | 615 | $ | 373 | ||||||
| Investments (1) |
29 | 27 | 95 | |||||||||
| Real estate |
156 | 114 | | |||||||||
| Equity method investment in affiliate |
319 | 144 | | |||||||||
| Assets held in securitization trusts |
1,840 | 1,709 | 1,618 | |||||||||
|
|
|
|
|
|
|
|||||||
| Managed Assets |
$ | 3,188 | $ | 2,609 | $ | 2,086 | ||||||
|
|
|
|
|
|
|
|||||||
| Credit losses as a percentage of assets under management |
0.0 | % | 0.0 | % | 0.5 | % | ||||||
| (1) | Includes financing receivables and investments held for sale. |
| Years Ended December 31, |
||||||||||||
| 2015 | 2014 | 2013 | ||||||||||
| (in millions) | ||||||||||||
| Interest Income, Financing receivables |
$ | 37 | $ | 23 | $ | 15 | ||||||
| Interest Income, Investments |
2 | 4 | 2 | |||||||||
| Rental Income |
9 | 3 | | |||||||||
| Income from assets held in securitization trusts |
98 | 92 | 86 | |||||||||
|
|
|
|
|
|
|
|||||||
| Investment Revenue from Managed Assets |
$ | 146 | $ | 122 | $ | 103 | ||||||
|
|
|
|
|
|
|
|||||||
Other Financial Measures
The following are certain financial measures for the years ended December 31, 2015, 2014 and 2013.
| Years Ended December 31, |
||||||||||||
| 2015 | 2014 | 2013 | ||||||||||
| Return on assets |
0.6 | % | 1.2 | % | (3.2 | )% | ||||||
| Return on equity |
2.3 | % | 4.6 | % | (16.1 | )% | ||||||
| Average equity to average total assets ratio |
28.5 | % | 26.8 | % | 20.0 | % | ||||||
- 81 -
Table of Contents
Liquidity and Capital Resources
Liquidity is a measure of our ability to meet potential short-term (within one year) and long-term cash requirements, including ongoing commitments to repay borrowings, fund and maintain our current and future assets, make distributions to our stockholders and other general business needs. We will use significant cash to make debt and equity investments, repay principal and interest on our borrowings, make distributions to our stockholders and fund our operations.
We use borrowings as part of our financing strategy to increase potential returns to our stockholders and have available to us a broad range of financing sources. In July 2013, we entered into a $350 million senior secured revolving credit facility with maximum total advances of $700 million. Since that time, we have entered into a number of amendments intended to increase the flexibility and borrowing capability under the credit facility and to extend the maturity date. The facility has been increased to $500 million with maximum total advances of $1.5 billion and the facility was extended an additional year and matures in July 2019.
In addition, we have completed approximately $610 million of nonrecourse borrowings since April 2013, including approximately $395 million in 2015. We have worked to expand our liquidity and access to the debt and bank loan markets and in 2015, entered into borrowing relationships with three new lenders and with several institutional investors through our $101 million issuance of HASI Sustainable Yield Bonds in 2015. We believe that our 2013 financing was one of the first asset-backed securitizations that provided details on GHG saved by the technologies that secured the financing. We believe that investors will increasingly be interested in debt investments that have a measurable GHG savings.
Prior to our IPO, we financed our business primarily through fixed rate nonrecourse debt where the debt was match-funded with corresponding fixed rate yielding assets and through the use of non-consolidated securitizations. In our securitization transactions, we transfer the loans or other assets we originate to securitization trusts or other bankruptcy remote special purpose funding vehicles. Large institutional investors, primarily insurance companies and commercial banks, have provided the financing needed for these assets by purchasing the notes issued by the funding vehicle.
We continue to use both of these funding sources and, as of December 31, 2015, had outstanding approximately $101 million of this match funded debt, all of which was consolidated on our balance sheet and is referred to as Other nonrecourse debt in our balance sheet. As of December 31, 2015, the outstanding principal balance of our assets financed through the use of securitizations which are not consolidated on our balance sheet was approximately $1.8 billion. For further information on the credit facility, asset backed nonrecourse notes, securitizations and our nonrecourse match funded debt, see Note 5, 7 and Note 8 of our audited financial statements included in this Form 10-K.
We plan to use other fixed and floating rate borrowings in the form of additional bank credit facilities (including term loans and revolving facilities), warehouse facilities, repurchase agreements and public and private equity and debt issuances, including match funded arrangements, as a means of financing our business. We also expect to use both on-balance sheet and non-consolidated securitizations and also believe we will be able to customize securitized tranches to meet investment preferences of different investors. We may also consider the use of separately funded special purpose entities or funds to allow us to expand the investments that we make.
The decision on how we finance specific assets or groups of assets is largely driven by capital allocations and risk and portfolio management considerations, as well as the overall interest rate environment, prevailing credit spreads and the terms of available financing and market conditions. Over time, as market conditions change, we may use other forms of leverage in addition to these financings arrangements.
- 82 -
Table of Contents
We may continue to raise funds through capital market transactions by issuing capital stock. We have raised net proceeds of approximately $470 million including $181 million in two follow on public offerings completed in 2015. See Note 11 of the audited financial statements in this Form 10-K for a summary of our public offerings of common stock.
In August 2014, we filed a registration statement with the SEC registering the possible offering and sale of up to $500 million of any combination of our common stock, preferred stock, depositary shares and warrants and rights (collectively referred to as the securities.) that has been declared effective by the SEC. We may offer the securities directly, through agents, or to or through underwriters. Sales of the securities may be made by means of ordinary brokers transactions on the NYSE or otherwise at market prices prevailing at the time of sale or at negotiated prices. The specific terms of the securities offering and the names of any underwriters involved in the sale of the securities will be set forth in the applicable prospectus supplement.
Although we are not restricted by any regulatory requirements to maintain our leverage ratio at or below any particular level, the amount of leverage we may deploy for particular assets will depend upon the availability of particular types of financing and our assessment of the credit, liquidity, price volatility and other risks of those assets, the interest rate environment and the credit quality of our financing counterparties. In March 2015, we increased our leverage target to 2.5 to 1 from less than 2.0 to 1. Our debt to equity ratio was approximately 2.1 to 1 as of December 31, 2015. We also have increased the percentage of fixed rate debt from zero at the IPO to approximately 71% as of December 31, 2015, or slightly above our targeted fixed rate debt percentage range of approximately 50% to 70%. In order to simplify these calculations, we have begun to use, effective February 2016, the total debt on our balance sheet, including our credit facility, nonrecourse securitization debt and other nonrecourse match funded debt. Historically, we excluded the other nonrecourse match funded debt, which as of December 31, 2015, was $101 million, and if such debt would have been excluded, the debt to equity ratio would have been 1.9 to 1 and the fixed rate debt percentage was 68%. We continue to calculate both of these ratios exclusive of securitizations that are not consolidated on our balance sheet (where the collateral is typically borrowings with U.S. government obligors) and for the purposes of the fixed rate debt target, we include as fixed rate debt, the present notional value hedged by interest rate swaps.
We intend to use leverage for the primary purpose of financing our portfolio and business activities and not for the purpose of speculating on changes in interest rates. While we may temporarily exceed the leverage target, if our board of directors approves a material change to our leverage target, we anticipate advising our stockholders of this change through disclosure in our periodic reports and other filings under the Exchange Act.
While we generally intend to hold our target assets that we do not securitize upon acquisition as long-term investments, certain of our investments may be sold in order to manage our interest rate risk and liquidity needs, to meet other operating objectives and to adapt to market conditions. The timing and impact of future sales of financings, if any, cannot be predicted with any certainty. Since we expect that our assets will generally be financed, we expect that a significant portion of the proceeds from sales of our assets (if any), prepayments and scheduled amortization will be used to repay balances under our financing sources.
We believe these identified sources of liquidity will be adequate for purposes of meeting our short-term and long-term liquidity needs, which include funding future investments, operating costs and distributions to our stockholders. To qualify as a REIT, we must distribute annually at least 90% of our REITs taxable income without regard to the deduction for dividends paid and excluding net capital gains. These dividend requirements limit our ability to retain earnings and thereby replenish or increase capital for growth and our operations.
Sources and Uses of Cash
We had approximately $43 million and $58 million of unrestricted cash and cash equivalents as of December 31, 2015 and 2014, respectively.
- 83 -
Table of Contents
Cash Flows Relating to Operating Activities
Net cash provided by operating activities was approximately $19 million for the year ended December 31, 2015, driven primarily by net income of $8 million, impact from the sale of financing receivables (including the change in financing receivables held-for-sale) and investments of $4 million, and adjustments for noncash items of $15 million, consisting primarily of equity-based compensation and depreciation and amortization. This was offset by changes in accounts payable and accrued expenses and other of $8 million.
Net cash provided by operating activities was approximately $5 million for the year ended December 31, 2014, driven by net income of $10 million and $8 million of non-cash items, consisting primarily of equity-based compensation and amortization of deferred financing fees. This was offset by gain on sales of financing receivables and investments of $7 million for which the proceeds from these sales are included in cash flows from investing activities. This was further offset by cash used to pay accounts payable and accrued expenses and other of $6 million.
Net cash used in operating activities was approximately $11 million for the year ended December 31, 2013, driven primarily by operating cash flows used to acquire the financing receivables held-for-sale of $16 million and the net loss of $13 million, partially offset by the non-cash provision for credit losses of $11 million related to the impairment of a mezzanine debt investment in a geothermal project and non-cash equity-based compensation expense of $7 million, which includes a one-time charge of $6 million relating to the reallocation between the owners and employees of the equity interest of the Predecessor as part of our IPO and formation transactions.
Cash Flows Relating to Investing Activities
Net cash used in investing activities was approximately $361 million for the year ended December 31, 2015. We used $324 million to purchase financing receivables and investments, $43 million to purchase real estate, and net cash of $200 million for additional wind equity investments. We set aside $12 million of restricted cash. We collected cash from principal payments on our financing receivables and investments of $79 million. In addition, we received $114 million from the sale of financing receivables and investments and cash distributions from our investment in our wind projects of $25 million.
Net cash used in investing activities was approximately $319 million for the year ended December 31, 2014. We added to our Portfolio of investments $154 million in real estate assets, including the real estate business acquisitions in 2014 and subsequent purchases of real estate, and $144 million in an equity method investment. In addition, we invested $235 million in the purchase of financing receivables and investments. These investments in our Portfolio were partially offset by sales of financing receivables and investments and principal collections of $106 million and $70 million, respectively. In addition, we released $38 million of restricted cash during the year ended December 31, 2014.
Net cash used in investing activities was approximately $229 million for the year ended December 31, 2013. Cash of $156 million and $92 million were used to acquire financing receivables and investments, respectively, and $50 million was set-aside in restricted cash to be used to pay for future funding obligations associated with the new investments. These cash outlays were offset by $69 million of principal collections on financing receivables held on our balance sheet.
Cash Flows Relating to Financing Activities
Net cash provided by financing activities was approximately $327 million for the year ended December 31, 2015. This includes credit facility and nonrecourse debt borrowings of $714 million and net proceeds of $181 million from the sale of our common stock. These cash inflows were partially offset by payments to reduce our
- 84 -
Table of Contents
borrowings under the credit facility, deferred funding obligations, and nonrecourse debts totaling $506 million, the payment of dividends and distributions to our stockholders and OP unit holders of $32 million, a change in other cash outflows of $30 million.
Net cash provided by financing activities was approximately $340 million for the year ended December 31, 2014. This includes cash of $311 million provided from borrowings under our credit facility to fund our Portfolio growth, $115 million provided from nonrecourse borrowings to fund our investment in the wind projects and $129 million of net proceeds from the sale of our common stock. These cash receipts were partially offset by payments on our deferred funding obligations of $67 million, payments on our credit facility and nonrecourse debt of $72 million and $56 million, respectively, dividends and distributions of $14 million and other cash outflows of $6 million.
Net cash provided by financing activities was approximately $264 million for the year ended December 31, 2013. Our IPO resulted in net proceeds of $160 million. Total borrowings were $260 million with borrowings from the new credit facility of $131 million and nonrecourse borrowings of $129 million, including our new private placement of asset-backed nonrecourse notes of $100 million. Payments of $65 million and $58 million were made on nonrecourse debt and on the credit facilities, respectively, and $17 million was paid on deferred funding obligations. Dividends and distributions were $7 million and $9 million was used on other cash outflows.
Contractual Obligations and Commitments
We lease office space at our headquarters in Annapolis, Maryland under an operating lease entered into in July 2011 and amended in October 2013 to add additional space. The lease provides for operating expense reimbursements and annual escalations that are amortized over the respective lease terms on a straight-line basis. Lease payments under this lease commenced in March 2012 and incremental payments related to the amendment commenced in March 2014.
The following table provides a summary of our contractual obligations as of December 31, 2015:
| Payment due by Period | ||||||||||||||||||||
| Contractual Obligations |
Total | Less than 1 year |
1 3 Years | 3 5 Years | More than 5 years |
|||||||||||||||
| (dollars in millions) | ||||||||||||||||||||
| Long-Term Debt Obligations (1) |
$ | 680 | $ | 48 | $ | 84 | $ | 268 | $ | 280 | ||||||||||
| Interest on Long-term Debt Obligations (1) |
186 | 30 | 55 | 47 | 54 | |||||||||||||||
| Credit Facility |
247 | | | 247 | | |||||||||||||||
| Interest on Credit Facility (2) |
20 | 6 | 11 | 3 | | |||||||||||||||
| Deferred Funding Obligations |
108 | 93 | 15 | | | |||||||||||||||
| Operating Lease Obligations |
3 | | 1 | 1 | 1 | |||||||||||||||
|
|
|
|
|
|
|
|
|
|
|
|||||||||||
| Total |
$ | 1,244 | $ | 177 | $ | 166 | $ | 566 | $ | 335 | ||||||||||
|
|
|
|
|
|
|
|
|
|
|
|||||||||||
| (1) | The Long-Term Debt Obligations are secured by the financing receivables that were financed with no recourse to our general assets and excludes the $16 million of debt issuance costs. Debt service, in the majority of the cases, is equal to or less than the financing receivables. Interest is calculated based on the interest rate in effect at December 31, 2015 including the effect of interest rate hedges as applicable. Interest paid on these obligations was $16 million and $10 million for the years ended December 31, 2015 and 2014, respectively. |
| (2) | Interest is calculated based on the interest rate in effect at December 31, 2015, and includes all interest expense incurred and expected to be incurred in the future based on the current principal balance through the contractual maturity of the credit facility. Interest paid on the credit facility was $8 million and $3 million for the years ended December 31, 2015 and 2014, respectively |
- 85 -
Table of Contents
Off-Balance Sheet Arrangements
As described under Critical Accounting Policies and Use of Estimates, we have relationships with non-consolidated entities or financial partnerships, such as entities often referred to as structured investment vehicles, or special purpose or variable interest entities, established to facilitate the sale of securitized assets. Other than our securitization assets of approximately $9 million as of December 31, 2015, that may be at risk in the event of defaults in our securitization trusts, we have not guaranteed any obligations of nonconsolidated entities or entered into any commitment or intent to provide additional funding to any such entities. A more detailed description of our relations with non-consolidated entities can be found in Note 2 of our audited financial statements included in this Form 10-K.
Dividends
U.S. federal income tax law generally requires that a REIT distribute annually at least 90% of its REIT taxable income, without regard to the deduction for dividends paid and excluding net capital gains, and that it pay tax at regular corporate rates to the extent that it annually distributes less than 100% of its REIT taxable income. Our current policy is to pay quarterly distributions, which on an annual basis will equal or exceed substantially all of our REIT taxable income. Any distributions we make will be at the discretion of our board of directors and will depend upon, among other things, our actual results of operations. These results and our ability to pay distributions will be affected by various factors, including the net interest and other income from our portfolio, our operating expenses and any other expenditures. In the event that our board of directors determines to make distributions in excess of the income or cash flow generated from our assets, we may make such distributions from the proceeds of future offerings of equity or debt securities or other forms of debt financing or the sale of assets. To the extent that in respect of any calendar year, cash available for distribution is less than our taxable income, we could be required to sell assets or borrow funds to make cash distributions or make a portion of the required distribution in the form of a taxable stock distribution or distribution of debt securities. We will generally not be required to make distributions with respect to activities conducted through our domestic TRS.
We anticipate that our distributions generally will be taxable as ordinary income to our stockholders, although a portion of the distributions may be designated by us as qualified dividend income or capital gain or may constitute a return of capital. In addition, a portion of such distributions may be taxable stock dividends payable in our shares. We will furnish annually to each of our stockholders a statement setting forth distributions paid during the preceding year and their characterization as ordinary income, return of capital, qualified dividend income or capital gain.
The dividends declared in 2014 and 2015 are described under Note 11 of the audited financial statements in this Form 10-K.
Book Value Considerations
As of December 31, 2015, we carried only our investments available-for-sale, interest rate swaps and retained assets in securitized receivables at fair value on our balance sheet. As a result, in reviewing our book value, there are a number of important factors and limitations to consider. Other than the approximately $29 million in investments available-for-sale, approximately $1 million liability for interest rate swaps and the $9 million in residual assets relating to our retained interests in securitized receivables that are on our balance sheet at fair value as of December 31, 2015, the carrying value of our remaining assets and liabilities are calculated as of a particular point in time, which is largely determined at the time such assets and liabilities were added to our balance sheet using a cost basis in accordance with U.S. GAAP. As such, our remaining assets and liabilities do not incorporate other factors that may have a significant impact on their value, most notably any impact of business activities, changes in estimates, or changes in general economic conditions or interest rates since the dates the assets or liabilities were initially recorded. Accordingly, our book value does not necessarily represent an estimate of our net realizable value, liquidation value or our market value as a whole.
- 86 -
Table of Contents
Inflation
We do not anticipate that inflation will have a significant effect on our results of operations. However, in the event of a significant increase in inflation, interest rates could rise and our projects and investments may be materially adversely affected.
Item 7A. Quantitative and Qualitative Disclosures About Market Risk.
We anticipate that our primary market risks will be related to commodity prices, the credit quality of our counterparties and project companies, market interest rates and the liquidity of our assets. We will seek to manage these risks while, at the same time, seeking to provide an opportunity to stockholders to realize attractive returns through ownership of our common stock.
Credit Risks
We source and identify quality opportunities within our broad areas of expertise and apply our rigorous underwriting processes to our transactions, which, we believe, will generally enable us to minimize our credit losses and keep financing costs low. While we do not anticipate facing significant credit risk in our financings related to U.S. federal government energy efficiency projects, we are subject to varying degrees of credit risk in these projects in relation to guarantees provided by ESCOs where payments under energy savings performance contracts are contingent upon achieving pre-determined levels of energy savings. We are also exposed to credit risk in projects including those projects we have under long-term lease arrangements that do not benefit from the U.S. federal government as obligor. We increasingly target such projects as part of our strategy. In the case of various renewable energy and sustainable infrastructure projects, we will also be exposed to the credit risk of the obligor of the projects power purchase agreement or other long-term contractual revenue commitments. We may encounter enhanced credit risk as we expect that over time our strategy will increasingly include mezzanine debt, real estate and equity investments. We seek to manage credit risk using thorough due diligence and underwriting processes, strong structural protections in our transaction agreements with customers and continual, active asset management and portfolio monitoring. Nevertheless, unanticipated credit losses could occur and during periods of economic downturn in the global economy, our exposure to credit risks from obligors increases, and our efforts to monitor and mitigate the associated risks may not be completely effective in reducing our credit risks.
Interest Rate and Borrowing Risks
Interest rate risk is highly sensitive to many factors, including governmental monetary and tax policies, domestic and international economic and political considerations and other factors beyond our control.
We are subject to interest rate risk in connection with new asset originations and our credit facility, and in the future, will be subject to interest rate risk for any new floating or inverse floating rate assets and credit facilities. Because short-term borrowings are generally short-term commitments of capital, lenders may respond to market conditions, making it more difficult for us to secure continued financing. If we are not able to renew our then existing facilities or arrange for new financing on terms acceptable to us, or if we default on our covenants or are otherwise unable to access funds under any of these facilities, we may have to curtail entering into new transactions and/or dispose of assets. We face particular risk in this regard given that we expect many of our borrowings will have a shorter duration than the assets they finance. Increasing interest rates may reduce the demand for our investments while declining interest rates may increase the demand. Both our current and future credit facilities may be of limited duration and are periodically refinanced at then current market rates. We expect to attempt to reduce interest rate risks and to minimize exposure to interest rate fluctuations through the use of match funded or fixed rate financing structures, when appropriate, whereby we may seek (1) to match the maturities of our debt obligations with the maturities of our assets, (2) to borrow at fixed rates for a period of time, like in our asset backed securitizations, or (3) to match the interest rates on our assets with like-kind debt (i.e., we may finance floating rate assets with floating rate debt and fixed-rate assets with fixed-rate debt), directly or through the use of interest rate swap agreements, interest rate cap agreements or other financial
- 87 -
Table of Contents
instruments, or through a combination of these strategies. We expect these instruments will allow us to minimize, but not eliminate, the risk that we have to refinance our liabilities before the maturities of our assets and to reduce the impact of changing interest rates on our earnings. In addition to the use of traditional derivative instruments, we also seek to mitigate interest rate risk by using securitizations, syndications and other techniques to construct a portfolio with a staggered maturity profile. We monitor the impact of interest rate changes on the market for new originations and often have the flexibility to increase the term of the project to offset interest rate increases.
Our nonrecourse debt is at fixed rates or we have used interest rate hedges which convert the floating rate to fixed rate as describe in Note 8 of the audited financial statements in this Form 10-K. Changes in market rates impact the fair value of the fixed rate debt but have no impact on our consolidated financial statements, other than the fair value change of our interest rate hedges which should be offset by a corresponding change in the value of the debt. If interest rates rise, and our fixed debt balance remains constant, we expect the fair value of our debt to decrease and the value of our hedge to increase. As of December 31, 2015 and 2014, the estimated fair value of our fixed rate nonrecourse debt was approximately $677 million and $335 million, respectively, which is based on having the same debt service requirements that could have been borrowed at the date presented, at prevailing current market interest rates.
Our credit facility is a variable rate loan with approximately $247 million outstanding as of December 31, 2015 and we have $13 million of variable rate exposure under our nonrecourse debt. Significant increases in interest rates would result in higher interest expense while decreases in interest rates would result in lower interest expense. As described above, we may use various financing techniques including interest rate swap agreements, interest rate cap agreements or other financial instruments, or a combination of these strategies to mitigate the variable interest nature of this facility. A 50 basis point increase in LIBOR would increase the quarterly interest expense related to the $260 million in variable rate borrowings by $0.3 million. Such hypothetical impact of interest rates on our variable rate borrowings does not consider the effect of any change in overall economic activity that could occur in a rising interest rate environment. Further, in the event of such a change in interest rates, we may take actions to further mitigate our exposure to such a change. However, due to the uncertainty of the specific actions that would be taken and their possible effects, the analysis assumes no changes in our financial structure.
We record our retained assets at fair value in our financial statements and any changes in the discount rate would impact the value of these assets. See Note 3 of the audited financial statements in this Form 10-K for more information.
Liquidity and Concentration Risk
The assets that comprise our asset portfolio are not and will not be publicly traded. A portion of these assets may be subject to legal and other restrictions on resale or will otherwise be less liquid than publicly-traded securities. The illiquidity of our assets may make it difficult for us to sell such assets if the need or desire arises, including in response to changes in economic and other conditions. Our projects typically have one obligor and thus we are subject to concentration risk and could incur significant losses if any of these projects perform poorly or if we are required to write down the value of any these projects. See also Credit Risks above.
Commodity Price Risk
When we provide debt or equity for a project that acts as a substitute for an underlying commodity we are exposed to volatility in prices for that commodity. For example, the performance of renewable energy projects that produce electricity can be impacted by volatility in the market prices of various forms of energy, including electricity, coal and natural gas. This is especially true for utility scale projects that sell power on a wholesale basis like many of our wind projects as opposed to distributed renewable projects or energy efficiency projects which compete against the retail or delivered costs of electricity which includes the cost of transmitting and distributing the electricity to the end user.
- 88 -
Table of Contents
Although we generally focus on renewable energy projects that have the majority of their operating cash flow supported by long-term PPAs, ranging from 10 to 30 years, to the extent that the projects have shorter term contracts (which may have the potential of producing higher current returns) or sell their power in the open market on a merchant basis, the cash flows of such projects, and thus the repayment of, or the returns available for, our assets, may be subject to risk if energy prices change. We also mitigate our exposure through structural protections. These structural protections, which are typically in the form of a preferred return, are design to allow recovery of our capital and an acceptable return over time. When structuring and underwriting these transactions, we evaluate these transactions using a variety of scenarios, including natural gas prices remaining low for an extended period of time. In the case of utility scale solar projects, we focus on owning the land under the project where our rent is paid out of project operational costs before the debt or equity in the project receives any payments.
We believe the current low prices in natural gas will increase demand for some types of our projects, such as combined heat and power, but may reduce the demand for other projects such as renewable energy that may be a substitute for natural gas. We seek to structure our energy efficiency financings so that we typically avoid exposure to commodity price risk. However, volatility in energy prices may cause building owners and other parties to be reluctant to commit to projects for which repayment is based upon a fixed monetary value for energy savings that would not decline if the price of energy declines.
Risk Management
Our ongoing active asset management and portfolio monitoring processes provide investment oversight and valuable insight into our origination, underwriting and structuring processes. These processes create value through active monitoring of the state of our markets, enforcement of existing contracts and real-time receivables management. Subject to maintaining our qualification as a REIT, and as described above, we engage in a variety of interest rate management techniques that seek to mitigate the economic effect of interest rate changes on the values of, and returns on, some of our assets. While there have been only two incidents of credit loss, amounting to approximately $18 million (net of recoveries) on the more than $5 billion of transactions we originated since 2000, which represents an aggregate loss of approximately 0.4% on cumulative transactions originated over this time period, there can be no assurance that we will continue to be as successful, particularly as we invest in more credit sensitive assets or more equity positions and engage in increasing numbers of transactions with obligors other than U.S. federal government agencies.
We seek to manage credit risk using thorough due diligence and underwriting processes, strong structural protections in our loan agreements with customers and continual, active asset management and portfolio monitoring.
- 89 -
Table of Contents
Item 8. Financial Statements and Supplementary Data.
| Hannon Armstrong Sustainable Infrastructure Capital, Inc., Consolidated Financial Statements, For the Years Ended December 31, 2015, 2014 and 2013 |
||||
| 91 | ||||
| 92 | ||||
| 93 | ||||
| 94 | ||||
| 95 | ||||
| 96 | ||||
| 97 |
- 90 -
Table of Contents
Item 8. Financial Statements and Supplementary Data
REPORT OF INDEPENDENT REGISTERED PUBLIC ACCOUNTING FIRM
Board of Directors and Stockholders
Hannon Armstrong Sustainable Infrastructure Capital, Inc.
We have audited the accompanying consolidated balance sheets of Hannon Armstrong Sustainable Infrastructure Capital, Inc. (the Company) as of December 31, 2015, and 2014, and the related consolidated statements of operations, comprehensive income (loss), stockholders equity and cash flows for each of the three years in the period ended December 31, 2015. These financial statements are the responsibility of the Companys management. Our responsibility is to express an opinion on these financial statements based on our audits.
We conducted our audits in accordance with standards of the Public Company Accounting Oversight Board (United States). Those standards require that we plan and perform the audit to obtain reasonable assurance about whether the financial statements are free of material misstatement. We were not engaged to perform an audit of the Companys internal control over financial reporting. Our audits included consideration of internal control over financial reporting as a basis for designing audit procedures that are appropriate in the circumstances, but not for the purpose of expressing an opinion on the effectiveness of the Companys internal control over financial reporting. Accordingly, we express no such opinion. An audit also includes examining, on a test basis, evidence supporting the amounts and disclosures in the financial statements, assessing the accounting principles used and significant estimates made by management and evaluating the overall financial statement presentation. We believe that our audits provide a reasonable basis for our opinion.
In our opinion, the financial statements referred to above present fairly, in all material respects, the consolidated financial position of Hannon Armstrong Sustainable Infrastructure Capital, Inc. at December 31, 2015, and 2014, and the consolidated results of its operations and its cash flows for each of the three years in the period ended December 31, 2015, in conformity with U.S. generally accepted accounting principles.
/s/ Ernst & Young LLP
McLean, Virginia
March 1, 2016
- 91 -
Table of Contents
HANNON ARMSTRONG SUSTAINABLE INFRASTRUCTURE CAPITAL, INC.
CONSOLIDATED BALANCE SHEETS
(DOLLARS IN THOUSANDS, EXCEPT PER SHARE DATA)
| December 31, 2015 |
December 31, 2014 |
|||||||
| Assets |
||||||||
| Financing receivables |
$ | 783,967 | $ | 552,706 | ||||
| Financing receivables held-for-sale |
60,376 | 62,275 | ||||||
| Investments available-for-sale |
29,017 | 27,273 | ||||||
| Real estate |
128,769 | 90,907 | ||||||
| Real estate related intangible assets |
26,930 | 23,058 | ||||||
| Equity method investments in affiliates |
318,769 | 143,903 | ||||||
| Cash and cash equivalents |
42,645 | 58,199 | ||||||
| Other assets |
79,148 | 50,361 | ||||||
|
|
|
|
|
|||||
| Total Assets |
$ | 1,469,621 | $ | 1,008,682 | ||||
|
|
|
|
|
|||||
| Liabilities and Stockholders Equity |
||||||||
| Liabilities: |
||||||||
| Accounts payable, accrued expenses and other |
$ | 17,875 | $ | 11,408 | ||||
| Deferred funding obligations |
108,499 | 88,288 | ||||||
| Credit facility |
247,350 | 315,748 | ||||||
| Asset-backed nonrecourse debt (secured by assets of $718 million and $248 million, respectively) |
563,189 | 206,671 | ||||||
| Other nonrecourse debt (secured by financing receivables of $97 million and $108 million, respectively) |
100,602 | 112,525 | ||||||
|
|
|
|
|
|||||
| Total Liabilities |
1,037,515 | 734,640 | ||||||
|
|
|
|
|
|||||
| Stockholders Equity: |
||||||||
| Preferred stock, par value $0.01 per share, 50,000,000 shares authorized, no shares issued and outstanding |
| | ||||||
| Common stock, par value $0.01 per share, 450,000,000 shares authorized, 37,010,603 and 26,377,111 shares issued and outstanding, respectively |
370 | 264 | ||||||
| Additional paid in capital |
482,431 | 293,635 | ||||||
| Retained deficit |
(52,701 | ) | (25,006 | ) | ||||
| Accumulated other comprehensive (loss) income |
(1,905 | ) | 406 | |||||
| Non-controlling interest |
3,911 | 4,743 | ||||||
|
|
|
|
|
|||||
| Total Stockholders Equity |
432,106 | 274,042 | ||||||
|
|
|
|
|
|||||
| Total Liabilities and Stockholders Equity |
$ | 1,469,621 | $ | 1,008,682 | ||||
|
|
|
|
|
|||||
See accompanying notes.
- 92 -
Table of Contents
HANNON ARMSTRONG SUSTAINABLE INFRASTRUCTURE CAPITAL, INC.
CONSOLIDATED STATEMENTS OF OPERATIONS
(DOLLARS IN THOUSANDS, EXCEPT PER SHARE DATA)
| Years Ended December 31, | ||||||||||||
| 2015 | 2014 | 2013 | ||||||||||
| Revenue: |
||||||||||||
| Interest income, financing receivables |
$ | 37,404 | $ | 23,178 | $ | 15,468 | ||||||
| Interest income, investments |
1,493 | 3,772 | 1,897 | |||||||||
| Rental income |
9,107 | 3,175 | | |||||||||
| Gain on sale of receivables and investments |
9,224 | 13,250 | 5,597 | |||||||||
| Fee income |
1,451 | 1,900 | 1,483 | |||||||||
|
|
|
|
|
|
|
|||||||
| Total Revenue |
58,679 | 45,275 | 24,445 | |||||||||
| Investment interest expense |
(26,385 | ) | (16,655 | ) | (9,815 | ) | ||||||
| Provision for credit losses |
| | (11,000 | ) | ||||||||
|
|
|
|
|
|
|
|||||||
| Total Revenue, net of investment interest expense and provision |
32,294 | 28,620 | 3,630 | |||||||||
|
|
|
|
|
|
|
|||||||
| Compensation and benefits |
(16,788 | ) | (10,518 | ) | (12,312 | ) | ||||||
| General and administrative |
(6,462 | ) | (5,550 | ) | (3,844 | ) | ||||||
| Acquisition costs |
| (2,456 | ) | | ||||||||
| Other, net |
(794 | ) | (300 | ) | (359 | ) | ||||||
| (Loss) from equity method investments in affiliates |
(98 | ) | | | ||||||||
|
|
|
|
|
|
|
|||||||
| Other Expenses, net |
(24,142 | ) | (18,824 | ) | (16,515 | ) | ||||||
|
|
|
|
|
|
|
|||||||
| Net income (loss) before income taxes |
8,152 | 9,796 | (12,885 | ) | ||||||||
| Income tax (expense) benefit |
(118 | ) | (26 | ) | 251 | |||||||
|
|
|
|
|
|
|
|||||||
| Net Income (Loss) |
$ | 8,034 | $ | 9,770 | $ | (12,634 | ) | |||||
|
|
|
|
|
|
|
|||||||
| Net income (loss) attributable to non-controlling interest holders |
76 | 163 | (2,175 | ) | ||||||||
|
|
|
|
|
|
|
|||||||
| Net Income (Loss) attributable to Controlling Shareholders |
$ | 7,958 | $ | 9,607 | $ | (10,459 | ) | |||||
|
|
|
|
|
|
|
|||||||
| Basic earnings per common share |
$ | 0.21 | $ | 0.43 | $ | (0.68 | ) | |||||
|
|
|
|
|
|
|
|||||||
| Diluted earnings per common share |
$ | 0.21 | $ | 0.43 | $ | (0.68 | ) | |||||
|
|
|
|
|
|
|
|||||||
| Weighted average common shares outstandingbasic |
30,761,151 | 20,656,826 | 15,716,250 | |||||||||
| Weighted average common shares outstandingdiluted |
30,761,151 | 20,656,826 | 15,716,250 | |||||||||
See accompanying notes.
- 93 -
Table of Contents
HANNON ARMSTRONG SUSTAINABLE INFRASTRUCTURE CAPITAL, INC.
CONSOLIDATED STATEMENTS OF COMPREHENSIVE INCOME (LOSS)
(DOLLARS IN THOUSANDS)
| Years Ended December 31, | ||||||||||||
| 2015 | 2014 | 2013 | ||||||||||
| Net Income (Loss) |
$ | 8,034 | $ | 9,770 | $ | (12,634 | ) | |||||
| Unrealized gain/(loss) on available-for-sale securities, net of tax provision/(benefit) of $(0.2) million and $0.2 million in 2015 and 2014 respectively |
(1,712 | ) | 300 | (159 | ) | |||||||
| Unrealized loss on derivative assets, net of tax provision of $0.0 million in 2015 |
(621 | ) | | | ||||||||
|
|
|
|
|
|
|
|||||||
| Comprehensive income (loss) |
$ | 5,701 | $ | 10,070 | $ | (12,793 | ) | |||||
| Less: Comprehensive income (loss) attributable to non-controlling interests holders |
54 | 167 | (2,350 | ) | ||||||||
|
|
|
|
|
|
|
|||||||
| Comprehensive income (loss) attributable to Controlling Shareholders |
$ | 5,647 | $ | 9,903 | $ | (10,443 | ) | |||||
|
|
|
|
|
|
|
|||||||
See accompanying notes.
- 94 -
Table of Contents
HANNON ARMSTRONG SUSTAINABLE INFRASTRUCTURE CAPITAL, INC.
CONSOLIDATED STATEMENTS OF STOCKHOLDERS EQUITY
(AMOUNTS IN THOUSANDS)
| Common Stock |
Class A Common Units |
Additional Paid-in Capital |
Retained Earnings |
Accumulated Other Comprehensive Income (Loss) |
Non-controlling Interest |
Total | ||||||||||||||||||||||||||
| Shares | Amount | |||||||||||||||||||||||||||||||
| Balance at December 31, 2012 |
| $ | | 69 | $ | | $ | 5,510 | 272 | $ | | $ | 5,851 | |||||||||||||||||||
| Net loss |
(10,459 | ) | | (2,175 | ) | (12,634 | ) | |||||||||||||||||||||||||
| Unrealized gain (loss) on residual assets |
16 | (175 | ) | (159 | ) | |||||||||||||||||||||||||||
| Issue shares of common stock |
15,795 | 158 | (69 | ) | 157,892 | | | | 157,981 | |||||||||||||||||||||||
| Equity-based compensation |
| 6,885 | | 194 | 7,079 | |||||||||||||||||||||||||||
| Establishment of non-controlling interest |
(4,300 | ) | (1,981 | ) | (178 | ) | 6,459 | | ||||||||||||||||||||||||
| Issuance (repurchase) of vested equity-based compensation shares |
98 | 1 | (357 | ) | (10 | ) | (366 | ) | ||||||||||||||||||||||||
| Dividends and distributions |
(6,934 | ) | (194 | ) | (7,128 | ) | ||||||||||||||||||||||||||
|
|
|
|
|
|
|
|
|
|
|
|
|
|
|
|
|
|||||||||||||||||
| Balance at December 31, 2013 |
15,893 | $ | 159 | | $ | 160,120 | $ | (13,864 | ) | $ | 110 | $ | 4,099 | $ | 150,624 | |||||||||||||||||
| Net income |
9,607 | 163 | 9,770 | |||||||||||||||||||||||||||||
| Unrealized gain on securities |
296 | 4 | 300 | |||||||||||||||||||||||||||||
| Issue shares of common stock |
10,350 | 104 | 129,247 | | 129,351 | |||||||||||||||||||||||||||
| Equity-based compensation |
5,106 | | 81 | 5,187 | ||||||||||||||||||||||||||||
| Issuance (repurchase) of vested equity-based compensation shares |
134 | 1 | (206 | ) | (205 | ) | ||||||||||||||||||||||||||
| Redemption of OP units |
(618 | ) | (1,164 | ) | (1,782 | ) | ||||||||||||||||||||||||||
| Redemption value change for non-controlling interest redeemable for cash |
(1,833 | ) | 1,833 | | ||||||||||||||||||||||||||||
| Tax basis difference on contributed asset |
1,819 | 39 | 1,858 | |||||||||||||||||||||||||||||
| Dividends and distributions |
(20,749 | ) | (312 | ) | (21,061 | ) | ||||||||||||||||||||||||||
|
|
|
|
|
|
|
|
|
|
|
|
|
|
|
|
|
|||||||||||||||||
| Balance at December 31, 2014 |
26,377 | $ | 264 | $ | | $ | 293,635 | $ | (25,006 | ) | $ | 406 | $ | 4,743 | $ | 274,042 | ||||||||||||||||
| Net income |
7,958 | 76 | 8,034 | |||||||||||||||||||||||||||||
| Unrealized loss on securities |
(1,696 | ) | (16 | ) | (1,712 | ) | ||||||||||||||||||||||||||
| Unrealized loss on derivatives |
(615 | ) | (6 | ) | (621 | ) | ||||||||||||||||||||||||||
| Issue shares of common stock |
10,350 | 104 | 181,259 | 181,363 | ||||||||||||||||||||||||||||
| Equity-based compensation |
8,680 | 83 | 8,763 | |||||||||||||||||||||||||||||
| Issuance (repurchase) of vested equity-based compensation shares |
238 | 2 | (929 | ) | (927 | ) | ||||||||||||||||||||||||||
| Redemption of OP units |
46 | (214 | ) | (662 | ) | (876 | ) | |||||||||||||||||||||||||
| Dividends and distributions |
(35,653 | ) | (307 | ) | (35,960 | ) | ||||||||||||||||||||||||||
|
|
|
|
|
|
|
|
|
|
|
|
|
|
|
|
|
|||||||||||||||||
| Balance at December 31, 2015 |
37,011 | $ | 370 | $ | | $ | 482,431 | $ | (52,701 | ) | $ | (1,905 | ) | $ | 3,911 | $ | 432,106 | |||||||||||||||
|
|
|
|
|
|
|
|
|
|
|
|
|
|
|
|
|
|||||||||||||||||
See accompanying notes.
- 95 -
Table of Contents
HANNON ARMSTRONG SUSTAINABLE INFRASTRUCTURE CAPITAL, INC.
CONSOLIDATED STATEMENTS OF CASH FLOWS
(DOLLARS IN THOUSANDS)
| Years Ended December 31, | ||||||||||||
| 2015 | 2014 | 2013 | ||||||||||
| Cash flows from operating activities |
||||||||||||
| Net income (loss) |
$ | 8,034 | $ | 9,770 | $ | (12,634 | ) | |||||
| Adjustments to reconcile net income (loss) to net cash provided by (used in) operating activities: |
||||||||||||
| Depreciation and amortization |
3,950 | 2,631 | 1,099 | |||||||||
| Equity-based compensation |
10,641 | 5,187 | 7,079 | |||||||||
| Loss from equity method investments in affiliates |
98 | | | |||||||||
| Provision for credit losses |
| | 11,000 | |||||||||
| Gain on sale of financing receivables and investments |
(6,993 | ) | (6,796 | ) | (390 | ) | ||||||
| Changes in financing receivables held-for-sale |
11,002 | 25 | (16,444 | ) | ||||||||
| Changes in accounts payable and accrued expenses |
(1,029 | ) | (3,201 | ) | 498 | |||||||
| Other |
(7,184 | ) | (2,493 | ) | (960 | ) | ||||||
|
|
|
|
|
|
|
|||||||
| Net cash provided by (used in) operating activities |
18,519 | 5,123 | (10,752 | ) | ||||||||
|
|
|
|
|
|
|
|||||||
| Cash flows from investing activities |
||||||||||||
| Purchases of financing receivables |
(289,906 | ) | (227,075 | ) | (155,992 | ) | ||||||
| Principal collections from financing receivables |
70,093 | 67,815 | 68,537 | |||||||||
| Proceeds from sales of financing receivables |
92,456 | 30,433 | | |||||||||
| Purchases of investments |
(33,648 | ) | (7,753 | ) | (92,522 | ) | ||||||
| Principal collections from investments |
8,919 | 1,784 | 558 | |||||||||
| Proceeds from sales of investments |
21,995 | 75,179 | | |||||||||
| Acquisition of businesses, net of cash |
| (125,925 | ) | | ||||||||
| Purchases of real estate |
(42,913 | ) | (27,624 | ) | | |||||||
| Investments in equity method affiliate, net |
(200,271 | ) | (144,770 | ) | | |||||||
| Distributions received from equity method affiliates |
25,307 | 867 | | |||||||||
| Change in restricted cash |
(12,035 | ) | 37,922 | (49,810 | ) | |||||||
| Other |
(1,078 | ) | (134 | ) | (65 | ) | ||||||
|
|
|
|
|
|
|
|||||||
| Net cash used in investing activities |
(361,081 | ) | (319,281 | ) | (229,294 | ) | ||||||
|
|
|
|
|
|
|
|||||||
| Cash flows from financing activities |
||||||||||||
| Proceeds from credit facility |
308,086 | 310,501 | 131,000 | |||||||||
| Principal payments on credit facility |
(376,455 | ) | (72,100 | ) | (57,974 | ) | ||||||
| Proceeds from nonrecourse debt |
405,765 | 115,316 | 129,122 | |||||||||
| Principal payments on nonrecourse debt |
(46,602 | ) | (55,570 | ) | (65,231 | ) | ||||||
| Payments on deferred funding obligations |
(82,838 | ) | (67,354 | ) | (16,874 | ) | ||||||
| Net proceeds of common stock issuances |
180,486 | 129,351 | 160,031 | |||||||||
| Payment of dividends and distributions |
(31,591 | ) | (13,864 | ) | (7,128 | ) | ||||||
| Other |
(29,843 | ) | (5,769 | ) | (9,078 | ) | ||||||
|
|
|
|
|
|
|
|||||||
| Net cash provided by financing activities |
327,008 | 340,511 | 263,868 | |||||||||
|
|
|
|
|
|
|
|||||||
| (Decrease) increase in cash and cash equivalents |
(15,554 | ) | 26,353 | 23,822 | ||||||||
| Cash and cash equivalents at beginning of period |
58,199 | 31,846 | 8,024 | |||||||||
|
|
|
|
|
|
|
|||||||
| Cash and cash equivalents at end of period |
$ | 42,645 | $ | 58,199 | $ | 31,846 | ||||||
|
|
|
|
|
|
|
|||||||
| Interest paid |
$ | 24,111 | $ | 13,213 | $ | 8,864 | ||||||
|
|
|
|
|
|
|
|||||||
See accompanying notes.
- 96 -
Table of Contents
HANNON ARMSTRONG SUSTAINABLE INFRASTRUCTURE CAPITAL, INC.
NOTES TO CONSOLIDATED FINANCIAL STATEMENTS
DECEMBER 31, 2015
1. The Company
Hannon Armstrong Sustainable Infrastructure Capital, Inc. (the Company) provides debt and equity to the energy efficiency and renewable energy markets. The Company and its subsidiaries are hereafter referred to as we, us, or our. We refer to the financings that we hold on our balance sheet as our Portfolio. Our Portfolio may include:
| | Financing Receivables, such as project loans, receivables and direct financing leases, |
| | Investments, such as debt and equity securities, |
| | Real Estate, such as land or other physical assets and related intangible assets used in renewable energy projects, and |
| | Equity Investments in unconsolidated affiliates, such as projects where we hold a non-consolidated equity interest in a project |
We finance our business through cash on hand, borrowings under our credit facility and debt transactions, and various asset-backed securitization transactions and equity issuances. We also generate fee income through asset-backed securitizations, by providing broker/dealer services and by servicing assets owned by third parties. Some of our subsidiaries are special purpose entities that are formed for specific operations associated with financing sustainable infrastructure receivables for specific long term contracts.
We have raised net proceeds of approximately $470 million including $181 million in two follow on public offerings completed in 2015. Concurrently with our April 2013 initial public offering (IPO), we completed a series of transactions, which are referred to as the formation transactions that resulted in Hannon Armstrong Capital, LLC (the Predecessor), and the entity that operated the historical business prior to the consummation of the IPO, becoming our subsidiary. Our common stock is listed on the New York Stock Exchange (NYSE) under the symbol HASI. See Note 11 for a summary of our public offerings of common stock.
We elected and qualified as a REIT for U.S. federal income tax purposes commencing with our taxable year ended December 31, 2013. We generally will not be subject to U.S. federal income taxes on our taxable income to the extent that we annually distribute all of our taxable income to stockholders and maintain our qualification as a REIT. We operate our business through, and serve as the sole general partner of, our operating partnership subsidiary, Hannon Armstrong Sustainable Infrastructure, L.P, (the Operating Partnership), which was formed to acquire and directly or indirectly own our assets. We also intend to operate our business in a manner that will continue to permit us to maintain our exception from registration as an investment company under the Investment Company Act of 1940, as amended.
To the extent any of the financial data included in this report is as of or from a period prior to April 23, 2013, such financial data is that of the Predecessor. The financial data for the Predecessor for such periods do not reflect the material changes to our business as a result of the capital raised in the IPO, including the broadened scope of projects targeted for financing, our enhanced financial structuring flexibility and our ability to retain a larger share of the economics from our origination activities. Accordingly, the financial data for the Predecessor is not necessarily indicative of our results of operations, cash flows or financial position following the completion of our IPO and formation transactions.
Real Estate Acquisitions
In May 2014, we acquired all of the outstanding member interests in American Wind Capital Company, LLC (AWCC) from Northwharf Nominees Limited, DBD AWCC LLC, NGP Energy Technology Partners II, L.P. and C.C. Hinckley Company, LLC in exchange for approximately $107 million (the Purchase Price), which we funded with our cash on hand and availability under our credit facilities.
- 97 -
Table of Contents
The unaudited pro forma summary below presents the consolidated results of operations as if the acquisition was completed on January 1, 2013. The pro forma information is not necessarily indicative of what our actual results of operations would have been for the period, nor does it purport to represent our estimate of future results of operations.
| For the year ended December 31, |
||||||||
| 2014 | 2013 | |||||||
| (dollars in millions, unaudited) | ||||||||
| Pro forma net investment revenue |
$ | 32 | $ | 21 | ||||
| Pro forma net income (loss) |
$ | 12 | $ | (12 | ) | |||
Since the AWCC acquisition that was accounted for as a business combination, we have completed several smaller transactions that were also accounted for as business combinations for additional consideration of approximately $19 million, which we funded with our cash on hand and availability under our existing credit facilities.
We incurred approximately $2.5 million of acquisition related costs in connection with these transactions, which we have previously expensed as acquisition costs in our 2014 consolidated statement of operations. We recorded the acquired assets (including real estate related intangibles) at fair value. We did not assume any indebtedness in connection with these transactions. We used a qualified appraiser to assist us with the determination of the fair value estimates for the majority of these assets.
The purchase price allocation for these business combinations, which reflects our estimates of the fair value of the assets acquired, is as follows (dollars in millions, unaudited):
| Financing receivables |
$ | 37 | ||
| Real estate |
67 | |||
| Real estate related intangibles |
20 | |||
| Goodwill |
2 | |||
|
|
|
|||
| Purchase Price |
$ | 126 | ||
|
|
|
As a result of these acquisitions, we recorded rental income of $3.2 million and interest income of $1.5 million for the year ended December 31, 2014 in our consolidated statement of operations.
Investments in Equity Method Affiliates
We have made several minority interest investments in wind projects operated by various wind energy companies through limited liability entities with an affiliate of JPMorgan Chase & Co (JPMorgan), Bluestem Creston Ridge, LLC (Bluestem) and an affiliate of Invenergy LLC (Invenergy). Through these arrangements, we indirectly own minority interests in six limited liability holding companies that own twelve operating wind projects. The following table sets forth certain information related to our equity method investments.
| Date |
Transaction |
Investment | Partner |
|||||
| (dollars in millions | ) | |||||||
| October 2014 |
Strong Upwind Holdings I, LLC | $141 | JPMorgan | |||||
| April 2015 |
Strong Upwind Holdings II, LLC | $36 | JPMorgan | |||||
| August 2015 |
Creston Ridge Management, LLC | $13 | Bluestem | |||||
| December 2015 |
Strong Upwind Holdings III, LLC | $84 | JPMorgan | |||||
| December 2015 |
Buckeye Wind Energy Class B Holdings LLC | $71 | Invenergy | |||||
- 98 -
Table of Contents
In June 2015, JPMorgan and one of the holding companies entered into an agreement regarding the treatment of certain tax matters that had the impact of reducing our expected future cash flows from that holding company. To offset this reduction in our future cash flows, in June 2015, JPMorgan paid us approximately $3 million, which effectively reduced our original investment from $144 million to $141 million in Strong Upwind Holdings I, LLC.
See Note 2 for our accounting treatment of these investments and Note 13 for the financial position and results of operations of the holding companies.
2. Summary of Significant Accounting Policies
Basis of Presentation
The preparation of financial statements in accordance with U.S. generally accepted accounting principles (U.S. GAAP) requires management to make estimates and assumptions that affect the reported amounts of assets and liabilities and the reported amounts of revenues and expenses during the reporting period. Actual results could differ from these estimates and such differences could be material. Certain amounts in the prior year have been reclassified to conform to the current year presentation, including the format of the revenue section of the income statement to include a calculation of Total Revenue. We also implemented ASU No. 2015-03, InterestImputation of Interest, which simplifies the presentation of debt issuance costs. See Recently Issued Accounting Pronouncements below and Note 8 for further information.
The consolidated financial statements include the accounts of the Company and its controlled subsidiaries, including the Operating Partnership. All significant intercompany transactions and balances have been eliminated in consolidation.
Following the guidance for non-controlling interests in Financial Accounting Standards Board (FASB) Accounting Standards Codification (ASC) 810, Consolidation, references in this report to our earnings per share and our net income and shareholders equity attributable to common shareholders do not include amounts attributable to non-controlling interests.
Financing Receivables
Financing receivables include financing energy efficiency and renewable energy project loans, receivables and direct financing leases.
Unless otherwise noted, we generally have the ability and intent to hold our financing receivables for the foreseeable future and thus they are classified as held for investment. Our ability and intent to hold certain financing receivables may change from time to time depending on a number of factors, including economic, liquidity and capital conditions. The carrying value of financing receivables held for investment represents the present value of the note, lease or other payments, net of any unearned fee income, which is recognized as income over the term of the note or lease using the effective interest method. Financing receivables that are held for investment are carried, unless deemed impaired, at cost, net of any unamortized acquisition premiums or discounts and include origination and acquisition costs, as applicable. Financing receivables that we intend to sell in the short-term are classified as held-for-sale and are carried at the lower of amortized cost or fair value on our balance sheet. The net purchases and proceeds from these sales of our held-for-sale financing receivables are recorded as an operating activity in our statement of cash flows based on our intent at the time of purchase. We may secure nonrecourse debt with the proceeds from our financing receivables.
We evaluate our financing receivables for potential delinquency or impairment on at least a quarterly basis and more frequently when economic or other conditions warrant such an evaluation. When a financing receivable becomes 90 days or more past due, and if we otherwise do not expect the debtor to be able to service all of its debt or other obligations, we will generally consider the financing receivable delinquent or impaired and place the financing receivable on non-accrual status and cease recognizing income from that financing receivable until
- 99 -
Table of Contents
the borrower has demonstrated the ability and intent to pay contractual amounts due. If a financing receivables status significantly improves regarding the debtors ability to service the debt or other obligations, we will remove it from non-accrual status.
A financing receivable is also considered impaired as of the date when, based on current information and events, it is determined that it is probable that we will be unable to collect all amounts due in accordance with the original contracted terms. Many of our financing receivables are secured by energy efficiency and renewable energy infrastructure projects. Accordingly, we regularly evaluate the extent and impact of any credit deterioration associated with the performance and value of the underlying project, as well as the financial and operating capability of the borrower, its sponsors or the obligor as well as any guarantors. We consider a number of qualitative and quantitative factors in our assessment, including, as appropriate, a projects operating results, loan-to-value ratios and any cash reserves, the ability of expected cash from operations to cover the cash flow requirements currently and into the future, key terms of the transaction, the ability of the borrower to refinance the transaction, other credit support from the sponsor or guarantor and the projects collateral value. In addition, we consider the overall economic environment, the sustainable infrastructure sector, the effect of local, industry, and broader economic factors, the impact of any variation in weather and the historical and anticipated trends in interest rates, defaults and loss severities for similar transactions.
If a financing receivable is considered to be impaired, we record an allowance to reduce the carrying value of the financing receivable to the present value of expected future cash flows discounted at the financing receivables contractual effective rate or the amount realizable from other contractual terms such as the currently estimated fair market value of the collateral less estimated selling costs, if repayment is expected solely from the collateral. We charge off financing receivables against the allowance when we determine the unpaid principal balance is uncollectible, net of recovered amounts.
Investments
Investments include debt securities that meet the criteria of ASC 320, InvestmentsDebt and Equity Securities. As a result of the sale of certain debt securities previously designated as held-to-maturity in 2014, we have designated our debt securities as available-for-sale and will carry these securities at fair value on our balance sheet from that date. Unrealized gains and losses, to the extent not considered other than temporary impairment (OTTI), on available-for-sale debt securities are recorded as a component of accumulated other comprehensive income (OCI) in equity on our balance sheet.
We evaluate our investments for OTTI on at least a quarterly basis, and more frequently when economic or market conditions warrant such an evaluation. Our OTTI assessment is a subjective process requiring the use of judgments and assumptions. Accordingly, we regularly evaluate the extent and impact of any credit deterioration associated with the financial and operating performance and value of the underlying project. We consider a number of qualitative and quantitative factors in our assessment. We first consider the current fair value of the security and the duration of any unrealized loss. Other factors considered include changes in the credit rating, performance of the underlying project, key terms of the transaction, the value of any collateral and any support provided by the sponsor or guarantor.
To the extent that we have identified an OTTI for a security and intend to hold the investment to maturity and we do not expect that we will be required to sell the security prior to recovery of the amortized cost basis, we recognize only the credit component of OTTI in earnings. We determine the credit component using the difference between the securities amortized cost basis and the present value of its expected future cash flows, discounted using the effective interest method or its estimated collateral value. Any remaining unrealized loss due to factors other than credit, or the non-credit component, is recorded in accumulated OCI.
To the extent we hold investments with an OTTI and if we have made the decision to sell the security or it is more likely than not that we will be required to sell the security prior to recovery of its amortized cost basis, we recognize the entire portion of the impairment in earnings.
- 100 -
Table of Contents
Premiums or discounts on investment securities are amortized or accreted into investment interest income using the effective interest method.
Real Estate
Real estate reflects land or other real estate held on our balance sheet. Real estate intangibles reflect the value of associated lease intangibles, net of any amortization. In accordance with ASC 805, Business Combinations, the fair value of the real estate acquired in a business combination with in-place leases is allocated to (i) the acquired tangible assets, consisting of land or other real property such as buildings, and (ii) the identified intangible assets and liabilities, consisting of the value of above-market and below-market leases and the value of other acquired intangible assets, based in each case on their fair values.
The fair value of the tangible assets of an acquired leased property is determined by valuing the property as if it were vacant, and the as-if-vacant value is then allocated to land, building and tenant improvements, if any, based on the determination of the fair values of these assets. The as-if-vacant fair value of a property is determined by management based on an appraisal of the property by a qualified appraiser.
In allocating the fair value of the identified intangible assets and liabilities of an acquired property, above-market and below-market in-place lease values are recorded as intangible assets based on the present value (using an interest rate which reflects the risks associated with the leases acquired) of the difference between (i) the contractual amounts to be paid pursuant to the in-place leases, and (ii) managements estimate of fair market lease rates for the corresponding in-place leases, measured over a period equal to the remaining term of the lease, including renewal periods likely of being exercised by the lessee. The capitalized above-market lease values are amortized as a reduction of rental income and the capitalized below-market lease values are amortized as an increase to rental income. We also record, as appropriate, an intangible asset for in-place leases. The value of the leases in place at the time of the transaction is equal to the potential revenue (rent and expenses) lost if the leases were not in place (during downtime) and that would be incurred to obtain the lease. The amortization is calculated over the initial term unless management believes that it is likely that the tenant would exercise the renewal option, whereby we would amortize the value attributable to the renewal over the renewal period. If a lease were to be terminated, all unamortized amounts relating to that lease would be written off.
We record the purchases of real estate, other than in a business combination (i.e. real estate with no in-places leases), as asset acquisitions that are recorded at cost, including acquisition and closing costs.
Our real estate is generally leased to tenants on a net lease basis, whereby the tenant is responsible for all operating expenses relating to the property, generally including property taxes, insurance, maintenance, repairs and capital expenditures. Scheduled rental revenue typically varies during the lease term and thus rental income is recognized on a straight-line basis, unless there is considerable risk as to collectability, so as to produce a constant periodic rent over the term of the lease. Accrued rental income is the aggregate difference between the scheduled rents which vary during the lease term and the income recognized on a straight-line basis and is recorded in other assets. Rental expenses (if any) are charged to operations as incurred.
Securitization of Receivables
We have established various special purpose entities or securitization trusts for the purpose of securitizing certain financing receivables or other debt investments. We determined that the trusts used in securitizations are variable interest entities, as defined in ASC 810, Consolidation. We typically serve as primary or master servicer of these trusts; however, as the servicer, we do not have the power to make significant decisions impacting the performance of the trusts. Based on an analysis of the structure of the trusts, under U.S. GAAP, we have concluded that we are not the primary beneficiary of the trusts as we do not have power over the trusts significant activities. Therefore, we do not consolidate these trusts in our consolidated financial statements.
We account for transfers of financing receivables to these securitization trusts as sales pursuant to ASC 860, Transfers and Servicing, as we have concluded the transferred receivables have been isolated from the transferor
- 101 -
Table of Contents
(i.e., put presumptively beyond the reach of the transferor and its creditors, even in bankruptcy or other receivership) and we have surrendered control over the transferred receivables. We have received true-sale-at-law opinions for all of our securitization trust structures and non-consolidation legal opinions for all but one old securitization trust structure that support our conclusion regarding the transferred receivables. When we sell receivables in securitizations, we generally retain minor interests in the form of servicing rights and residual assets, which we refer to as securitization assets.
Gain or loss on the sale of receivables is calculated based on the excess of the proceeds received from the securitization (less any transaction costs) plus any retained interests obtained over the cost basis of the receivables sold. For retained interests, we generally estimate fair value based on the present value of future expected cash flows using our best estimates of the key assumptions of anticipated losses, prepayment rates, and current market discount rates commensurate with the risks involved.
We initially account for all separately recognized servicing assets and servicing liabilities at fair value and subsequently measure such servicing assets and liabilities using the amortization method. Servicing assets and liabilities are amortized in proportion to, and over the period of, estimated net servicing income with servicing income recognized as earned. We assess servicing assets for impairment at each reporting date. If the amortized cost of servicing assets is greater than the estimated fair value, we will recognize an impairment in net income.
Our other retained interest in securitized assets, the residual assets, are classified as available-for-sale securities and carried at fair value on the consolidated balance sheets in Other Assets. We generally do not sell our residual assets. Our residual assets are evaluated for impairment on a quarterly basis. Interest income related to the residual assets is recognized using the effective interest rate method. If there is a change in expected cash flows related to the residual assets, we calculate a new yield based on the current amortized cost of the residual assets and the revised expected cash flows. This yield is used prospectively to recognize interest income.
Cash and Cash Equivalents
Cash and cash equivalents include short-term government securities, certificates of deposit and money market funds, all of which had an original maturity of three months or less at the date of purchase. These securities are carried at their purchase price, which approximates fair value.
Restricted Cash
Restricted cash includes cash and cash equivalents set aside with certain lenders primarily to support deferred funding and other obligations outstanding as of the balance sheet dates. Restricted Cash is reported as part of Other Assets in the consolidated balance sheets.
Variable Interest Entities and Equity Method Investments in Affiliates
We account for our investment in entities that are considered voting or variable interest entities under ASC 810. We perform an ongoing assessment to determine the primary beneficiary of each entity as required by ASC 810. We have established various special purpose entities or securitization trusts for the purpose of securitizing certain financing receivables or other debt investments which are not consolidated in our financial statements as described in Securitization of Receivables above.
Substantially all of the activities of the special purpose entities that are formed for the purpose of holding our financing receivables and investments on our balance sheet are closely associated with our activities. Based on our assessment, we determined that we have power over and receive the benefits of these special purpose entities; hence, we are the primary beneficiary and should consolidate these entities under the provisions of ASC 810.
As described in Note 1, we made equity investments in various wind projects. We share in the cash flows and tax attributes according to a negotiated schedule. Wind projects are typically owned in partnerships structures (using limited liability corporations, or LLCs taxed as partnerships) where we, along with other large
- 102 -
Table of Contents
institutional investors, if any, receive a stated preferred return consisting of a priority distribution of the projects cash flows, and in some cases, tax attributes. Once this preferred return is achieved, the partnership flips and the wind energy company which operates the project, receives the a larger portion of the cash flows through its interest in the holding company and we, along with the other institutional investors, will have an on-going residual interest.
The limited liability entities with JPMorgan (which own the interest in the holding companies that own certain of the wind projects) are jointly controlled with each member owning 50% of the voting stock. Based on our assessment, we have determined that these entities are voting interest entities and we have the ability to exercise influence over their operating and financial policies and as such we therefore account for such investments using the equity method. JPMorgan has certain rights to withdraw from the partnership in the future in which case we would be obligated to buy their interest at the fair market value at the time of withdraw.
We own directly, or indirectly as partners with JPMorgan, interests in various limited liability holding companies that own wind projects. Each of the holding companies is partially owned and operated by a wind energy company. Based on our assessment, we have determined that each of the holding companies (including the acquired ownership interest in the Creston Ridge Management, LLC and Buckeye Wind Energy Class B Holdings LLC) is a variable interest entity and that we have the ability to exercise influence over operating and financial policies of the holding companies, but we are not the primary beneficiary as we do not have the power to direct the most important decisions related to the most significant activities of the investment. Thus we do not consolidate the limited liability entities or the holding companies, but account for them using the equity method of accounting as described below. Our maximum exposure to loss associated with these entities is limited to our investment.
Under the equity method of accounting, the carrying value of our equity method investments is determined based on amounts we invested, adjusted for the equity in earnings or losses of investee allocated based on the limited liability entity agreement, less distributions received. Because the limited liability entity and holding company agreements contain preferences with regard to cash flows from operations, capital events and liquidation, we reflect our share of profits and losses by determining the difference between our claim on the investees book value at the end and the beginning of the period. This claim is calculated as the amount we would receive (or be obligated to pay) if the investee were to liquidate all of its assets at recorded amounts determined in accordance with U.S. GAAP and distribute the resulting cash to creditors and investors in accordance with their respective priorities. This method is commonly referred to as the hypothetical liquidation at book value method or (HLBV). Intra-company gains and losses are eliminated for an amount equal to our interest and are reflected in the share in loss from equity method investment in affiliate in the consolidated statements of operations. Cash distributions received from our equity method investments are classified as operating cash flows to the extent of cumulative HLBV earnings. Any additional cash flows are deemed to be returns of the investment and are classified as investing cash flows. We have elected to recognize earnings from these investments one quarter in arrears to allow for the receipt of financial information.
We evaluate the realization of our investment accounted for using the equity method if circumstances indicate that our investment is OTTI. OTTI impairment occurs when the estimated fair value of an investment is below the carrying value and the difference is determined to not be recoverable. This evaluation requires significant judgment regarding, but not limited to, the severity and duration of the impairment; the ability and intent to hold the securities until recovery; financial condition, liquidity, and near-term prospects of the issuer; specific events; and other factors. Based on an evaluation of our equity method investments, we determined that no impairment had occurred for 2015 or 2014. We did not have any equity method investments as of December 31, 2013.
Intangible Assets and Goodwill
Intangible assets are amortized using the straight-line method over the remaining estimated life, generally ranging from three to 15 years. The carrying amounts of intangible assets are reviewed for impairment when
- 103 -
Table of Contents
indicators of impairment are identified. If the carrying amount of the asset exceeds the undiscounted expected cash flows that are directly associated with the use and eventual disposition of the asset, an impairment charge is recognized to the extent the carrying amount of the asset exceeds the fair value.
Goodwill represents the costs of business acquisitions in excess of the fair value of identifiable net assets acquired. We evaluate goodwill for potential impairment for our one reporting unit annually on September 30, or whenever impairment indicators are present. We perform a two-step goodwill impairment test to identify potential goodwill impairment and measure the amount of goodwill impairment to be recognized, if any. First, we compare our fair value using our market capitalization based on the average market price relative to our current carrying value, including goodwill. If our fair value is in excess of the carrying value, the related goodwill is not considered impaired and no further analysis is necessary. If, however, our carrying value exceeds our fair value, there is an indication of potential impairment and a second step of testing is performed to measure the amount of impairment, if any. If our estimated fair value were to be less than our book value, the second step of the review process is performed to calculate the implied fair value of our goodwill in order to determine whether any impairment of goodwill is required. The implied fair value of the goodwill is calculated by allocating our estimated fair value to all of our assets and liabilities (including any unrecognized intangible assets) as if we had been acquired in a business combination. If the carrying value of the goodwill exceeds the implied fair value of the goodwill, we recognize an impairment loss for that excess amount. We did not recognize any goodwill impairments in 2015, 2014, or 2013.
Derivative Financial Instruments
We may utilize derivative financial instruments, primarily interest rate swaps, to manage, or hedge, our interest rate risk exposures associated with new debt issuances, to manage our exposure to fluctuations in interest rates on variable rate debt, and to optimize the mix of our fixed and floating-rate debt. In addition, we may use forward-starting interest rate swap contracts to manage a portion of our interest rate exposure for anticipated refinancing of our long-term debts. Our objective is to manage the impact of interest rates on the results of operations and cash flows and the market value of our debt.
We use interest rate swaps designated as cash flow hedges to manage our interest rate exposures associated with new debt issuances and to manage our exposure to fluctuations in interest rates on variable rate debt. We attempt to use derivative instruments that are considered highly effective in reducing our exposure to the interest rate risk that they are designated to hedge. This effectiveness is essential in order to qualify for hedge accounting. Instruments that meet these hedging criteria are formally designated as hedges at the inception of the derivative contract. Derivatives are recorded on the consolidated balance sheet at fair value. If a derivative is designated as a cash flow hedge, the effective portions of changes in the fair value of the derivative are recorded in Accumulated Other Comprehensive Income, net of associated deferred income tax effects, in our Consolidated Statements of Stockholders Equity and Comprehensive Income (Loss) and are recognized in the Consolidated Statements of Operations when the hedged item affects earnings. Changes in fair value of the ineffective portions of these hedges are recognized in Other, net in our Consolidated Statements of Operations. For derivative instruments not designated as hedging instruments, changes in fair value are recognized in our Consolidated Statements of Operations in the period that the change occurs. We assess, both at the inception of the hedge and on an ongoing basis, whether the derivatives that are used in hedging transactions are highly effective in offsetting changes in cash flows of hedged items. We do not hold derivatives for trading purposes.
Interest rate swap contracts contain a credit risk that counterparties may be unable to fulfill the terms of the agreement. We attempt to minimize that risk by evaluating the creditworthiness of its counterparties, who are limited to major banks and financial institutions, and do not anticipate nonperformance by the counterparties.
Income Taxes
We elected and qualified to be taxed as a REIT for U.S. federal income tax purposes, commencing with our taxable year ended December 31, 2013. To qualify as a REIT, we must meet a number of organizational and
- 104 -
Table of Contents
operational requirements, including a requirement that we currently distribute at least 90% of our net taxable income, excluding capital gains, to our shareholders. We intend to continue to meet the requirements for qualification as a REIT. As a REIT, we are not subject to U.S. federal corporate income tax on that portion of net income that is currently distributed to our owners. However, our taxable REIT subsidiaries (TRS) will generally be subject to U.S. federal, state, and local income taxes as well as taxes of foreign jurisdictions, if any. Prior to the completion of the IPO, the Predecessor was taxed as a partnership for U.S. federal income tax purposes.
We account for income taxes of our TRS using the asset and liability method. Deferred tax assets and liabilities are recognized for the estimated future tax consequences attributable to the differences between the consolidated financial statement carrying amounts of existing assets and liabilities and their respective tax bases. Deferred tax assets and liabilities are measured using enacted tax rates in effect for the year in which those temporary differences are expected to be recovered or settled. The effect on deferred tax assets and liabilities from a change in tax rates is recognized in earnings in the period when the new rate is enacted.
We apply accounting guidance with respect to how uncertain tax positions should be recognized, measured, presented, and disclosed in the financial statements. This guidance requires the accounting and disclosure of tax positions taken or expected to be taken in the course of preparing our tax returns to determine whether the tax positions are more likely than not to be sustained by the applicable tax authority. We are required to analyze all open tax years, as defined by the statute of limitations, for all major jurisdictions, which includes U.S. federal and certain states.
Equity-Based Compensation
At the time of completion of our IPO, we adopted our 2013 Equity Incentive Plan (the 2013 Plan), which provides for grants of stock options, stock appreciation rights, restricted stock units, shares of restricted common stock, phantom shares, dividend equivalent rights, long-term incentive-plan units (LTIP units) and other restricted limited partnership units issued by our Operating Partnership and other equity-based awards. From time to time, we may award unvested restricted stock as compensation to members of our senior management team, our independent directors, employees, advisors, consultants and other personnel under our 2013 Plan.
We record compensation expense for stock awards in accordance with ASC 718, CompensationStock Compensation. We record compensation expense for unvested shares that vest solely based on service conditions on a straight-line basis over the vesting period based upon the fair market value of the shares on the date of grant, adjusted for forfeitures. For awards where the vesting is contingent upon achievement of certain performance targets, compensation expense is recorded over the requisite service period (which includes the performance period) based on our estimate of the achievement of the various performance targets, adjusted for forfeitures. Our share price at the date of grant and actual performance results at the end of the performance period determine the fair value and the number of shares that will ultimately be awarded. The award earned is generally between 0% and 150% of the initial target, depending on the extent to which the performance target are met. If minimum performance targets are not attained, no awards will be made.
Earnings Per Share
We compute earnings per share of common stock in accordance with ASC 260, Earnings Per Share. Basic earnings per share is calculated by dividing net income attributable to controlling stockholders (after consideration of the earnings allocated to unvested shares of restricted common stock or restricted stock units) by the weighted-average number of shares of common stock outstanding during the period excluding the weighted average number of unvested shares of restricted common stock or restricted stock units (participating securities as defined in Note 12). Diluted earnings per share is calculated by dividing net income attributable to controlling stockholders by the weighted-average number of shares of common stock outstanding during the period plus other potentially dilutive securities. No adjustment is made for shares that are anti-dilutive during a period.
- 105 -
Table of Contents
Segment Reporting
We provide and arrange debt and equity financing for sustainable infrastructure projects and report all of our activities as one business segment.
Recently Issued Accounting Pronouncements
Revenue from Contracts with Customers
In May 2014, the FASB issued Accounting Standards Update (ASU) No. 2014-09, Revenue from Contracts with Customers, requiring an entity to recognize the amount of revenue to which it expects to be entitled for the transfer of promised goods or services to customers. The updated standard will replace most existing revenue recognition guidance in U.S. GAAP when it becomes effective and permits the use of either the retrospective or cumulative effect transition method. The FASB proposed delaying the effective date of the standard by one year and issued a proposal that is intended to clarify and simplify the guidance. The updated standard becomes effective for us on January 1, 2018 and we expect will be first presented in our March 31, 2018, Form 10-Q. We have not yet selected a transition method, and we are currently evaluating the effect that the updated standard will have on our consolidated financial statements and related disclosures.
Debt Issuance Costs
In April 2015, the FASB issued ASU No. 2015-03, InterestImputation of Interest, which simplifies the presentation of debt issuance costs. ASU 2015-03 requires debt issuance costs related to long-term debt to be presented in the balance sheet as a reduction to the carrying amount of the related debt liability, consistent with the presentation of discounts. ASU 2015-03 is effective for fiscal years beginning after December 15, 2015, and for interim periods within those fiscal years, and is eligible for early adoption. We have adopted this standard in our consolidated financial statements for our nonrecourse debt. As allowed under the ASU, we continue to record unamortized issuance costs related to our credit facility in Other Assets. We do not have a material amount of unamortized debt issuance costs and thus the adoption of the new standard did not have a material effect on our consolidated financial statements and related disclosures. See Note 8 for further information.
3. Fair Value Measurements
Fair value is defined as the price that would be received for an asset or paid to transfer a liability in an orderly transaction between market participants on the measurement date. The fair value accounting guidance provides a three-level hierarchy for classifying financial instruments. The levels of inputs used to determine the fair value of our financial assets and liabilities carried on the balance sheet at fair value and for those which only disclosure of fair value is required are characterized in accordance with the fair value hierarchy established by ASC 820, Fair Value Measurements. Where inputs for a financial asset or liability fall in more than one level in the fair value hierarchy, the financial asset or liability is classified in its entirety based on the lowest level input that is significant to the fair value measurement of that financial asset or liability. We use our judgment and consider factors specific to the financial assets and liabilities in determining the significance of an input to the fair value measurements. As of December 31, 2015 and 2014, only our residual assets (described in Note 5), financing receivables held-for-sale, interest rate swaps and investments available-for-sale, if any, were carried at fair value on the consolidated balance sheets on a recurring basis. The three levels of the fair value hierarchy are described below:
| | Level 1Quoted prices (unadjusted) in active markets that are accessible at the measurement date. |
| | Level 2Observable prices that are based on inputs not quoted on active markets, but corroborated by market data. |
| | Level 3Unobservable inputs are used when little or no market data is available. |
- 106 -
Table of Contents
Unless otherwise discussed below, fair value is measured using a discounted cash flow model, contractual terms and Level 3 unobservable inputs which consist of base interest rates and spreads over base rates which are based upon market observation and recent comparable transactions. An increase in these unobservable inputs would result in a lower fair value and a decline would result in a higher fair value. The financing receivables held for sale are carried at the lower of cost or market.
| As of December 31, 2015 | ||||||||||
| Fair Value |
Carrying Value |
Level | ||||||||
| (dollars in millions) | ||||||||||
| Assets |
||||||||||
| Financing receivables |
$ | 806 | $ | 784 | Level 3 | |||||
| Financing receivables held-for-sale |
61 | 60 | Level 3 | |||||||
| Investments available-for-sale (1) |
29 | 29 | Level 3 | |||||||
| Liabilities |
||||||||||
| Credit facility |
$ | 247 | $ | 247 | Level 3 | |||||
| Asset-backed nonrecourse notes (2) |
579 | 579 | Level 3 | |||||||
| Other nonrecourse debt |
111 | 101 | Level 3 | |||||||
| Derivative liabilities |
1 | 1 | Level 2 | |||||||
| (1) | The amortized cost of our investments available-for-sale as of December 31, 2015, was $31 million. |
| (2) | Carrying value of asset-based nonrecourse notes excludes unamortized debt issuance costs. |
| As of December 31, 2014 | ||||||||||
| Fair Value |
Carrying Value |
Level | ||||||||
| (dollars in millions) | ||||||||||
| Assets |
||||||||||
| Financing receivables (1) |
$ | 598 | $ | 553 | Level 3 | |||||
| Financing receivables held-for-sale |
62 | 62 | Level 3 | |||||||
| Investments available-for-sale (2) |
27 | 27 | Level 3 | |||||||
| Liabilities |
||||||||||
| Credit facility |
$ | 316 | $ | 316 | Level 3 | |||||
| Asset-backed nonrecourse notes (3) |
208 | 208 | Level 3 | |||||||
| Other nonrecourse debt |
127 | 113 | Level 3 | |||||||
| (1) | An allowance for loan losses of $1.2 million was included in the carrying value of the financing receivables as of December 31, 2014. There was no allowance for loan losses outstanding as of December 31, 2015. |
| (2) | The amortized cost of our investments available-for-sale as of December 31, 2014, was $27 million. |
| (3) | Carrying value of asset-backed nonrecourse notes excludes unamortized debt issuance costs. |
- 107 -
Table of Contents
Investments
During 2014 as part of our portfolio management process, we sold an investment designated as held-to-maturity. As a result, we have transferred all of our remaining investments in debt securities to investments available-for-sale at fair value. The following table reconciles the beginning and ending balances for our Level 3 investments that are carried at fair value on a recurring basis following the transfer of our investments to available-for-sale:
| For the year ended December 31, |
||||||||
| 2015 | 2014 | |||||||
| (dollars in millions) | ||||||||
| Balance, beginning of period |
$ | 27 | $ | | ||||
| Transfers to / purchases of available-for-sale debt securities. |
33 | 83 | ||||||
| Payments on available-for-sale debt securities |
(8 | ) | | |||||
| Sale of available-for-sale debt securities |
(22 | ) | (60 | ) | ||||
| Unrealized gains on debt securities transferred to available for sale |
| 5 | ||||||
| Gains on debt securities recorded in earnings |
1 | 3 | ||||||
| Losses on debt securities recorded in OCI |
(2 | ) | (4 | ) | ||||
|
|
|
|
|
|||||
| Balance, end of Period |
$ | 29 | $ | 27 | ||||
|
|
|
|
|
|||||
For investments held at fair value, we used a range of interest rate spreads of 3% to 5% based upon comparable transactions.
Interest Rate Swap Agreements
The fair values of the derivative financial instruments are determined using widely accepted valuation techniques including discounted cash flow analysis on the expected cash flows of each derivative. We have determined that the significant inputs, such as interest yield curves and discount rates, used to value our derivatives fall within Level 2 of the fair value hierarchy and that the credit valuation adjustments associated with our counterparties and our own credit risk utilize Level 3 inputs, such as estimates of current credit spreads to evaluate the likelihood of our or our counterparties default. As of December 31, 2015, we assessed the significance of the impact of the credit valuation adjustments on the overall valuation of our derivative positions and determined that the credit valuation adjustments were not significant to the overall valuation of our derivatives. As a result, we determined that our derivative valuations in their entirety are classified in Level 2 of the fair value hierarchy. The fair values of the derivative financial instruments are included in the accounts payable, accrued expenses and other line item in the consolidated balance sheets.
Non-recurring Fair Value Measurements
Our financial statements may include non-recurring fair value measurements related to acquisitions, if any. Assets acquired in a business combination are recorded at their fair value. We use third party valuation firms to assist us with developing our estimates of fair value.
- 108 -
Table of Contents
Concentration of Credit Risk
Financing receivables, investments and leases consist of primarily U.S. federal government-backed receivables, investment grade state and local government receivables and receivables from various sustainable infrastructure projects and do not, in our view, represent a significant concentration of credit risk. See Note 6 for an analysis by type of obligor. As described above, we do not believe we have a significant credit exposure to our interest rate swap providers. We had cash deposits that are subject to credit risk as shown below:
| December 31, | ||||||||
| 2015 | 2014 | |||||||
| (dollars in millions) | ||||||||
| Cash Deposits |
$ | 43 | $ | 58 | ||||
| Restricted Cash Deposits (included in Other assets) |
36 | 12 | ||||||
|
|
|
|
|
|||||
| Total Cash Deposits |
79 | 70 | ||||||
| Amount of Cash Deposits in excess of amounts federally insured |
$ | 75 | $ | 66 | ||||
4. Non-Controlling Interest
Non-Controlling Interest in Consolidated Entities
Units of limited partnership interests in the Operating Partnership (OP units) that are owned by limited partners other than the Company are included in non-controlling interest on our consolidated balance sheets. The outstanding OP units held by outside limited partners represents approximately 1% of our outstanding OP units and are redeemable for cash, or at our option, for a like number of shares of our common stock. We exchanged 46,290 OP units held by our non-controlling interest holders for the same number of shares of our common stock during the year ended December 31, 2015. For the year ended December 31, 2014, we redeemed 131,093 OP units held by our non-controlling interest holders for cash of $1.8 million. The non-controlling interest holders are generally allocated their pro rata share of income, other comprehensive income and equity transactions.
5. Securitization of Receivables
The following summarizes certain transactions with our securitization trusts:
| Year ended December 31, | ||||||||||||
| 2015 | 2014 | 2013 | ||||||||||
| (dollars in millions) | ||||||||||||
| Gains on securitizations |
$ | 8 | $ | 9 | $ | 6 | ||||||
| Purchase of receivables securitized |
$ | 286 | $ | 248 | $ | 260 | ||||||
| Proceeds from securitizations |
$ | 294 | $ | 257 | $ | 266 | ||||||
| Residual and servicing assets included in Other Assets |
$ | 9 | $ | 6 | $ | 5 | ||||||
| Cash received from residual and servicing assets |
$ | 2 | $ | 2 | $ | 1 | ||||||
In connection with securitization transactions, we typically retain servicing responsibilities and residual assets. In certain instances, we receive annual servicing fees ranging from 0.05% to 0.20% of the outstanding balance. Included in other assets in our consolidated balance sheets are our servicing assets at amortized cost and our residual assets at fair value. Our residual assets are subordinate to investors interests, and their values are subject to credit, prepayment and interest rate risks on the transferred financial assets. The investors and the securitization trusts have no recourse to our other assets for failure of debtors to pay when due. In computing gains and losses on securitizations, we use the same 8% discount rate we use for the fair value calculation of residual assets, which is determined based on a review of comparable market transactions.
As of December 31, 2015 and 2014, our managed assets totaled $3.2 billion and $2.5 billion, of which $1.8 billion and $1.7 billion were securitized assets held in unconsolidated securitization trusts. There were no
- 109 -
Table of Contents
securitization credit losses in 2015, 2014 or 2013, and no material securitization delinquencies as of December 31, 2015 and 2014. The securitized assets consist of financing receivables from contracts for the installation of energy efficiency and other technologies in facilities owned by, or operated for or by, the federal government where the ultimate obligor is the U.S. federal government. The contracts may have guarantees of energy savings from third party service providers, the majority of which are entities rated investment grade by an independent rating agency. Based on the nature of the receivables and experience-to-date, we do not currently expect to incur any credit losses on the receivables sold.
6. Our Portfolio
As of December 31, 2015, our Portfolio included approximately $1.3 billion of financing receivables, investments, real estate and equity method investments on our balance sheet. The financing receivables and investments are typically collateralized by contractually committed debt obligations of government entities or private high credit quality obligors and are often supported by additional forms of credit enhancement, including security interests and supplier guaranties. The real estate is typically land and related lease intangibles for long-term leases to wind and solar projects with high credit quality obligors. The equity method investments represent our minority equity investments in wind projects.
The following is an analysis of our Portfolio by type of obligor and credit quality as of December 31, 2015:
| Investment Grade | ||||||||||||||||||||||||
| Government (1) | Commercial Investment Grade (2) |
Commercial Non-Investment Grade (3) |
Subtotal, Debt and Real Estate |
Equity Method Investments (4) |
Total | |||||||||||||||||||
| (dollars in millions) | ||||||||||||||||||||||||
| Financing receivables |
$ | 401 | $ | 383 | $ | | $ | 784 | $ | | $ | 784 | ||||||||||||
| Financing receivables held-for-sale |
60 | | | 60 | | 60 | ||||||||||||||||||
| Investments |
| 16 | 13 | 29 | | 29 | ||||||||||||||||||
| Real estate (5) |
| 156 | | 156 | | 156 | ||||||||||||||||||
| Equity method investments |
| | | | 319 | 319 | ||||||||||||||||||
|
|
|
|
|
|
|
|
|
|
|
|
|
|||||||||||||
| Total |
$ | 461 | $ | 555 | $ | 13 | $ | 1,029 | $ | 319 | $ | 1,348 | ||||||||||||
|
|
|
|
|
|
|
|
|
|
|
|
|
|||||||||||||
| % of Debt and Real Estate Portfolio |
45 | % | 54 | % | 1 | % | 100 | % | N/A | N/A | ||||||||||||||
| Average Remaining Balance (6) |
$ | 12 | $ | 9 | $ | 13 | $ | 10 | $ | 27 | $ | 12 | ||||||||||||
| (1) | Transactions where the ultimate obligor is the U.S. federal government or state or local governments where the obligors are rated investment grade (either by an independent rating agency or based upon our internal credit analysis). This amount includes $297 million of U.S. federal government transactions and $164 million of transactions where the ultimate obligors are state or local governments. Transactions may have guaranties of energy savings from third party service providers, the majority of which are entities rated investment grade by an independent rating agency. |
| (2) | Transactions where the projects or the ultimate obligors are commercial entities, including institutions such as hospitals or universities, that have been rated investment grade (either by an independent rating agency or based on our internal credit analysis). Of this total, $12 million of the transactions have been rated investment grade by an independent rating agency. Commercial investment grade financing receivables include $175 million of internally rated residential solar loans where the cash flows which support our financing receivables are subordinated to the tax equity investors (whose return is largely derived from the renewable energy tax incentives) and for which we rely on certain tax related indemnities of the publicly traded residential solar provider. |
| (3) | Transactions where the projects or the ultimate obligors are commercial entities, including institutions such as hospitals or universities, that have ratings below investment grade (either by an independent rating agency or using our internal credit analysis). |
| (4) | Consists of ownership interests in operating wind projects in which we earn a preferred return. |
- 110 -
Table of Contents
| (5) | Includes the real estate and the lease intangible assets through which we receive scheduled lease payments, typically under long-term triple net lease agreements. |
| (6) | Excludes 77 transactions each with outstanding balances that are less than $1 million and that in the aggregate total $26 million. |
The components of financing receivables of December 31, 2015 and 2014 were as follows:
| December 31, | ||||||||
| 2015 | 2014 | |||||||
| (dollars in millions) | ||||||||
| Financing receivables |
||||||||
| Financing or minimum lease payments (1) |
$ | 1,025 | $ | 723 | ||||
| Unearned interest income |
(238 | ) | (166 | ) | ||||
| Allowance for credit losses |
| (1 | ) | |||||
| Unearned fee income, net of initial direct costs |
(3 | ) | (3 | ) | ||||
|
|
|
|
|
|||||
| Financing receivables (1) |
$ | 784 | $ | 553 | ||||
|
|
|
|
|
|||||
| (1) | Excludes $60 million and $62 million in financing receivables held-for-sale at December 31, 2015 and 2014, respectively. |
In accordance with the terms of certain financing receivables purchase agreements, payments of the purchase price is scheduled to be made over time, generally within twelve months of entering into the transaction, and as a result, we have recorded deferred funding obligations of $108 million and $88 million as of December 31, 2015 and 2014, respectively.
The following table provides a summary of our anticipated maturity dates of our financing receivables and investments and the weighted average yield for each range of maturities as of December 31, 2015:
| Total | Less than 1 year | 1-5 years | 5-10 years | More than 10 years |
||||||||||||||||
| (dollars in millions) | ||||||||||||||||||||
| Financing Receivables (1) |
||||||||||||||||||||
| Payment due by period |
$ | 784 | $ | | $ | 122 | $ | 52 | $ | 610 | ||||||||||
| Weighted average yield by period |
5 | % | | % | 6 | % | 5 | % | 5 | % | ||||||||||
| Investments |
||||||||||||||||||||
| Payment due by period |
$ | 29 | $ | 13 | $ | | $ | 1 | $ | 15 | ||||||||||
| Weighted average yield by period |
5 | % | 6 | % | | % | 5 | % | 4 | % | ||||||||||
| (1) | Excludes financing receivables held-for-sale of $60 million. |
Our real estate is leased to renewable energy projects, typically under long-term triple net leases with expiration dates that range between the years 2033 and 2045 under the initial terms and 2047 and 2080 if all extensions are exercised. The components of our real estate portfolio as of December 31, 2015 and 2014 were as follows:
| December 31, | ||||||||
| 2015 | 2014 | |||||||
| (dollars in million) | ||||||||
| Real Estate |
||||||||
| Land |
$ | 129 | $ | 91 | ||||
| Real estate related intangibles |
28 | 23 | ||||||
| Accumulated amortization of real estate intangibles |
(1 | ) | (0 | ) | ||||
|
|
|
|
|
|||||
| Real Estate |
$ | 156 | $ | 114 | ||||
|
|
|
|
|
|||||
- 111 -
Table of Contents
There are conservation easement agreements covering several of our properties that limit the use of the property upon expiration of the respective leases. The real estate related intangible assets are amortized on a straight-line basis over the contracted lease term. As of December 31, 2015, the future amortization expense of these intangible assets is as follows:
| (dollars in millions) | ||||
| Year Ending December 31, |
||||
| 2016 |
$ | 1 | ||
| 2017 |
1 | |||
| 2018 |
1 | |||
| 2019 |
1 | |||
| 2020 |
1 | |||
| Thereafter |
22 | |||
|
|
|
|||
| Total |
$ | 27 | ||
|
|
|
|||
As of December 31, 2015, the future minimum rental income payments under our land lease agreements is as follows:
| (dollars in millions) | ||||
| Year Ending December 31, |
||||
| 2016 |
$ | 8 | ||
| 2017 |
9 | |||
| 2018 |
10 | |||
| 2019 |
10 | |||
| 2020 |
10 | |||
| Thereafter |
250 | |||
|
|
|
|||
| Total |
$ | 297 | ||
|
|
|
|||
In December 2013, we recorded an allowance of $11.0 million on the remaining $11.8 million balance of a $24 million loan made in May 2013 to a wholly owned subsidiary of EnergySource LLC (EnergySource) to be used for a geothermal project. In November 2014, we entered into a Forbearance and Mutual Release Agreement with EnergySource under which in full satisfaction of the remaining balance of our loan, we would realize a portion of the proceeds from the sale of land held by EnergySource in an estimated amount of $0.8 million. As a result of this agreement, we charged off $9.8 million of the receivable against the allowance, resulting in a remaining allowance of $1.2 million. During the year ended December 31, 2015, we collected the $0.8 million balance, as a final recovery from the EnergySource loan and therefore, we charged off the remaining loan balance of $1.2 million against the allowance of $1.2 million. There was no effect on the statement of operations for this loan during the years ended December 31, 2015 and 2014. For the year ended December 31, 2013, the loan had an average balance of $24.7 million and we recorded and collected interest income on the loan of $2.4 million. Certain of our executive officers and directors own an indirect minority interest in EnergySource following the distribution of the Predecessors ownership interest prior to our IPO.
We had no other financing receivables, investments or leases that were impaired or on nonaccrual status as of December 31, 2015, 2014 or 2013. We did not have any loan modifications that qualify as trouble debt restructurings for the years ended December 31, 2015, 2014, or 2013.
7. Credit Facility
We have a senior secured revolving credit facility which provides for total maximum advances of $1.5 billion with the aggregate amount outstanding at any point in time of $500 million and which consists of two components, the G&I Facility and the PF Facility. The G&I Facility can be used to leverage certain qualifying government and institutional financings entered into by us and the PF Facility can be used to leverage certain qualifying project financings entered into by us.
- 112 -
Table of Contents
The facility was originally entered into in 2013 and has been amended a number of times, including in January 2016. The effect of the various amendments has been to increase the size, flexibility and allocation of the facility and extend the termination date to July 19, 2019. The limit of borrowing at any point in time and the total maximum advances is summarized below:
| Limit of Borrowing at any point in time |
Maximum Total Advances | |||||||||||||||
| As of |
G&I Facility | PF Facility | G&I Facility | PF Facility | ||||||||||||
| (dollars in millions) | ||||||||||||||||
| December 31, 2014 |
$ | 125 | $ | 325 | $ | 375 | $ | 975 | ||||||||
| December 31, 2015 |
$ | 150 | $ | 350 | $ | 450 | $ | 1,050 | ||||||||
| January 2016 |
$ | 250 | $ | 250 | $ | 600 | $ | 900 | ||||||||
Loans under the G&I Facility bear interest at a rate equal to the London Interbank Offered Rate (LIBOR) plus 1.5% or, under certain circumstances, 1.5% plus the highest of (i) the Federal Funds Rate plus 0.5%, (ii) the rate of interest publicly announced by Bank of America from time to time as its prime rate, and (iii) LIBOR plus 1.0%. Loans under the PF Facility bear interest at a rate equal to LIBOR plus 2.5% or, under certain circumstances, 2.5% plus the highest of (i) the Federal Funds Rate plus 0.5%, (ii) the rate of interest publicly announced by Bank of America from time to time as its prime rate, and (iii) LIBOR plus 1.0%. Under the PF Facility, we also have the option to borrow at a fixed rate of interest until the expiration of the credit facility in July 2019. The fixed rate is determined by agreement with the Administrative Agent and is based on the prevailing US SWAP rate of an equivalent term to the average-life of the fixed rate portion of the borrowing plus an agreed upon margin. The loans are made through wholly-owned special purpose subsidiaries (the Borrowers) and we have guaranteed the obligations of the Borrowers under the credit facility pursuant to (x) a Continuing Guaranty, dated July 19, 2013, and (y) a Limited Guaranty, dated July 19, 2013, both as amended and restated.
Any financing we propose to be included in the borrowing base as collateral under the facility is subject to the approval of the administrative agent in its sole discretion and the payment of a placement fee. We may, with the consent of the administrative agent, borrow against new projects before such projects become Approved Financings (as defined in the PF Facility loan agreement) but after they have been pledged as collateral. The amount eligible to be drawn under the facility for purposes of financing such investments will be based on a discount to the value of each investment or an applicable valuation percentage. Under the G&I Facility, the applicable valuation percentage for non-delinquent investments is 85% in the case of a U.S. federal government obligor, 80% in the case of an institutional obligor or a state and local obligor, and with respect to other obligors or in certain circumstances, such other percentage as the administrative agent may prescribe. Under the PF Facility, the applicable valuation percentage is 67% or such other percentage as the administrative agent may prescribe. The sum of approved financings after taking into account the valuation percentages and any changes in the valuation of the financings in accordance with the loan agreements determines the borrowing capacity, subject to the overall facility limits described above.
The following table provides additional detail on our credit facility as of December 31, 2015 and 2014:
| December 31, | ||||||||
| 2015 | 2014 | |||||||
| (dollars in millions) | ||||||||
| Outstanding balance |
$ | 247 | $ | 316 | ||||
| Value of collateral pledged to credit facility |
$ | 356 | $ | 422 | ||||
| Weighted average short-term borrowing rate |
2.3 | % | 2.4 | % | ||||
We incurred approximately $12 million of costs associated with the credit facility that have been capitalized (included in other assets on the consolidated balance sheets) and will be amortized on a straight-line basis over
- 113 -
Table of Contents
the term of the Loan Agreements. On each monthly payment date, the Borrowers shall also pay to the administrative agent, for the benefit of the lenders, certain availability fees for each Loan Agreement equal to 0.50%, divided by 360, multiplied by the excess of the available borrowing capacity under each component of the credit facility over the actual amount borrowed under such component.
The credit facility contains terms, conditions, covenants, and representations and warranties that are customary and typical for a transaction of this nature, including various affirmative and negative covenants, and limitations on the incurrence of liens and indebtedness, investments, fundamental organizational changes, dispositions, changes in the nature of business, transactions with affiliates, use of proceeds and stock repurchases.
The credit facility also includes customary events of default, including the existence of a default in more than 50% of underlying financings. The occurrence of an event of default may result in termination of the credit facility, acceleration of amounts due under the credit facility, and accrual of default interest at a rate of LIBOR plus 2.50% in the case of the G&I Facility and at a rate of LIBOR plus 5.00% in the case of the PF Facility.
We were in compliance with the required financial covenants described below at each quarterly reporting date that such covenants were applicable:
| Covenant |
Covenant Threshold |
|||
| Minimum Liquidity (defined as available borrowings under the Loan Agreements plus unrestricted cash divided by actual borrowings) of greater than: |
5 | % | ||
| 12 month rolling Net Interest Margin of greater than: |
zero | |||
| Maximum Debt to Equity Ratio of less than: (1) |
4 to 1 | |||
| (1) | Debt is defined as Total Indebtedness excluding accounts payable and accrued expenses and nonrecourse debt. |
8. Nonrecourse Debt
Asset-Backed Nonrecourse Debt
We have outstanding the following nonrecourse asset-backed debt and bank loans (dollars in millions):
| Issue Date | Original Principal |
Interest Rate |
Maturity Date | Anticipated Balance at Maturity |
||||||||||||||||
| HASI Sustainable Yield Bond 2013-1 |
December 2013 | $ | 100 | 2.79 | % | December 2019 | $ | 57 | ||||||||||||
| ABS Loan Agreement |
October 2014 | $ | 115 | 5.74 | % | September 2021 | $ | 17 | ||||||||||||
| HASI Sustainable Yield Bond 2015-1 |
September 2015 | $ | 101 | 4.28 | % | October 2034 | $ | | ||||||||||||
| HASI SYB Loan Agreement 2015-1 |
December 2015 | $ | 90 | 3.85 | % (1) | December 2021 | $ | | ||||||||||||
| HASI SYB Loan Agreement 2015-2 |
December 2015 | $ | 42 | 4.36 | % (1) | December 2023 | $ | | ||||||||||||
| HASI SYB Loan Agreement 2015-3 |
December 2015 | $ | 162 | 4.92 | % | December 2020 | $ | 132 | ||||||||||||
| (1) | Interest rate represents the initial periods LIBOR based rate plus the spread. Also see the interest rate swap contracts shown in the table below. |
- 114 -
Table of Contents
Outstanding amounts under the nonrecourse asset-backed debt agreements and bank loans and the value of assets pledged as security are as follows (dollars in millions):
| Outstanding Balance as of December 31, |
Value of Assets Pledged as of December 31, |
|||||||||||||||||
| 2015 | 2014 | 2015 | 2014 | Description of Assets Pledged |
||||||||||||||
| HASI Sustainable Yield Bond 2013-1 |
$ | 83 | $ | 92 | $ | 99 | $ | 104 | Financing receivables | |||||||||
| ABS Loan Agreement |
$ | 102 | $ | 116 | $ | 117 | $ | 144 | Equity interest in Strong Upwind Holdings I, LLC | |||||||||
| HASI Sustainable Yield Bond 2015-1 |
$ | 100 | $ | | $ | 139 | $ | | Financing receivables, real estate and real estate intangibles | |||||||||
| HASI SYB Loan Agreement 2015-1 |
$ | 90 | $ | | $ | 117 | $ | | Equity interest in Strong Upwind Holdings II and III, LLC, related interest rate swap | |||||||||
| HASI SYB Loan Agreement 2015-2 |
$ | 42 | $ | | $ | 71 | $ | | Equity interest in Buckeye Wind Energy Class B Holdings LLC, related interest rate swap | |||||||||
| HASI SYB Loan Agreement 2015-3 |
$ | 162 | $ | | $ | 175 | $ | | Residential Solar Financing receivables | |||||||||
| Debt issuance costs |
$ | (16 | ) | $ | (2 | ) | ||||||||||||
|
|
|
|
|
|||||||||||||||
| Asset-backed nonrecourse debt |
$ | 563 | $ | 206 | ||||||||||||||
|
|
|
|
|
|||||||||||||||
We have pledged the ownership interest in the relevant assets or the relevant assets themselves to bankruptcy remote entities as security for the nonrecourse debt. The assets and credit of these entities are not available to satisfy any of our other debts and obligations, except as set forth in the debt agreements. The debtors can only look to the cash flows of the pledged assets to satisfy the debt and we are not liable for nonpayment of such cash flows. The debt agreements contain terms, conditions, covenants, and representations and warranties that are customary and typical for a transaction of this nature, including limitations on the incurrence of liens and indebtedness, investments, fundamental organizational changes, dispositions, changes in the nature of business, transactions with affiliates, use of proceeds and stock repurchases. The agreements also include customary events of default, the occurrence of which may result in termination of the agreements, acceleration of amounts due, and accrual of default interest. We typically act as servicer for the debt transactions.
We have guaranteed the performance of the representations and warranties and other obligations of certain of our subsidiaries under certain of the debt agreements and provided an indemnify against certain losses from bad acts of such subsidiaries including fraud, failure to disclose a material fact, theft, misappropriation, voluntary bankruptcy or unauthorized transfers. In the case of the debt secured by our wind equity interests, we have also guarantied our compliance with certain tax matters and certain obligations if JPMorgan exercises its right to withdraw from our partnerships.
The HASI Sustainable Yield Bond (HASI SYB) 2015-1 consists of two notes, (i) $101 million in aggregate principal amount of 4.28% HASI SYB 2015-1A, Class A Bonds (the Class A Bonds) and (ii) $18 million in aggregate principal amount of 5.0% HASI SYB 2015-1B, Class B Bonds (the Class B Bonds), both with an anticipated repayment date in October 2034. The Class A Bonds rank senior to the Class B Bonds in priority of payment. We retained the Class B Bonds. The other loan and debt transactions were negotiated with, and held by, commercial banks, including one loan agreement that has a corporate financial subsidiary as a co-lender.
- 115 -
Table of Contents
In connection with several of our nonrecourse debt borrowings, we have entered into the following interest rate swaps which are designated as cash flow hedges (dollars in millions):
|
Notional Value as of December 31, |
Fair Value as of December 31, |
|||||||||||||||||||||||||
| Base Rate |
Hedged Rate |
2015 | 2014 | 2015 | 2014 | Term | ||||||||||||||||||||
| HASI SYB Loan Agreement 2015-1 |
3 month Libor | 1.55 | % | $ | 81 | $ | | $ | (0.3 | ) | $ | | September 2021 | |||||||||||||
| HASI SYB Loan Agreement 2015-2 |
3 month Libor | 1.52 | % | $ | 38 | $ | | $ | (0.1 | ) | $ | | December 2015 to December 2018 |
|||||||||||||
| HASI SYB Loan Agreement 2015-2 |
3 month Libor | 2.55 | % | $ | 29 | $ | | $ | (0.2 | ) | $ | | December 2018 to December 2024 |
|||||||||||||
|
|
|
|
|
|
|
|
|
|||||||||||||||||||
| Total |
$ | 148 | $ | | $ | (0.6 | ) | $ | | |||||||||||||||||
|
|
|
|
|
|
|
|
|
|||||||||||||||||||
The total fair value of our hedges relating to interest rate hedges that are effective in offsetting variable cash flows is reflected as unrealized losses in accumulated other comprehensive income and in Accounts payable, accrued expenses and other in the accompanying consolidated balance sheet. As of December 31, 2015, all of our derivatives were designated as hedging instruments and there was no ineffectiveness recorded on our designated hedges and no portion of the Accumulated other comprehensive income, net of associated deferred income tax effects was reclassified into interest expense. As of December 31, 2014 or 2013, we did not hold any derivatives.
Other Nonrecourse Debt
We have other nonrecourse debt that was used to finance certain of our financing receivables for the term of the financing receivables. Amounts due under nonrecourse notes are secured by financing receivables with a carrying value of approximately $97 million and $108 million as of December 31, 2015 and 2014, respectively, and there is no recourse to our general assets. Debt service payment requirements, in a majority of cases, are equal to or less than the cash flows received from the underlying financing receivables.
Additional information related to other nonrecourse debt by interest rate is as follows:
| As of December 31, 2015 |
Balance | Maturity | ||||||
| (dollars in millions) | ||||||||
| Fixed-rate promissory notes, interest rates from 2.26% to 5.00% per annum |
$ | 33 | 2017 to 2032 | |||||
| Fixed-rate promissory notes, interest rates from 5.01% to 6.50% per annum |
46 | 2017 to 2031 | ||||||
| Fixed-rate promissory notes, interest rates from 6.51% to 8.00% per annum |
22 | 2019 to 2031 | ||||||
|
|
|
|||||||
| Other nonrecourse debt |
$ | 101 | ||||||
|
|
|
|||||||
| As of December 31, 2014 |
Balance | Maturity | ||||||
| (dollars in millions) | ||||||||
| Fixed-rate promissory notes, interest rates from 2.06% to 5.00% per annum |
$ | 32 | 2015 to 2032 | |||||
| Fixed-rate promissory notes, interest rates from 5.01% to 6.50% per annum |
58 | 2015 to 2031 | ||||||
| Fixed-rate promissory notes, interest rates from 6.51% to 8.00% per annum |
23 | 2015 to 2031 | ||||||
|
|
|
|||||||
| Other nonrecourse debt |
$ | 113 | ||||||
|
|
|
|||||||
- 116 -
Table of Contents
The stated minimum maturities of nonrecourse debt as of December 31, 2015, were as follows:
| Nonrecourse Debt | ||||||||||||
| As of December 31, |
Asset Backed Nonrecourse Notes |
Other Nonrecourse Debt |
Total | |||||||||
| (dollars in millions) | ||||||||||||
| 2016 |
$ | 30 | $ | 18 | $ | 48 | ||||||
| 2017 |
31 | 14 | 45 | |||||||||
| 2018 |
31 | 7 | 38 | |||||||||
| 2019 |
92 | 4 | 96 | |||||||||
| 2020 |
168 | 4 | 172 | |||||||||
| Thereafter |
227 | 54 | 281 | |||||||||
|
|
|
|
|
|
|
|||||||
| Total minimum maturities |
579 | 101 | 680 | |||||||||
| Deferred Financing Costs, net |
(16 | ) | | (16 | ) | |||||||
|
|
|
|
|
|
|
|||||||
| $ | 563 | $ | 101 | $ | 664 | |||||||
|
|
|
|
|
|
|
|||||||
9. Commitments and Contingencies
Leases
We lease office space at our headquarters in Annapolis, Maryland under an operating lease entered into in July 2011 and amended in October 2013 to add additional space. The lease provides for operating expense reimbursements and annual escalations that are amortized over the respective lease terms on a straight-line basis. Lease payments under this lease commenced in March 2012 and incremental payments related to the amendment commenced in March 2014. The lease expires in 2022.
Rent expense was $0.5 million, $0.5 million, and $0.3 million for the years ended December 31, 2015, 2014, and 2013, respectively.
Future gross minimum lease payments are less than $0.5 million per year during the remaining term of the lease.
Litigation
The nature of our operations exposes us to the risk of claims and litigation in the normal course of our business. Other than non-material litigation arising out of the ordinary course of business, we are not currently subject to any legal proceedings that are probable of having a material adverse effect on our financial position, results of operations or cash flows.
10. Income Tax
We recorded a tax expense of $0 million for the years ended December 31, 2015, 2014 and 2013, respectively, related to the activities of our TRS. The income tax expense and benefits recorded were determined using a federal rate of 35% and a combined state rate, net of federal benefit, of 5%. The effective tax rate for the TRS for the year ended December 31, 2015, was (1)%, which is below the combined statutory tax rate of 40% primarily due to the establishment of a valuation allowance of approximately $2 million related to income statement items. The effective tax rate for the TRS for the year ended December 31, 2014, was 0%, which is below the combined statutory tax rate of 40% primarily as a result of the release of a valuation allowance of approximately $2.5 million.
During 2014, we transferred an asset to our TRS that had a tax basis in excess of its book basis. We recognized a deferred tax asset for the amount we expect to be realizable. Because the transfer was done amongst entities under common control, we recorded the $1.9 million impact of the transaction to additional paid in capital.
- 117 -
Table of Contents
We recorded a deferred tax liability of $0 million as of December 31, 2015 and 2014, respectively, related to the activities of our TRS. Our deferred tax liability is included in Accounts payable, accrued expenses and other on our consolidated balance sheet. Deferred income taxes represent the tax effect from continuing operations of the differences between the book and tax basis of assets and liabilities, and for equity-based compensation it represents the impact of the vesting of restricted stock. Deferred tax assets (liabilities) include the following as of December 31:
| 2015 | 2014 | |||||||
| (dollars in millions) | ||||||||
| Financing receivable basis difference |
$ | (6 | ) | $ | (6 | ) | ||
| Other |
(2 | ) | (0 | ) | ||||
|
|
|
|
|
|||||
| Gross deferred tax liabilities |
(8 | ) | (6 | ) | ||||
|
|
|
|
|
|||||
| Net operating loss (NOL) carryforwards |
9 | 4 | ||||||
| Equity-based compensation |
2 | 1 | ||||||
| Other |
0 | 1 | ||||||
| Valuation allowance |
(3 | ) | | |||||
|
|
|
|
|
|||||
| Gross deferred tax assets |
8 | 6 | ||||||
|
|
|
|
|
|||||
| Net deferred tax liabilities |
$ | | $ | | ||||
|
|
|
|
|
|||||
The ability to carryforward our NOL of approximately $23 million will begin to expire in 2034 for federal and state tax purposes if not utilized. If our TRS entities were to experience a change in control as defined in Section 382 of the Internal Revenue Code, the TRSs ability to utilize NOL in the years after the change in control would be limited.
We have no examinations in progress, none are expected at this time, and years 2012 through 2014 are open. As of December 31, 2015 and 2014, we had no uncertain tax positions. Our policy is to recognize interest expense and penalties related to income tax matters as a component of other expense. There was no accrued interest and penalties as of December 31, 2015 and 2014, and no interest and penalties were recognized during 2015, 2014, or 2013.
For federal income tax purposes, the cash dividends paid for the years ended December 31, 2015 and 2014 are characterized as follows:
| 2015 | 2014 | |||||||
| Common distributions |
||||||||
| Ordinary income |
23 | % | 5 | % | ||||
| Return of capital |
77 | % | 95 | % | ||||
|
|
|
|
|
|||||
| 100 | % | 100 | % | |||||
|
|
|
|
|
|||||
As our aggregate distributions paid in 2015 and 2014 exceeded our taxable earnings and profits for such year:
| | the January 2016 distribution declared in the fourth quarter of 2015, and payable to shareholders of record as of December 30, 2015, will be treated as a 2016 distribution for federal income tax purposes and is not included in the 2015 tax characterization shown above, and |
| | the January 2015 distribution declared in the fourth quarter of 2014, and payable to shareholders of record as of December 19, 2014, will be treated as a 2015 distribution for federal income tax purposes and is not included in the 2014 tax characterization shown above |
- 118 -
Table of Contents
11. Equity
Dividends and Distributions
Our board of directors declared the following dividends in 2014 and 2015:
| Announced Date |
Record Date | Pay Date | Amount per share | |||||||||
| 3/13/14 |
3/27/14 | 4/9/14 | $ | 0.22 | ||||||||
| 6/17/14 |
6/27/14 | 7/10/14 | $ | 0.22 | ||||||||
| 9/16/14 |
9/26/14 | 10/9/14 | $ | 0.22 | ||||||||
| 12/8/14 |
12/19/14 | 1/9/15 | $ | 0.26 | ||||||||
| 3/17/15 |
3/30/15 | 4/9/15 | $ | 0.26 | ||||||||
| 6/16/15 |
6/30/15 | 7/9/15 | $ | 0.26 | ||||||||
| 9/16/15 |
9/30/15 | 10/8/15 | $ | 0.26 | ||||||||
| 12/15/15 |
12/30/15 | 1/7/16 | $ | 0.30 | ||||||||
We completed the following public offerings of common stock:
| Closing Date |
Shares Issued 1 |
Price Per Share |
Net Proceeds 2 |
|||||||||
| (amounts in millions, except per share amounts) | ||||||||||||
| 4/23/13 |
14.15 | $ | 12.50 | $ | 160 | |||||||
| 4/29/14 |
5.75 | $ | 13.00 | $ | 70 | |||||||
| 10/31/14 |
4.60 | $ | 13.60 | $ | 59 | |||||||
| 5/4/15 |
4.60 | $ | 18.50 | $ | 82 | |||||||
| 10/19/15 |
5.75 | $ | 18.00 | $ | 99 | |||||||
| 1 | Includes shares issued in connection with the exercise of the underwriters option to purchase additional shares. |
| 2 | Net proceeds from the offerings is shown after deducting underwriting discounts, commissions, other offering costs and, in the case of our IPO, formation transaction costs. |
Awards of Shares of Restricted Common Stock under our 2013 Plan
We recognize equity-based compensation expense as described in Note 2 and have issued both awards with service conditions and awards with both service and performance conditions. During the year ended December 31, 2015, our board of directors awarded employees and directors 196,517 shares of restricted common stock that vest in 2015 to 2019 and 390,131 shares of restricted common stock to certain employees that vest upon the achievement of certain performance targets. As of December 31, 2015, we have concluded that it is probable that the performance conditions will be met.
For the years ended December 31, 2015 and 2014, we recorded $11 million and $5 million of equity-based compensation expense, respectively. For the year ended December 31,2013, we recorded $7 million of equity-based compensation expense, including the compensation expense associated with the reallocation of Predecessors membership units to employees at the time of the IPO. The total unrecognized compensation expense related to awards of shares of restricted common stock was $9 million as of December 31, 2015, that is expected to be recognized over a weighted-average term of approximately two years. The calculation of the equity-based compensation expense assumes a forfeiture rate up to 5%.
- 119 -
Table of Contents
A summary of the unvested shares of restricted common stock that have been issued is as follows:
| Restricted Shares of Common Stock |
Weighted Average Share Price |
Value (in millions) |
||||||||||
| BalanceApril 23, 2013 |
606,415 | $ | 12.50 | $ | 7.6 | |||||||
| Granted |
10,800 | 12.37 | 0.1 | |||||||||
| Vested |
| | | |||||||||
| Forfeited |
(18,400 | ) | 12.50 | (0.2 | ) | |||||||
|
|
|
|
|
|
|
|||||||
| BalanceDecember 31, 2013 |
598,815 | $ | 12.50 | $ | 7.5 | |||||||
| Granted |
529,100 | 14.18 | 7.5 | |||||||||
| Vested |
(149,709 | ) | 12.50 | (1.9 | ) | |||||||
| Forfeited |
(13,386 | ) | 12.99 | (0.2 | ) | |||||||
|
|
|
|
|
|
|
|||||||
| BalanceDecember 31, 2014 |
964,820 | $ | 13.41 | $ | 12.9 | |||||||
| Granted |
586,648 | 17.29 | 10.2 | |||||||||
| Vested |
(285,289 | ) | 13.61 | (3.9 | ) | |||||||
| Forfeited |
(18,110 | ) | 15.54 | (0.3 | ) | |||||||
|
|
|
|
|
|
|
|||||||
| Ending BalanceDecember 31, 2015 |
1,248,069 | $ | 15.16 | $ | 18.9 | |||||||
|
|
|
|
|
|
|
|||||||
12. Earnings per Share of Common Stock
Both the net income or loss attributable to the non-controlling OP units and the non-controlling limited partners outstanding OP units have been excluded from the net of income or loss and the diluted earnings per share calculation attributable to common stockholders.
Unvested share-based payment awards that contain non-forfeitable rights to dividends or dividend equivalents (whether paid or unpaid) are participating securities and are included in the computation of earnings per share pursuant to the two-class method. Any shares of common stock which, if included in the diluted earnings per share calculation, would have an anti-dilutive effect have been excluded from the diluted earnings per share calculation.
The computation of basic and diluted earnings per common share is as follows:
| Year ended December 31, | ||||||||
| Numerator: |
2015 | 2014 | ||||||
| (in millions, except share and per share data) | ||||||||
| Net income attributable to controlling shareholders and participating securities |
$ | 8.0 | $ | 9.6 | ||||
| Less: Dividends paid on participating securities |
(1.4 | ) | (0.8 | ) | ||||
| Undistributed earnings attributable to participating securities |
| | ||||||
|
|
|
|
|
|||||
| Net income attributable to controlling shareholders |
$ | 6.6 | $ | 8.8 | ||||
|
|
|
|
|
|||||
| Denominator: |
||||||||
| Weighted-average number of common sharesbasic |
30,761,151 | 20,656,826 | ||||||
|
|
|
|
|
|||||
| Weighted-average number of common sharesdiluted |
30,761,151 | 20,656,826 | ||||||
|
|
|
|
|
|||||
| Basic earnings per common share |
$ | 0.21 | $ | 0.43 | ||||
|
|
|
|
|
|||||
| Diluted earnings per common share |
$ | 0.21 | $ | 0.43 | ||||
|
|
|
|
|
|||||
| Other Information: |
||||||||
| Weighted-average number of OP units |
294,884 | 342,648 | ||||||
|
|
|
|
|
|||||
| Unvested restricted common stock outstanding |
1,248,069 | 964,820 | ||||||
|
|
|
|
|
|||||
- 120 -
Table of Contents
13. Equity Method Investments in Affiliate
Strong Upwind
As described in Notes 1 and 2, we have noncontrolling equity investments in entities that own minority interests in wind projects. During the year ended December 31, 2015, we recognized a loss of $0.1 million, from our equity method investments. We did not have any income or loss from our equity method investments in 2014.
The following is a summary of the consolidated financial position and results of operations of the significant holding companies, accounted for using the equity method:
| As of and for the nine months ended September 30, 2015 |
As of and for the year ended December 31, 2014 |
|||||||
| (in millions, unaudited) | ||||||||
| Current Assets |
$ | 46 | $ | 62 | ||||
| Total Assets |
$ | 1,420 | $ | 1,501 | ||||
| Current Liabilities |
$ | 12 | $ | 18 | ||||
| Total Liabilities |
$ | 59 | $ | 66 | ||||
| Members Equity |
$ | 1,361 | $ | 1,435 | ||||
| Revenue |
$ | 109 | $ | 154 | ||||
| Income from Continuing Operations |
$ | 22 | $ | 44 | ||||
| Net Income |
$ | 22 | $ | 44 | ||||
14. Intangible Assets and Goodwill
During the year ended December 31, 2014, we recorded goodwill of $2 million related to the real estate acquisitions described in Note 1. We also recorded real estate related lease intangibles that are described in Note 6.
In connection with a business purchase combination, which occurred in 2007, we recorded intangible assets of $5 million to be amortized over their estimated useful life and goodwill of $4 million. Based on our annual goodwill impairment test, we determined that the goodwill of the reporting unit is considered not impaired as its fair value exceeds the carrying amount. The remaining unamortized balance of the intangible assets was $1 million as of December 31, 2015 and $2 million as of December 31, 2014. Intangible amortization expense in each of the years ended December 31, 2015 and 2014 was $0.2 million and $0.3 million for the year ended December 31, 2013. Future amortization expenses related to non real estate related amortizable intangible assets at December 31, 2015 will be approximately $0.2 million annually through the year ending December 31, 2021. Non real estate intangible assets and goodwill are included in the other assets line item in the consolidated balance sheets.
15. Defined Contribution Plan
We administer a 401(k) savings plan, a defined contribution plan covering substantially all of our employees. Employees in the plan may contribute up to the maximum annual IRS limit before taxes via payroll deduction. Under the plan, we provide a dollar for dollar match for the first 4% of the employees contributions and a $0.50 per dollar match for the next 2% of employee contributions. We contributed $0.3 million, $0.2 million, and $0.2 million under the plan for the years ended December 31, 2015, 2014, and 2013, respectively.
- 121 -
Table of Contents
16. Selected Quarterly Financial Data (Unaudited)
The following table summarizes our quarterly financial data which, in the opinion of management, reflects all adjustments, consisting only of normal recurring adjustments, necessary for a fair presentation of our results of operations (Amounts for the individual quarters when aggregated may not agree to the full year due to rounding, in thousands, except for per share data):
| For the Three-Months Ended | ||||||||||||||||
| March 31, 2015 | June 30, 2015 | Sept. 30, 2015 | Dec. 31, 2015 | |||||||||||||
| Total Revenue, net of investment interest expense and provision |
$ | 7,760 | $ | 7,428 | $ | 8,354 | $ | 8,752 | ||||||||
|
|
|
|
|
|
|
|
|
|||||||||
| Other Expenses, net |
(5,636 | ) | (5,868 | ) | (6,188 | ) | (6,450 | ) | ||||||||
|
|
|
|
|
|
|
|
|
|||||||||
| Net income before income tax |
$ | 2,124 | $ | 1,560 | $ | 2,166 | $ | 2,302 | ||||||||
|
|
|
|
|
|
|
|
|
|||||||||
| Income tax benefit (expense) |
23 | (76 | ) | (24 | ) | (41 | ) | |||||||||
|
|
|
|
|
|
|
|
|
|||||||||
| Net Income |
$ | 2,147 | $ | 1,484 | $ | 2,142 | $ | 2,261 | ||||||||
|
|
|
|
|
|
|
|
|
|||||||||
| Net Income attributable to controlling shareholders |
$ | 2,122 | $ | 1,470 | $ | 2,119 | $ | 2,247 | ||||||||
|
|
|
|
|
|
|
|
|
|||||||||
| Basic earnings per common share |
$ | 0.07 | $ | 0.04 | $ | 0.06 | $ | 0.05 | ||||||||
| Diluted earnings per common share |
$ | 0.07 | $ | 0.04 | $ | 0.06 | $ | 0.05 | ||||||||
| For the Three-Months Ended | ||||||||||||||||
| March 31, 2014 | June 30, 2014 | Sept. 30, 2014 | Dec. 31, 2014 | |||||||||||||
| Total Revenue, net of investment interest expense and provision |
$ | 5,699 | $ | 7,572 | $ | 7,813 | $ | 7,536 | ||||||||
|
|
|
|
|
|
|
|
|
|||||||||
| Other Expenses, net |
(2,826 | ) | (5,527 | ) | (4,604 | ) | (5,867 | ) | ||||||||
|
|
|
|
|
|
|
|
|
|||||||||
| Net income before income tax |
$ | 2,873 | $ | 2,045 | $ | 3,209 | $ | 1,669 | ||||||||
|
|
|
|
|
|
|
|
|
|||||||||
| Income tax (expense) benefit |
(60 | ) | 830 | (607 | ) | (189 | ) | |||||||||
|
|
|
|
|
|
|
|
|
|||||||||
| Net Income |
$ | 2,813 | $ | 2,875 | $ | 2,602 | $ | 1,480 | ||||||||
|
|
|
|
|
|
|
|
|
|||||||||
| Net Income attributable to controlling shareholders |
$ | 2,753 | $ | 2,828 | $ | 2,564 | $ | 1,462 | ||||||||
|
|
|
|
|
|
|
|
|
|||||||||
| Basic earnings per common share |
$ | 0.17 | $ | 0.13 | $ | 0.11 | $ | 0.05 | ||||||||
| Diluted earnings per common share |
$ | 0.17 | $ | 0.13 | $ | 0.11 | $ | 0.05 | ||||||||
- 122 -
Table of Contents
| Item 9. | Changes in and Disagreements with Accountants on Accounting and Financial Disclosure. |
None.
| Item 9A. | Controls and Procedures. |
A review and evaluation was performed by our management, including our Chief Executive Officer (the CEO) and Chief Financial Officer (the CFO), of the effectiveness of the design and operation of our disclosure controls and procedures (as such term is defined in Rules 13a-15(e) and 15d-15(e) under the Exchange Act), as of the end of the period covered by this Form 10-K. Based on that review and evaluation, the CEO and CFO have concluded that our current disclosure controls and procedures, as designed and implemented, were effective. Notwithstanding the foregoing, a control system, no matter how well designed and operated, can provide only reasonable, not absolute, assurance that it will detect or uncover failures within our company to disclose material information otherwise required to be set forth in our periodic reports.
Our management is responsible for establishing and maintaining adequate internal control over financial reporting. Internal control over financial reporting is defined in Rules 13a-15(f) and 15d-15(f) promulgated under the Exchange Act as a process designed by, or under the supervision of, our principal executive and principal financial officers and effected by our board of directors, management and other personnel to provide reasonable assurance regarding the reliability of financial reporting and the preparation of financial statements for external purposes in accordance with U.S. GAAP and includes those policies and procedures that:
| | pertain to the maintenance of records that in reasonable detail accurately and fairly reflect the transactions and dispositions of the assets of our company; |
| | provide reasonable assurance that transactions are recorded as necessary to permit preparation of financial statements in accordance with U.S. GAAP, and that our receipts and expenditures are being made only in accordance with authorizations of our management and directors; and |
| | provide reasonable assurance regarding prevention or timely detection of unauthorized acquisition, use or disposition of our assets that could have a material effect on the financial statements. |
Because of its inherent limitations, internal control over financial reporting may not prevent or detect misstatements. Projections of any evaluation of effectiveness to future periods are subject to the risks that controls may become inadequate because of changes in conditions or that the degree of compliance with the policies or procedures may deteriorate.
Our management assessed the effectiveness of our internal control over financial reporting as of December 31, 2015. In making this assessment, our management used criteria set forth by the Committee of Sponsoring Organizations of the Treadway Commission in Internal Control-Integrated Framework (2013 Framework).
Based on this assessment, our management believes that, as of December 31, 2015, our internal control over financial reporting was effective based on those criteria.
There have been no changes in our internal control over financial reporting that occurred during the quarter ended December 31, 2015 that have materially affected, or are reasonably likely to materially affect, our internal control over financial reporting.
This annual report does not include an attestation report of our registered public accounting firm regarding internal control over financial reporting pursuant to rules of the SEC that permit our company to provide only managements report in this annual report.
| Item 9B. | Other Information. |
None.
- 123 -
Table of Contents
PART III
| Item 10. | Directors, Executive Officers and Corporate Governance. |
The information regarding our directors, executive officers and certain other matters required by Item 401 of Regulation S-K is incorporated herein by reference to our definitive proxy statement relating to our annual meeting of stockholders (the Proxy Statement), to be filed with the SEC within 120 days after December 31, 2015.
The information regarding compliance with Section 16(a) of the Exchange Act required by Item 405 of Regulation S-K is incorporated herein by reference to the Proxy Statement to be filed with the SEC within 120 days after December 31, 2015.
The information regarding our Code of Business Conduct and Ethics required by Item 406 of Regulation S-K is incorporated herein by reference to the Proxy Statement to be filed with the SEC within 120 days after December 31, 2015.
The information regarding certain matters pertaining to our corporate governance required by Item 407(c)(3), (d)(4) and (d)(5) of Regulation S-K is incorporated by reference to the Proxy Statement to be filed with the SEC within 120 days after December 31, 2015.
| Item 11. | Executive Compensation. |
The information regarding executive compensation and other compensation related matters required by Items 402 and 407(e)(4) and (e)(5) of Regulation S-K is incorporated herein by reference to the Proxy Statement to be filed with the SEC within 120 days after December 31, 2015.
| Item 12. | Security Ownership of Certain Beneficial Owners and Management and Related Stockholder Matters. |
The tables on equity compensation plan information and beneficial ownership of our Company required by Items 201(d) and 403 of Regulation S-K are incorporated herein by reference to the Proxy Statement to be filed with the SEC within 120 days after December 31, 2015.
| Item 13. | Certain Relationships and Related Transactions and Director Independence. |
The information regarding transactions with related persons, promoters and certain control persons and director independence required by Items 404 and 407(a) of Regulation S-K is incorporated herein by reference to the Proxy Statement to be filed with the SEC within 120 days after December 31, 2015.
| Item 14. | Principal Accountant Fees and Services. |
The information concerning principal accounting fees and services and the Audit Committees pre-approval policies and procedures required by Item 14 is incorporated herein by reference to the Proxy Statement to be filed with the SEC within 120 days after December 31, 2015.
- 124 -
Table of Contents
PART IV
| Item 15. | Exhibits and Financial Statement Schedules. |
Documents filed as part of the report
The following documents are filed as part of this Form 10-K in Part II, Item 8 and are incorporated by reference:
(a)(1) Financial Statements:
See index in Item 8Financial Statements and Supplementary Data, filed herewith for a list of financial statements.
| (3) | Exhibits Files: |
| Exhibit |
Exhibit description |
|
| 3.1 |
Articles of Amendment and Restatement of Hannon Armstrong Sustainable Infrastructure Capital, Inc. (incorporated by reference to Exhibit 3.1 to the Registrants Form 10-Q for the quarter ended June 30, 2013 (No. 001-35877), filed on August 9, 2013) | |
| 3.2 |
Bylaws of Hannon Armstrong Sustainable Infrastructure Capital, Inc. (incorporated by reference to Exhibit 3.2 to the Registrants Form 10-Q for the quarter ended June 30, 2013 (No. 001-35877), filed on August 9, 2013) | |
| 3.3 |
Amended and Restated Agreement of Limited Partnership of Hannon Armstrong Sustainable Infrastructure, L.P. (incorporated by reference to Exhibit 3.3 to the Registrants Form 10-Q for the quarter ended June 30, 2013 (No. 001-35877), filed on August 9, 2013) | |
| 4.1 |
Specimen Common Stock Certificate of Hannon Armstrong Sustainable Infrastructure Capital, Inc. (incorporated by reference to Exhibit 4.1 to Amendment No. 3 to the Registrants Form S-11 (No. 333-186711), filed on April 12, 2013) | |
| 10.1 |
Form of Indemnification Agreement (incorporated by reference to Exhibit 10.5 to Amendment No. 3 to the Registrants Form S-11 (No. 333-186711), filed on April 12, 2013) | |
| 10.2 |
2013 Hannon Armstrong Sustainable Infrastructure Capital, Inc. Equity Incentive Plan (incorporated by reference to Exhibit 10.1 to the Registrants Form 10-Q for the quarter ended June 30, 2013 (No. 001-35877), filed on August 9, 2013) | |
| 10.3 |
Restricted Stock Award Agreement dated April 23, 2013 between Hannon Armstrong Sustainable Infrastructure Capital, Inc. and Jeffrey W. Eckel (incorporated by reference to Exhibit 10.2 to the Registrants Form 10-Q for the quarter ended June 30, 2013 (No. 001-35877), filed on August 9, 2013) | |
| 10.4 |
Form of Restricted Stock Award Agreement (Executive Officers) (incorporated by reference to Exhibit 10.3 to the Registrants Form 10-Q for the quarter ended June 30, 2013 (No. 001-35877), filed on August 9, 2013) | |
| 10.5 |
Form of Restricted Stock Award Agreement (Non-employee Directors) (incorporated by reference to Exhibit 10.4 to the Registrants Form 10-Q for the quarter ended June 30, 2013 (No. 001-35877), filed on August 9, 2013) | |
| 10.6 |
Form of Restricted Stock Unit Award Agreement (incorporated by reference to Exhibit 10.5 to the Registrants Form 10-Q for the quarter ended June 30, 2013 (No. 001-35877), filed on August 9, 2013) | |
- 125 -
Table of Contents
| 10.7 |
Registration Rights Agreement, dated April 23, 2013, by and among Hannon Armstrong Sustainable Infrastructure Capital, Inc. and the parties listed on Schedule I thereto (incorporated by reference to Exhibit 10.6 to the Registrants Form 10-Q for the quarter ended June 30, 2013 (No. 001-35877), filed on August 9, 2013) | |
| 10.8 |
Employment Agreement, dated April 17, 2013, by and between Hannon Armstrong Sustainable Infrastructure Capital, Inc. and Jeffrey Eckel (incorporated by reference to Exhibit 10.7 to the Registrants Form 10-Q for the quarter ended June 30, 2013 (No. 001-35877), filed on August 9, 2013) | |
| 10.9 |
Employment Agreement, dated April 17, 2013, by and between Hannon Armstrong Sustainable Infrastructure Capital, Inc. and J. Brendan Herron, Jr. (incorporated by reference to Exhibit 10.8 to the Registrants Form 10-Q for the quarter ended June 30, 2013 (No. 001-35877), filed on August 9, 2013) | |
| 10.10 |
Employment Agreement, dated April 17, 2013, by and between Hannon Armstrong Sustainable Infrastructure Capital, Inc. and Steven L. Chuslo (incorporated by reference to Exhibit 10.9 to the Registrants Form 10-Q for the quarter ended June 30, 2013 (No. 001-35877), filed on August 9, 2013) | |
| 10.11 |
Employment Agreement, dated April 17, 2013, by and between Hannon Armstrong Sustainable Infrastructure Capital, Inc. and Nathaniel J. Rose (incorporated by reference to Exhibit 10.10 to the Registrants Form 10-Q for the quarter ended June 30, 2013 (No. 001-35877), filed on August 9, 2013) | |
| 10.12 |
Employment Agreement, dated April 17, 2013, by and between Hannon Armstrong Sustainable Infrastructure Capital, Inc. and Marvin R. Wooten (incorporated by reference to Exhibit 10.11 to the Registrants Form 10-Q for the quarter ended June 30, 2013 (No. 001-35877), filed on August 9, 2013) | |
| 10.13 |
Employment Agreement, dated April 17, 2013, by and between Hannon Armstrong Sustainable Infrastructure Capital, Inc. and Daniel McMahon (incorporated by reference to Exhibit 10.3 to the Registrants Form 10-Q for the quarter ended June 30, 2015 (No. 001-35877), filed on August 7, 2015) | |
| 10.14 |
Agreement and Plan of Merger, dated as of April 23, 2013, by and among Hannon Armstrong Sustainable Infrastructure Capital, Inc., HA Merger Sub I LLC, HA Merger Sub III LLC, MissionPoint HA Parallel Fund, LLC, MissionPoint ES Parallel Fund I, L.P., MissionPoint HA Parallel Fund I Corp. and MissionPoint HA Parallel Fund, L.P. (incorporated by reference to Exhibit 10.12 to the Registrants Form 10-Q for the quarter ended June 30, 2013 (No. 001-35877), filed on August 9, 2013) | |
| 10.15 |
Agreement and Plan of Merger, dated as of April 23, 2013, by and among Hannon Armstrong Sustainable Infrastructure Capital, Inc., HA Merger Sub II LLC, HA Merger Sub III LLC, MissionPoint HA Parallel Fund II, LLC, MissionPoint ES Parallel Fund II, L.P. MissionPoint HA Parallel Fund II Corp. and MissionPoint HA Parallel Fund, L.P. (incorporated by reference to Exhibit 10.13 to the Registrants Form 10-Q for the quarter ended June 30, 2013 (No. 001-35877), filed on August 9, 2013) | |
| 10.16 |
Trust Agreement relating to HASI SYB 2013-1 Trust, dated as of December 20, 2013, among HASI SYB 2013-1 Trust, HASI SYB I LLC, HAT SYB I LLC, The Bank of New York Mellon as Trustee and Hannon Armstrong Sustainable Infrastructure Capital, Inc. (incorporated by reference to Exhibit 10.26 to the Registrants Form 10-K for the year ended December 31, 2013 (No. 001-35877), filed on March 18, 2014) | |
- 126 -
Table of Contents
| 10.17 |
Note Purchase Agreement, dated as of December 20, 2013, among HASI SYB 2013-1 Trust, HASI SYB I LLC, HAT SYB I LLC, The Bank of New York Mellon as Trustee and the purchaser of the notes thereunder (incorporated by reference to Exhibit 10.27 to the Registrants Form 10-K for the year ended December 31, 2013 (No. 001-35877), filed on March 18, 2014) | |
| 10.18 |
Unit Purchase Agreement, dated as of May 28, 2014, by and among Hannon Armstrong Sustainable Infrastructure Capital, Inc., American Wind Capital Company, LLC, Northwharf Nominees Limited, DBD AWCC LLC, NGP Energy Technology Partners II, L.P. and C.C. Hinckley Company, LLC (incorporated by reference to Exhibit 10.1 to the Registrants Form 10-Q for the quarter ended June 30, 2014 (No. 001-35877), filed on August 14, 2014) | |
| 10.19 |
Agreement for Professional Services, dated as of May 28, 2014, by and among Hannon Armstrong Capital, LLC and AWCC Capital, LLC (incorporated by reference to Exhibit 10.2 to the Registrants Form 10-Q for the quarter ended June 30, 2014 (No. 001-35877), filed on August 14, 2014) | |
| 10.20 |
First Amendment to the Registration Rights Agreement of Hannon Armstrong Sustainable Infrastructure Capital, Inc. (incorporated by reference to Exhibit 10.1 to the Registrants Form 8-K (No. 001-35877), filed on June 20, 2014) | |
| 10.21 |
Amendment No. 2 to PF Loan Agreement and Amendment No. 1 to Intercreditor Agreement dated as of May 28, 2014, by and among HASI CF I Borrower LLC, and HAT CF I Borrower LLC and Bank of America, N.A. (incorporated by reference to Exhibit 1.1 to the Registrants Form 8-K (No. 001-35877), filed on June 3, 2014) | |
| 10.22 |
Amended and Restated PF Loan Agreement, dated as of August 12, 2014, by and among HASI CF I Borrower LLC, HAT CF I Borrower LLC, HAT CF II Borrower LLC each lender from time to time party thereto and Bank of America, N.A. (incorporated by reference to Exhibit 10.1 to the Registrants Form 10-Q for the quarter ended September 30, 2014 (No. 001-35877), filed on November 7, 2014) | |
| 10.23 |
Amended and Restated PF Continuing Guaranty, dated as of August 12, 2014, by and among Hannon Armstrong Sustainable Infrastructure Capital, Inc., Hannon Armstrong Sustainable Infrastructure, LP, and Hannon Armstrong Capital, LLC (incorporated by reference to Exhibit 10.2 to the Registrants Form 10-Q for the quarter ended September 30, 2014 (No. 001-35877), filed on November 7, 2014) | |
| 10.24 |
Amended and Restated PF Limited Guaranty, dated as of August 12, 2014, by HAT Holdings I LLC (incorporated by reference to Exhibit 10.3 to the Registrants Form 10-Q for the quarter ended September 30, 2014 (No. 001-35877), filed on November 7, 2014) | |
| 10.25 |
PF Limited Guaranty, dated as of August 12, 2014, by HAT Holdings II LLC (incorporated by reference to Exhibit 10.4 to the Registrants Form 10-Q for the quarter ended September 30, 2014 (No. 001-35877), filed on November 7, 2014) | |
| 10.26 |
Amended and Restated G&I Loan Agreement, dated as of August 12, 2014, by and among HASI CF I Borrower LLC, HAT CF I Borrower LLC, HAT CF II Borrower LLC each lender from time to time party thereto and Bank of America, N.A. (incorporated by reference to Exhibit 10.5 to the Registrants Form 10-Q for the quarter ended September 30, 2014 (No. 001-35877), filed on November 7, 2014) | |
| 10.27 |
Amended and Restated G&I Continuing Guaranty, dated as of August 12, 2014, by and among Hannon Armstrong Sustainable Infrastructure Capital, Inc., Hannon Armstrong Sustainable Infrastructure, LP, and Hannon Armstrong Capital, LLC (incorporated by reference to Exhibit 10.6 to the Registrants Form 10-Q for the quarter ended September 30, 2014 (No. 001-35877), filed on November 7, 2014) | |
- 127 -
Table of Contents
| 10.28 |
Amended and Restated G&I Limited Guaranty, dated as of August 12, 2014, by HAT Holdings I LLC (incorporated by reference to Exhibit 10.7 to the Registrants Form 10-Q for the quarter ended September 30, 2014 (No. 001-35877), filed on November 7, 2014) | |
| 10.29 |
G&I Limited Guaranty, dated as of August 12, 2014, by HAT Holdings II LLC (incorporated by reference to Exhibit 10.8 to the Registrants Form 10-Q for the quarter ended September 30, 2014 (No. 001-35877), filed on November 7, 2014) | |
| 10.30 |
Form of Amended and Restated PF and G&I Security Agreement, dated as of August 12, 2014, by and among HASI CF I Borrower LLC, HAT CF I Borrower LLC, HAT CF II Borrower LLC and Bank of New York Mellon (incorporated by reference to Exhibit 10.9 to the Registrants Form 10-Q for the quarter ended September 30, 2014 (No. 001-35877), filed on November 7, 2014) | |
| 10.31 |
Form of Amended and Restated PF and G&I Pledge and Security Agreement, dated as of August 12, 2014 (incorporated by reference to Exhibit 10.10 to the Registrants Form 10-Q for the quarter ended September 30, 2014 (No. 001-35877), filed on November 7, 2014) | |
| 10.32 |
Amendment No. 1 to Amended and Restated PF Loan Agreement, dated as of September 22, 2014, by and among HASI CF I Borrower LLC, HAT CF I Borrower LLC, HAT CF II Borrower LLC, each lender from time to time party thereto and Bank of America, N.A. (incorporated by reference to Exhibit 10.11 to the Registrants Form 10-Q for the quarter ended September 30, 2014 (No. 001-35877), filed on November 7, 2014) | |
| 10.33 |
Amendment No. 1 to Amended and Restated G&I Loan Agreement, dated as of September 22, 2014, by and among HASI CF I Borrower LLC, HAT CF I Borrower LLC, HAT CF II Borrower LLC, each lender from time to time party thereto and Bank of America, N.A. (incorporated by reference to Exhibit 10.12 to the Registrants Form 10-Q for the quarter ended September 30, 2014 (No. 001-35877), filed on November 7, 2014) | |
| 10.34 |
Amendment No. 2 to Amended and Restated Loan Agreement (PF) and Amendment No. 1 to Amended & Restated Intercreditor Agreement, dated December 22, 2014 (incorporated by reference to Exhibit 1.1 to the Registrants Form 8-K (No. 001-35877), filed on December 24, 2014) | |
| 10.35 |
Amendment No. 2 to Amended and Restated Loan Agreement (G&I) and Amendment No. 1 to Amended & Restated Intercreditor Agreement, dated December 22, 2014 (incorporated by reference to Exhibit 1.2 to the Registrants Form 8-K (No. 001-35877), filed on December 24, 2014) | |
| 10.36 |
Amendment No. 1 and Reaffirmation of Guaranty to the Amended & Restated Continuing Guaranty (PF), dated December 22, 2014 (incorporated by reference to Exhibit 1.3 to the Registrants Form 8-K (No. 001-35877), filed on December 24, 2014) | |
| 10.37 |
Amendment No. 1 and Reaffirmation of Guaranty to the Amended & Restated Continuing Guaranty (G&I), dated December 22, 2014 (incorporated by reference to Exhibit 1.4 to the Registrants Form 8-K (No. 001-35877), filed on December 24, 2014) | |
| 10.38 |
Credit Agreement dated as of October 15, 2014, among HA WIND I LLC, as the Borrower, The Financial Institutions and Other Persons From Time To Time Parties Hereto, as the Lenders and Bank of America, N.A., as Administrative Agent and Collateral Agent (incorporated by reference to Exhibit 10.39 to the Registrants Form 10-K for the year ended December 31, 2014 (No. 001-35877), filed on March 9, 2015) | |
| 10.39 |
Amendment No. 3 to Amended and Restated Loan Agreement (PF) and Amendment No. 2 to Amended & Restated Intercreditor Agreement, dated April 17, 2015 (incorporated by reference to Exhibit 1.1 to the Registrants Form 8-K (No. 001-35877), filed on April 21, 2015) | |
- 128 -
Table of Contents
| 10.40 |
Amendment No. 3 to Amended and Restated Loan Agreement (G&I) and Amendment No. 2 to Amended & Restated Intercreditor Agreement, dated April 17, 2015 (incorporated by reference to Exhibit 1.2 to the Registrants Form 8-K (No. 001-35877), filed on April 21, 2015) | |
| 10.41 |
Amendment No. 4 to Amended and Restated Loan Agreement (G&I) and Amendment No. 3 to Amended & Restated Intercreditor Agreement, dated July 16, 2015 (incorporated by reference to Exhibit 1.1 to the Registrants Form 8-K (No. 001-35877), filed on July 17, 2015) | |
| 10.42 |
Amendment No. 4 to Amended and Restated Loan Agreement (PF), dated July 16, 2015 (incorporated by reference to Exhibit 1.2 to the Registrants Form 8-K (No. 001-35877), filed on July 17, 2015) | |
| 10.43 |
Reaffirmation of Guaranty (G&I), dated July 16, 2015 (incorporated by reference to Exhibit 1.3 to the Registrants Form 8-K (No. 001-35877), filed on July 17, 2015) | |
| 10.44 |
Employment Agreement, dated April 17, 2013, by and between Hannon Armstrong Sustainable Infrastructure Capital, Inc. and Daniel McMahon (incorporated by reference to Exhibit 10.3 to the Registrants Form 10-Q for the quarter ended June 30, 2015 (No. 001-35877), filed on August 7, 2015) | |
| 10.45 |
Indenture, dated as of September 30, 2015, among HASI SYB Trust 2015-1, the Bank of New York Mellon and Hannon Armstrong Capital, LLC (incorporated by reference to Exhibit 10.4 to the Registrants Form 10-Q for the quarter ended September 30, 2015 (No. 001-35877), filed on November 5, 2015) | |
| 10.46 |
Bond Purchase Agreement (Class A), dated as of September 30, 2015, among HASI SYB Trust 2015-1, HA Land Lease Holdings, LLC and the purchasers named therein (incorporated by reference to Exhibit 10.5 to the Registrants Form 10-Q for the quarter ended September 30, 2015 (No. 001-35877), filed on November 5, 2015) | |
| 10.47 |
Contribution and Sale Agreement, dated as of September 30, 2015, among HASI SYB Trust 2015-1, and HA Land Lease Holdings, LLC (incorporated by reference to Exhibit 10.6 to the Registrants Form 10-Q for the quarter ended September 30, 2015 (No. 001-35877), filed on November 5, 2015) | |
| 10.48 |
Indemnity Agreement, dated as of September 30, 2015, by Hannon Armstrong Sustainable Infrastructure Capital, Inc. in favor of the Bank of New York Mellon (incorporated by reference to Exhibit 10.7 to the Registrants Form 10-Q for the quarter ended September 30, 2015 (No. 001-35877), filed on November 5, 2015) | |
| 21.1* |
List of subsidiaries of Hannon Armstrong Sustainable Infrastructure Capital, Inc. | |
| 23.1* |
Consent of Ernst & Young LLP for Hannon Armstrong Sustainable Infrastructure Capital, Inc. | |
| 24.1* |
Power of Attorney (included on signature page) | |
| 31.1* |
Certification of Chief Executive Officer pursuant to Section 302 of the Sarbanes-Oxley Act of 2002 | |
| 31.2* |
Certification of Chief Financial Officer pursuant to Section 302 of the Sarbanes-Oxley Act of 2002 | |
| 32.1** |
Certification of Chief Executive Officer pursuant to section 18 U.S.C. Section 1350 as adopted pursuant to Section 906 of the SarbanesOxley Act of 2002 | |
| 32.2** |
Certification of Chief Financial Officer pursuant to section 18 U.S.C. Section 1350 as adopted pursuant to Section 906 of the SarbanesOxley Act of 2002 | |
| 101.INS* |
XBRL Instance Document | |
- 129 -
Table of Contents
| 101.SCH* |
XBRL Taxonomy Extension Schema | |
| 101.CAL* |
XBRL Taxonomy Extension Calculation Linkbase | |
| 101.DEF* |
XBRL Taxonomy Extension Definition Linkbase | |
| 101.LAB* |
XBRL Taxonomy Extension Label Linkbase | |
| 101 PRE* |
XBRL Taxonomy Extension Presentation Linkbase | |
| * | Filed herewith. |
| ** | Furnished with this report. |
- 130 -
Table of Contents
SIGNATURES
Pursuant to the requirements of Section 13 or 15(d) of the Securities Exchange Act of 1934, the registrant has duly caused this report to be signed on its behalf by the undersigned, thereunto duly authorized.
| HANNON ARMSTRONG SUSTAINABLE INFRASTRUCTURE CAPITAL, INC. |
||
| By: | /s/ Jeffrey W. Eckel |
|
| Name: | Jeffrey W. Eckel | |
| Title: | Chairman, Chief Executive Officer and President | |
- 131 -
Table of Contents
POWER OF ATTORNEY
KNOW ALL PERSONS BY THESE PRESENTS, that each person whose signature appears below constitutes and appoints Jeffrey W. Eckel and J. Brendan Herron, and each of them, with full power to act without the other, such persons true and lawful attorneys-in-fact and agents, with full power of substitution and resubstitution, for him or her and in his or her name, place and stead, in any and all capacities, to sign this Form 10-K and any and all amendments thereto, and to file the same, with exhibits and schedules thereto, and other documents in connection therewith, with the Securities and Exchange Commission, granting unto said attorneys-in-fact and agents, and each of them, full power and authority to do and perform each and every act and thing necessary or desirable to be done in and about the premises, as fully to all intents and purposes as he or she might or could do in person, hereby ratifying and confirming all that said attorneys-in-fact and agents, or any of them, or their or his or her substitute or substitutes, may lawfully do or cause to be done by virtue hereof.
Pursuant to the requirements of the Securities Exchange Act of 1934, as amended, this report has been signed below by the following persons on behalf of the Registrant and in the capacities and on the dates indicated.
| Signatures |
Title |
|||||
| By: | /s/ Jeffrey W. Eckel Jeffrey W. Eckel |
Chairman of the Board, President and Chief Executive Officer (Principal Executive Officer) |
March 1, 2016 | |||
| By: | /s/ J. Brendan Herron J. Brendan Herron |
Chief Financial Officer and Executive Vice President (Principal Financial and Accounting Officer) |
March 1, 2016 | |||
| By: | /s/ Mark J. Cirilli Mark J. Cirilli |
March 1, 2016 | ||||
| By: | /s/ Charles M. ONeil Charles M. ONeil |
March 1, 2016 | ||||
| By: | /s/ Richard J. Osborne Richard J. Osborne |
March 1, 2016 | ||||
| By: | /s/ Jackalyne Pfannenstiel Jackalyne Pfannenstiel |
March 1, 2016 | ||||
| By: | /s/ Steven G. Osgood Steven G. Osgood |
March 1, 2016 | ||||
- 132 -